adaptation extends specific learning algorithms in order to handle multi-label ... domain-independent capabilities of EAs attracts researchers to evolve a set of ...
IJCA Special Issue on “Artificial Intelligence Techniques - Novel Approaches & Practical Applications” AIT, 2011
An Evolutionary Multi Label Classification using Associative Rule Mining for Spatial Preferences J.Arunadevi
Dr.V.Rajamani
Assistant Professor Thiagarajar School of Management Madurai
Principal Indra Ganesan College of Engineering Tirchirapalli
Tamilnadu, India
Tamilnadu, India
ABSTRACT Multi-label spatial classification based on association rules with Multi objective genetic algorithms (MOGA) is proposed to deal with multiple class labels problem which is hard to settle by existing methods. In this paper we adapt problem transformation for the Multi label classification. We use Hybrid evolutionary algorithm for the optimization in the generation of spatial association rules, which addresses single label. MOGA is used to combine the single labels into multi labels with the conflicting objectives predictive accuracy and Comprehensibility. Finally we built the classifier with a sorting mechanism. The algorithm is executed and the results are compared with Decision trees and Neural network based classifiers, the proposed method out performs the existing.
General Terms Datamining, Evolutionary Algorithms
Keywords Multi label Classification, Associative Classification, MOGA, HEA
1. INTRODUCTION The phenomenal growth of spatial data increases the importance of the spatial data mining, which is used to mine fascinating and constructive but inherent knowledge. Classification of spatial stuff is a primary task in spatial data mining. Spatial classification is defined as the task of learning models to predict class labels based on the features of entities as well as the spatial relationships to other entities and their features by Richard Frank et. al [1]. Koperski, K [2] said the goal of spatial classification is to learn the concept associated with each class on the basis of the interaction of two or more spatiallyreferenced objects or space-dependent attributes, according to a particular spacing or set of arrangements. Subhija Ponjavic and Elvir Ferhatbegovic [3] said rapid urbanization process amplifies the need for space planning purposes with emphasis on user preferences on the construction of urban infrastructure for housing, work and a variety of supporting activities of the population. Because of the large number of specific objectives, which are needed to be considered in this planning, the application of spatial classification with multi objectives can have a significant impact on the quality, speed and cost of the planning. Classification is
the important task which can be employed for the space planning with multi objectives. Classification is used to predict the class attributes and the association rule is used to discover correlations among the attributes. Association rule mining is used to find the rules for classification and it is called as Associative classification (AC). AC algorithms outperforms the traditional classification algorithms [4] – [7].But there are few challenges in the associative classification to be addressed so that it can be widely used. Fadi Thabtah [8] said incremental learning, noise in test data sets and the extraction of multi label rules are the major limitations to be concentrated. We propose a spatial associative classification algorithm optimized with the evolutionary algorithms for the classification for space planning to meet the user preferences. We consider classification problem as the multi objective one since if it is considered as the single objective, Satchidananda Dehuri and Sung-Bae Cho [9] said the main demerit associated is that, the generated rules are often more complex than necessary and not easy to comprehend. The reason behind is that the local, greedy search performed by traditional algorithms selects only one feature at a time and, therefore, the feature space is approximated by a set of hypercubes. In real-world applications, the feature space is often very complex and a large set of such hypercubes might be needed to approximate the class boundaries among different classes. Multi-label classification based on association rules with multi objective genetic algorithms (MOGA) is proposed to deal with multiple class labels problem which is hard to settle by existing methods. This algorithm decomposes multi-label data to mine single-label rules optimized by the Hybrid Evolutionary Algorithm (HEA), then combines labels with the same attributes to generate multi-label rules with the help of MOGA. It extracts partial dataset features filtered by MOGA to build the initial classifier through assembling, and conducts classification prediction by assembling the classifiers. Thus, the computational complexity caused by the high dimensional attributes decreases while the performance and efficiency increases. The paper is organized as follows: Section 2 deals with the background concepts of Multi objective view on spatial classification, SAR, MOGA and the ACO applied for the optimization of the rule generation. Section 3 deals with approach followed in this paper, Section 4 explains the
1
IJCA Special Issue on “Artificial Intelligence Techniques - Novel Approaches & Practical Applications” AIT, 2011 comparison metrics. Section 5 discusses the results obtained and Section 7 discusses the application of the paper under the area of consideration and Section 8 gives conclusion of the paper.
as the multi objective classification with the help of genetic algorithms and the association rule mining.
2.2 Associative Classification 2. BACKGROUND STUDY This section is divided into three parts. Section 2.1 discusses the need for considering spatial classifications as a multi objective problem, section 2.2 discusses the use of Associative classification and section 2.3 says about the need for the evolutionary algorithms for the Multi label Classification problem.
2.1 Multi objective view on spatial classification Diansheng Guo and Jeremy Mennis [10] said classification is about grouping data items into classes (categories) according to their properties (attribute values). Ester et al [11], Koperski et al [12] said, spatial classification methods extend the generalpurpose classification methods to consider not only attributes of the object to be classified but also the attributes of neighboring objects and their spatial relations. Ester et al. [10] discussed a neighborhood graph based extension of decision trees that considers both non-spatial attributes of the classified objects and relations with neighboring objects. However, the proposed method does not take into account hierarchical relations defined on spatial objects as well as non-spatial attributes. Malerba et al [13], investigates to exploit the expressive power of predicate logic to represent both spatial relations and background knowledge, such as spatial hierarchies. Nadia Ghamrawi and Andrew McCallum[14] said, single-label classification assigns an object to exactly one class, when there are two or more classes. Multi-label classification is the task of assigning an object simultaneously to one or multiple classes. Benhui Chen et al [15] said Multi-label classification problem is an extension of traditional multi-class classification problem in which the classes are not mutually exclusive and each sample may belong to several classes simultaneously. G. Tsoumakas et al [16] said existing methods for multi-label classication fall into two main categories; namely problem transformation and algorithm adaptation. Problem transformation maps the multilabel learning problem into one or more single label problems. The most widely-used problem transformation method considers the prediction of each label as an independent binary classification task. Brinker, K., et al [17] transform the multi label classification task into one or more single-label classification, regression or label ranking tasks. Algorithm adaptation extends specific learning algorithms in order to handle multi-label data directly, it modify standard single-label learning algorithm for multi-label classification. Methods adopted by both Min-Ling Zhang and Zhi-Hua Zhou [18] MultiLabel k-Nearest Neighbor (MLKNN), Weiwei Cheng and Eyke Hllermeier [19] Instance Based Learning by Logistic Regression (IBLR) were considered algorithm adaptation state-of-the-art multi label classification algorithms that exploit instance-based learning. We introduce the problem of Multi label classification
AC is a branch of a larger area of scientific study known as data mining. Fayyad et al.[20] defined data mining as one of the main phases in knowledge discovery from databases, which extracts useful patterns from data. AC integrates two known data mining tasks, association rule discovery and classification, to build a model (classifier) for the purpose of prediction. Classification and association rule discovery are similar tasks in data mining, with the exception that the main aim of classification is the prediction of class labels, while association rule discovery describes correlations between items in a transactional database. Thabtah F. et al [21] uses classification is a special case of association rule mining, in which the antecedent of the rule is the label attribute. W. Li, J. Han, and J. Pei [22] presented associative classification algorithm that selects and analyses the correlation between high confidence rules. Yin, X. and Han, J [23] prsented a greedy associative classification algorithm called Classification based on Predictive Association Rules (CPAR).
2.3 Need for the Evolutionary Algorithms Over the past decade, population-based evolutionary algorithms (EAs) have been found to be quite useful in solving multiobjective optimization problems, simply because of their ability to find multiple optimal solutions in a single simulation run. Multi-objective evolutionary algorithms (MOEAs) are a popular approach to confronting these types of problem. A lot many research contributions by Dehuri et al. exist in [24] and [25] as a problem solving tools of rule mining. The use of EAs as a tool of preference is due to such problems being typically complex, with both a large number of parameters to be adjusted, and several objectives to be optimized. EAs, which can maintain a population of solutions, are in addition able to explore several parts of the Pareto front simultaneously. The robustness and domain-independent capabilities of EAs attracts researchers to evolve a set of classification rules. Genetic algorithm (GA) based classifier systems usually fall into two basic categories, the Michigan approach and the Pittsburgh approach. The main difference between these two stems from the chromosome encoding schemes in the population of individuals. In the Michigan approach, each individual with fixed length encodes a single prediction rule. In this approach there are at least two possibilities for discovering a set of rules. The first one is let each run of the GA discover a single rule (the best chromosome produced in all generations) and simply run the GA multiple times to discover a set of rules. Disadvantage of this strategy is that it is computationally expensive, requiring many GA runs. The second possibility is to design a more elaborate GA where a set of individuals-possibly the whole population-corresponds to a set of rules. Whereas in the Pittsburgh approach, each individual is represented by a variable-length string and encodes a complete set of rules. A. L. Corcoran and S. Sen in [26] said, the Pittsburgh approach is better suited for static domains and batch-mode learning, in which all training samples are available before the learning process starts, and the Michigan approach is more flexible to handle incremental-mode learning, in which training samples
2
IJCA Special Issue on “Artificial Intelligence Techniques - Novel Approaches & Practical Applications” AIT, 2011 arrive over time and dynamically changing domains. ACO is a paradigm for designing meta heuristic algorithms for combinatorial optimization problems. The ACO algorithm was first introduced by Colorni, Dorigo and Maniezzo [27]-[28] and the first Ant System (AS) was developed by Dorigo [29] in his Ph.D. thesis. The ACO is a meta-heuristic algorithm, which utilizes the inspiration from real ant colonies behaviours to find a shortest path from a food source to the nest without using visual cues by exploiting pheromone information [30]-[32].
3.1.2 Fitness The fitness function is calculated as the arithmetic weighted average confidence, comprehensibility and J-Measure. The fitness function is given by f(x) = [ (w1 * Comprehensibility) + (w2 * J-Measure) + (w3 * Confidence) ] [ w1+w2+w3 ]
3. PROPOSED METHODOLOGY In this paper we propose a three stage multi label classifier based on the HEA, the MOGA and Association rule mining. The first stage generates the optimized spatial association rules by the use of the HEA. In the second stage the Multi label rules are generated by the MOGA. Final stage the Multi label classifier is built with a sorting mechanism applied to the rules generated.
3.1 Application of HEA for optimized Spatial Association rule mining SAR uses apriori algorithm for the generation of the rules. Here the rules generated by apriori using the hybrid evolutionary algorithm.The MOGA is used to achieve the multi objective by with a Pareto based multiple-objective genetic algorithm. The possible rules are represented as chromosomes and a suitable encoding/decoding scheme has been defined, it also provides the diversity of associations among the rules generated by elitism.We follow the Michigan approach for the optimization. To increase the efficiency of the MOGA, we are using the ACO, which limits the algorithm from falling to the local optimal solution. The procedures of HEA are as follows. First, MOGA searches the solution space and generates association lists to provide the initial population for ACO. Next, ACO is executed, when ACO terminates, the crossover and mutation operations of MOGA generate new population. ACO and GA search alternately and cooperatively in the solution space. Then the rules are clustered using the rule cover based on the consequent information.
3.1.1 String Representation Chromosomes are encoded as real numbers the number of genes in each chromosome is equal to the number of item sets considered. Each gene will have 4 digits for vector index. A sample chromosome may look like as follows: 0001 0102 0204 0302 0401 0500 0601 0702 0802 0901 1002 1101 1201 Here, the first two numbers in each gene represents the attribute and the next two denotes the value , fourth gene has the value 0302 where 03 refers to the age group and 02 refers to the third age group ranges from 23 to 25. Like wise all the gene has been encoded, once the initial population is generated now we are ready to apply genetic operators.
where w1,w2,w3 are used defined weights.
3.1.3 Reproduction (Selection) The selection process selects chromosomes from the mating pool directed by the survival of the fittest concept of natural genetic systems. In the proportional selection strategy adopted in this paper, a chromosome is assigned a number of copies, which is proportional to its fitness in the population, go into the mating pool for further genetic operations. Roulette wheel selection is used for the proportional selection strategy.
3.1.4 Crossover Crossover is a probabilistic process that exchanges information between two parent chromosomes for generating two child chromosomes. In this paper, single point crossover with a fixed crossover probability of C is used. For chromosomes of length l, a random integer, called the crossover point, is generated in the range [1, l-1]. The portions of the chromosomes lying to the right of the crossover point are exchanged to produce two offspring.
3.1.5. Mutation Each chromosome undergoes mutation with a fixed probability M. For binary representation of chromosomes, a bit position (or gene) is mutated by simply flipping its value. Since we are considering real numbers in this paper, a random position is chosen in the chromosome and replace by a random number between 0-9. Pseudo code for optimization of rule generation 1. while (t C. The antecedent part of the rule is a conjunction of conditions say A (conjunction of A1, A2…An). Predictive Accuracy is defined by Dehuri, S., Mall, R.[33] as PA = ( |A&C| - ½ )/ |A|
(1)
where |A| is the number of examples satisfying all the conditions in the antecedent A and |A&C| is the number of examples that satisfy both the antecedent A and the consequent C. Intuitively, this metric measures Predictive Accuracy in terms of how many cases both antecedent and consequent hold out of all cases where the antecedent holds. The term ½ is subtracted to penalize the rules covering few training examples. Xian-Jun Shi and Hong Lei [34] discussed the standard way of measuring comprehensibility [17] is to count the number of condition in the rule. If a rule has at most L condition, the comprehensibility of the rule (or individual) p can be defined as Cp = (L-n)/ (L-1).
(2)
where n is the length of the rule (or individual) p. The fitness function is computed as the arithmetic weighted mean of comprehensibility and predictive accuracy. The fitness function is given by Fitness = [ ( y1*PA+ y2*Cp) / (y1 + y2) ] where y1, y2 are the weights defined by the user. Repeated learning has been done using the different generations of the MOGA and until no more frequent item sets can be discovered. At this stage, any remaining unclassified instance form a default label. This process results in learning from several subsets of the original training data and generates few rules sets.
3.3 Multi label Classifier When the learning process is finished and no further frequent item sets are found, a merging of the rules sets produced from each training data is performed to obtain a multi-label classifier. When merging the rules sets, the multilabel rules are prioritized based on the sorting procedure. The sorting procedure uses the support, confidence and J measure of the rules. We also take into account the fact that the highest priority rules are those that have been derived from the original dataset during the first iteration, then those generated in the second iteration, and so on. The sorting has been done by the weighted average of the above three measures. The weights of the measures are defined by the user. The sorting measure (SM) is defined as SM = ((z1 * Support) + (z2 * J-Measure) + (z3 * Confidence)) [(z1 + z2 + z3)] where z1,z2 and z3 are used defined weights
4. COMPARISON METRICS Multi-label evaluation metrics fall into two main categories: prediction-based and ranking-based. Prediction-based metrics evaluate how well the algorithm predicts the actual set of correct labels for each instance. Ranking-based metrics evaluate how well the algorithm ranks the labels relative to one another. Tsoumakas et al [16] use the following standard multi-label prediction-based evaluation metrics. Hamming Loss is the percentage of correct labels not predicted and incorrect labels predicted. Accuracy is the percentage of true positives out of the total true positives, false positives, and false negatives. Precision is the percentage of predicted labels that were correct. Recall is the percentage of correct labels that were predicted.
5. RESULTS AND DISCUSSIONS We have used the synthesized dataset, which has been collected in and around the city Madurai. This data has been collected based on the geographic, demographic, psychographic and behavioralistic of the customer characteristics for our research. The target group are students, professionals, working women, home makers and the senior citizens. The general procedure of data mining is: Question raise Data preparation (including data selection, data pre treatment and data transformation) Data arrangement Model building/data mining Result evaluation and explanation. We have followed the procedure adopted by by Xinqi Zheng and Lu Zhao [35], where we take advantage of import wizard in Matlab to accomplish the import of data file.
4
IJCA Special Issue on “Artificial Intelligence Techniques - Novel Approaches & Practical Applications” AIT, 2011 The results in the Table 2 indicates that MOGA based AC outperforms the other two methods. The hamming loss in our proposed approach is reduced around 34.89% and 10.48% compared to decision tree based associative classifier and Neural network based associative classifier respectively.
Table 1 : Environmental parameters for GA Population size
100
Crossover rate (C )
0.8
Mutation rate (M)
0.1
Stopping criteria
100 generations
Percentage of correct labels not predicted and incorrect labels predicted has been reduced by the proposed approach. This is because of the associative classifier is optimized by the genetic algorithm with one of the objective as the predictive accuracy and the learning is followed by the sorting procedure.
2. We compute our results using ten-fold cross-validation for each method over each data set. It is defined as break data into 10 sets of size n/10, train on 9 datasets and test on 1.Repeat 10 times and compute mean.
The results in the Table 3 indicates that MOGA based AC outperforms the other two methods. The accuracy in the proposed approach is increased around 53.33% and 49.20% compared to decision tree based associative classifier and Neural network based associative classifier respectively.
Table 2: Comparison of the algorithms based on Hamming Loss
Iteration 1 Iteration 2 Iteration 3 Iteration 4 Iteration 5 Iteration 6 Iteration 7 Iteration 8 Iteration 9 Iteration 10 Mean
Decision tree 0.101 0.104 0.103 0.103 0.102 0.101 0.102 0.101 0.102 0.104 0.1023
Neural Network 0.075 0.075 0.076 0.072 0.073 0.074 0.075 0.074 0.075 0.075 0.0744
MOGA based AC 0.068 0.069 0.064 0.066 0.065 0.066 0.066 0.067 0.067 0.068 0.0666
Table 3: Comparison of the algorithms based on Accuracy
Iteration 1 Iteration 2 Iteration 3 Iteration 4 Iteration 5 Iteration 6 Iteration 7 Iteration 8 Iteration 9 Iteration 10 Mean
Decision tree 0.326 0.325 0.323 0.324 0.323 0.322 0.322 0.325 0.324 0.325 0.3239
Neural Network 0.355 0.355 0.354 0.352 0.352 0.353 0.353 0.353 0.354 0.352 0.3533
MOGA based AC 0.698 0.694 0.694 0.699 0.692 0.692 0.694 0.695 0.695 0.695 0.6948
5
IJCA Special Issue on “Artificial Intelligence Techniques - Novel Approaches & Practical Applications” AIT, 2011 Table 4: Comparison of the algorithms based on Precision
Iteration 1 Iteration 2 Iteration 3 Iteration 4 Iteration 5 Iteration 6 Iteration 7 Iteration 8 Iteration 9 Iteration 10 Mean
Decision tree 0.501 0.499 0.503 0.504 0.499 0.498 0.504 0.503 0.502 0.502 0.5015
Neural Network 0.817 0.814 0.815 0.816 0.816 0.815 0.816 0.817 0.816 0.815 0.8157
MOGA based AC 0.889 0.885 0.885 0.886 0.888 0.885 0.886 0.885 0.887 0.887 0.8863
Table 5: Comparison of the algorithms based on recall Neural Network -0.199 -0.201 -0.199 -0.204 -0.201 -0.202 -0.202 -0.203 -0.201 -0.201 -0.2013
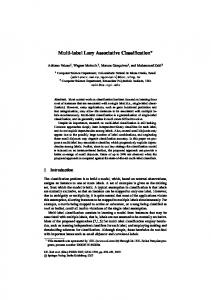
Comparision of the algorithms based on the run time Run Time ( min)
20 15 Decision tree based AC
10 5
Neural network based AC 7
9
MOGA based AC
Ite
ra t io n
5 Ite
ra t io n
3
ra t io n Ite
ra t io n
1
0
Ite
The results in the Table 4 indicates that MOGA based AC outperforms the other two methods. The precision in the proposed approach is increased around 43.41% and 7.96% compared to decision tree based associative classifier and neural network based associative classifier respectively. The results in the table 5 indicates that MOGA based AC outperforms the other two methods. The recall in the proposed approach is increased around 27.57% and 129.38% compared to decision tree based associative classifier and neural network based associative classifier respectively. Percentage of correct labels that were predicted has been increased by the proposed approach. This is because of the associative classifier is optimized by the genetic algorithm with the objectives as the predictive accuracy and comprehensibility. The first phase of the association rule generation is also optimized so that the prediction percentage of the correct labels is increased.
MOGA based AC 0.684 0.685 0.683 0.683 0.683 0.686 0.686 0.683 0.689 0.689 0.6851
ra t io n
Decision tree 0.495 0.498 0.494 0.495 0.495 0.497 0.498 0.496 0.496 0.498 0.4962
Ite
Iteration 1 Iteration 2 Iteration 3 Iteration 4 Iteration 5 Iteration 6 Iteration 7 Iteration 8 Iteration 9 Iteration 10 Mean
Iterations
Fig 1: Comparison of the proposed approach with other benchmark algorithms based on the run time
6
IJCA Special Issue on “Artificial Intelligence Techniques - Novel Approaches & Practical Applications” AIT, 2011 Table 6: Comparison of the algorithms based on mean run time Decision tree 9.02
Time (min)
Neural Network 15
MOGA based AC 8.4
The result for the mean run time of the classifiers is given in Table 6. In comparing the times for the execution of the classifiers MOGA based AC outperforms the other two methods. This is due to the fact that the reduction in the number of rules in the first step.
1 0.8 0.6 0.4 0.2 0 -0.2 -0.4
Decision tree Neural Network
lo ss Ac cu ra cy Pr ec isi on Re ca ll
MOGA based AC
The merging of the rule set produced from each training set is followed by a sorting procedure. The prioritization of the rules is based on the support, confidence and J-Measure.
The collective combination of the HEA and MOGA in the various process of Multi label prediction is very effective. The effectiveness is demonstrated using the tables and graphs generated from the results obtained.
6 APPLICATIONS The region for the study is Annanagar, Madurai which is the city taken for the case study. Moses santhakumar said [36] it is the second largest city in Tamilnadu state, having a very old history of about two thousand six hundred years and is often referred to as the Athens of East. Having different locations for residential, commercial, industrial, educational, public and semipublic habitats, we have chosen Annanagar as the place of study and collected data from various parts of it. Aditi pai and Deepika Khatri [37] said women are now a critical consumer segment for marketers to tap, not only for household and conventional women’s products but also for services. Yet all women do not behave the same, their habits differ according to their status such as marital and working status. In our paper we have taken preferences of women in the area Annanagar in Madurai.
Ha m m
in g
Difference in metrics
Comparison of the algorithms
(3)
Comparison metrics
Fig 2: Comparison of the proposed approach with other benchmark algorithms based on the four measures The consolidated report has been depicted in the Fig 2, it shows that the proposed approach shows remarkable improvement over the other two benchmark algorithms for multi label classification based on the four metrics considered. The improved performance exhibited by the proposed approach is due to the fact that, we have used (1) Hybrid Evolutionary Algorithm for the optimization in the production of the association rules. This strategy helps us to minimize the number of rule generated. a) We have used the multi objective genetic algorithm with the objectives confidence, comprehensibility and J-Measure b) We have used ACO for the algorithm falling to avoid the local optimal solution This approach helps us to produce the high quality and interested rules based on the basis given weigh by the user preference. (2)
Fig 3: Preference based on women student
In the generation of the Multi label rules, we have introduced MOGA to do the repeated learning. It used the objectives predictive accuracy and high comprehensibility. Fig 4: Preference based on just married women
7
IJCA Special Issue on “Artificial Intelligence Techniques - Novel Approaches & Practical Applications” AIT, 2011
Fig 5: Preference based on women with young child
Fig 8: Preference based on Multi label classification by all the categories of women Fig 3 through 7 gives the preferences of the women of five different categories and the Fig 8 gives the consolidated information based on the multi label classification of all the categories of women. This information gives the preference based optimal usage of the facilities such as Hospital, Provisions, educational institutions, Bus stop, Hotel and shopping malls, so that it can be maximally used by the user.
7. CONCLUSION
Fig 6: Preference based on working women
This paper proposed a methodology for the Multi label spatial classification optimized by the MOGA and the SAR using the Hybrid Evolutionary Algorithm. The results for the proposed method is promising and also lay a opening for the identification of Multi label which can be further extended to the real world multi label classification, which consider all available classes that pass certain user threshold for each item set. The work can be extended to the incremental learning of the training.
8 REFERENCES [1] Richard Frank , Martin Ester , Arno Knobbe, A multirelational approach to spatial classification, Proceedings of the 15th ACM SIGKDD international conference on Knowledge discovery and data mining, June 28-July 01, 2009, Paris, France [2] Koperski, K.: Progressive Refinement Approach to Spatial Data Mining,Ph.D. thesis,Computing Science, Simon Fraser University, (1999).
Fig 7: Preference based on home maker
[3] Subhija Ponjavic, Elvir Ferhatbegović , Multi-Criteria Land Use Classification in GIS for Buildings Construction, 15th International Conference on Urban Planning and Regional Development in the Information Society, 18 - 20 MAY 2010, Reed Messe Wien, Vienna,Austria (pp.445-454) [4] Li, W., Han, J., and Pei, J. CMAR: Accurate and efficient classification based on multiple class association rule mining. Proceedings of the ICDM’01 (pp. 369-376). San Jose, CA, 2001.
8
IJCA Special Issue on “Artificial Intelligence Techniques - Novel Approaches & Practical Applications” AIT, 2011 [5] Liu,B., Hsu, W., and Ma, Y. Integrating classification and association rule mining. Proceedings of the KDD (pp 80-86), Newyork, 1998. [6] Fadi A. Thabtah, Peter Cowling, Yonghong Peng, "MMAC: A New Multi-Class, Multi-Label Associative Classification Approach," ICDM, pp.217-224, Fourth IEEE International Conference on Data Mining (ICDM'04), 2004 [7] Yin, X. and Han, J.: CPAR: Classification Based on Predictive Association Rules. Proc SIAM Int Conf on Data Mining (SDM'03), 2003, 331-335 [8] Fadi Thabtah, Challenges and Interesting Research Directions in Associative Classification, Proceedings of the Sixth IEEE International Conference on Data Mining Workshops, p.785-792, December 18-22, 2006. [9] Satchidananda Dehuri, Sung-Bae Cho, "Multi-objective Classification Rule Mining Using Gene Expression Programming," iccit, vol. 2, pp.754-760, 2008 Third International Conference on Convergence and Hybrid Information Technology, 2008. [10] Diansheng Guo, Jeremy Mennis, “Spatial data mining and geographic knowledge discovery – An introduction” , Computers, Environment and Urban Systems 33 (2009) 403– 408. [11] Ester, M., Kriegel, H. P., & Sander, J, “Spatial data mining: A database approach”, Advances in spatial databases (pp. 47– 66). Berlin: Springer-Verlag Berlin. 1997. [12] Koperski, K., Han, J., and Stefanovic, N., “ An efficient two-step method for classification of spatial data” , 1998 international symposium on spatial data handling SDH’98 (pp. 45–54), Vancouver, BC, Canada. 1998. [13] Malerba, D., Esposito, F., Lanza, A., Lisi, F.A., Appice, A.: Empowering a GIS with Inductive Learning Capabilities: The Case of INGENS. Journal of Computers, Environment and Urban Systems, Elsevier Science, 27 . 265-281. 2003. [14] Nadia Ghamrawi , Andrew McCallum, “Collective multilabel classification”, Proceedings of the 14th ACM international conference on Information and knowledge management, October 31-November 05, 2005, Bremen, Germany [15] Benhui Chen, Liangpeng Ma and Jinglu Hu, “An improved multi-label classification method based on svm with delicate decision boundary “ , International Journal of Innovative Computing, Information and Control , Volume 6, Number 4, pp. 1605–1614, April 2010. [16] Tsoumakas, G., Katakis, I., Vlahavas, I.: “Mining Multilabel Data.”,Maimon, O., Rokach, L. (eds.) Data Mining and
Knowledge Discovery Handbook, 2nd edn. Springer, Heidelberg ,2009. [17] Brinker, K., Furnkranz, J., Hullermeier, E.: A unified model for multilabel classification and ranking. In: Proceedings of the 17th European Conference on Arti¯cialIntelligence (ECAI '06), Riva del Garda, Italy , pp 489-493, 2006 [18] Min-Ling Zhang and Zhi-Hua Zhou, “Ml-knn: A lazy learning approach to multi-label learning,” Pattern Recogn., vol. 40, no. 7, pp. 2038–2048, 2007. [19] Weiwei Cheng and Eyke Hllermeier, “Combining instancebased learning and logistic regression for multilabel classification,” Machine Learning, vol. 76, no. 2-3, pp. 211–225, September 2009. [20] Fayyad, U., Piatetsky-Shapiro, G., Smith, G. & Uthurusamy, R. 1998 Advances in Knowledge Discovery and Data Mining. Menlo Park, CA: AAAI Press. [21] Thabtah F., Cowling P., and Peng Y. (2004): Multi-label Classification Learning, Proceedings of the IEEE 2004 International Conference on Advances in Intelligent Systems (AISTA ’04). Luxembourg, Luxembourg, pp. 207-213, Nov. 2004. [22] W. Li, J. Han, and J. Pei. CMAR: Accurate and efficient classification based on multiple-class association rule. In Proceeding of the First IEEE International Conference on Data Mining (ICDM’01), pp. 369- 376, San Jose, CA, Nov. 2001. [23] Yin, X. and Han, J.: CPAR: Classification Based on Predictive Association Rules. Proc SIAM Int Conf on Data Mining (SDM'03), 331-335, 2003. [24] S. Dehuri et al, “Application of Elitist Multi-objective Genetic Algorithms for Classification Rule Generations,” Applied Soft Computing, vol. 8, no. 1, pp.477-487, 2008. [25] S. Dehuri, S. Ghosh, and A. Ghosh, “Genetic Algorithms for Optimization of Multiple Objectives in Knowledge Discovery from large Databases,” A. Ghosh (Eds.), Multiobjective Evolutionary Algorithms for Knowledge Discovery from Databases, pp. 1-22, 2008. [26] A. L. Corcoran and S. Sen, “Using Real-valued Genetic Algorithms to Evolve Rule Sets for Classification,” Proc. 1st IEEE Conf. Evolutionary Computation, pp. 120–124, June 1994. [27] A . Colorni, M. Dorigo, and V. Maniezzo. Positive feedback as a search strategy. Technical Report No. 91-016, Politecnico di Milano, Italy,1991. [28] A. Colorni, M. Dorigo, and V. Maniezzo . The ant system: an autocatatlytic process. Technical Report No. 91- 016, Politecnico di Milano, Italy, 1991.
9
IJCA Special Issue on “Artificial Intelligence Techniques - Novel Approaches & Practical Applications” AIT, 2011
[29] M. Dorigo. Optimization, Learning and Natural Algorithms. Ph.D. Thesis, Politecnico di Milano, Italy,1992 [30] R. Beckers, J.L. Deneubourg and S. Goss. Trails and Uturns in the selection of the shortest path by the ant lasius niger. Journal of Theoretical Biology, 159, 1992, pp. 397- 415.
[34] Xian-Jun Shi, Hong Lei , “ A Genetic Algorithm-Based Approach for Classification Rule Discovery”. International Conference on Information Management, Innovation Management and Industrial Engineering, 2008, Volume: 1, page(s): 175-178, 2008.
[31] S. Goss, S. Aron, J.L. Deneubourg and J.M. Pasteels (). Self-organized shortcuts in the argentine ant. Naturwissenschaften, 76, 1989, pp. 579-581.
[35] Xinqi Zheng, Lu Zhao, “Association Rule Analysis of Spatial Data Mining Based on Matlab”, Workshop on Knowledge Discovery and Data Mining , 2008 IEEE DOI 10.1109/WKDD.2008.21
[32] B. Holldobler and E.O. Wilson (1990). The Ants. SpringerVerlag: Berlin.
[36] Moses santhakumar et al, “Transportation system management for Madurai city using GIS”, Map India 2003.
[33] Dehuri, S., Mall, R. "Predictive and Comprehensible Rule Discovery Using A Multi-Objective Genetic Algorithm", Knowledge Based System, volume 19, pp: 413-421, 2006 (SCI).
[37] Aditi Pai and Deepika Khatri, “She buys to conquer”,India Today, April 25, 2008.
10