to the actions of the aircraft maintenance technicianâ. Rankin (1997) .... training for the job, encouragement to undertake further training .... In G. Salvendy, (Ed.),.
Tenth International Symposium on Aviation Psychology May 3rd - 6th, Colombus Ohio
DEVELOPING A MODEL TO PREDICT AIRCRAFT MAINTENANCE PERFORMANCE
Professor Gerard J Fogarty and Mr Robert Saunders University of Southern Queensland, Toowoomba, Queensland 4350, Australia And Lt Col Robert Collyer Army Aviation Centre, Oakey, Qld 4401, Australia
ABSTRACT A three-pronged approach was adopted to the investigation of causes of maintenance errors in army aviation. In the first phase of the research, analysis of maintenance incident reports suggested that individuals were mostly at fault, making errors because they failed to follow procedures and were inadequately supervised. Interviews with maintenance technicians, on the other hand, put the spotlight on organisational variables, such as pressures created by poor planning. In the third phase, a survey instrument administered to 448 maintenance workers was used to develop a structural model that predicted 34% of the variance in psychological health, 16% of the variance in turnover intentions, and 16% of the variance in self-reported maintenance errors. Implications of these findings are discussed. INTRODUCTION An examination of the human factors literature by Hollnagel (1993) pinpoints the fact that human error is increasingly implicated in accidents relating to complex technological systems. In the aviation industry, whenever the probable causes of aircraft accident are listed, maintenance-associated deficiencies invariably hold a prominent place. Graeber and Marx (1994, p.88) define maintenance error as “… an unexpected aircraft discrepancy (physical degradation or failure) attributed to the actions of the aircraft maintenance technician”. Rankin (1997), in examining the experience of the Boeing organisation, reports that improper maintenance contributes to 15 per cent of commercial jet accidents. Based on Boeing’s experience, Marx (1998) calculated that in the USA alone the number of commercial aircraft
dispatched each year with a maintenance error is roughly 48,800. Hollnagel puts forward a number of reasons for this emphasis on human fallibility of which at least three have implications for the aviation industry. In the first place the reliability of mechanical and electronic components has increased markedly in the past 30 years while the level of human reliability has remained virtually unaltered over the same period. Secondly, the increase in system complexity and automation has placed greater demands on those responsible for their maintenance. Finally, the growth in system complexity provides the environment envisaged by Reason (1990) in which latent failures resulting from increasingly intricate procedures blend with operator errors and violations to place the organisation at risk. It follows that failures in technological systems cannot be attributed solely to technical aspects; they also embrace behavioural factors deriving from individuals and organisations operating and maintaining those systems. The present study was designed to explore the role of individual and organizational variables in maintenance performance in the aviation industry. Specifically, the objectives of the study were to: a) examine a number of organisational, job and individual factors that were considered likely to impact on maintenance performance; b) explore the relations among these variables; and c) develop a model for predicting important work outcome variables such as turnover intentions, psychological health, and selfreported maintenance errors. Three data collection methods were used in the study: • analysis of recent maintenance incidence reports;
• •
interviews with personnel at all levels of the maintenance operation; completion of the Maintenance Environment Survey Scale (MESS), an instrument developed for the purpose of this study.
The findings from each of these three methods will be presented separately. PHASE 1: CLASSIFICATION OF ERRORS As varied error types each require their own preventative strategies it has become common practice to categorise errors so that the reasons which lead to their occurrence might be identified. Examples are to be found in the work of Miller and Swain (1987) who classify errors under omission, commission, substitution or mis-timed actions, and in Reason (1990) where errors take the form either of slips, lapses or mistakes. Rasmussen (1983) provides a more complex description, classifying errors according to the level of cognitive control being exercised by the operator when the error occurred. The ICAO (1992) has formally recommended the SHEL model as a most useful tool in analysing human factors. Advocated by Edwards (1988), the acronym represents Software (procedures, documentation), Hardware (tools, equipment), Environment and Liveware (people) and divides a person’s interactions into each of these four broad areas. Two types of record relating to maintenance incidents in Army Aviation were available: •
•
Maintenance Incident Reports (MIRs). MIRs are required when an aircraft incident occurs during a period of operation, and arises from deficiencies in maintenance policy, procedures, practices, and/or equipment. MIRs are also required when an aircraft is damaged as a result of an event occurring outside the period of operation, or a piece of equipment used in maintenance operations is damaged, or personnel are injured, or a serious error occurs in a particular maintenance procedure or activity. Maintenance Occurrence Reports and Evaluations (MOREs). These are similar to MIRs but cover problems detected before the aircraft is returned for operational duties. MOREs are often triggered by post maintenance test flights. Thus, the main distinction between MIRs and MOREs is the point at which the error is detected.
Both types of record were stored at a central location to which researchers had access. Both MIRs and MOREs require the investigating team to classify the cause of error using a system based on the SHEL model. Analysis of these reports thus promised to shed light on management's view on the major causes of maintenance errors. Table 1 summarises the causes of 250 incidents reported between Jan 1996 and Aug 1998. Table 1. SHEL Classification of Maintenance Errors from Jan 1996 to Aug 1998 Official Cause of Error Frequency 1. Inadequate supervision 101 2. Incorrect procedures followed 80 3. Inadequate experience/ training 38 4. Manuals not used correctly or 15 manuals omit steps. 5. Non-compliance with rules and 7 policies 6. Material deficiencies (e.g., 6 incorrect marking of parts) 7. Stress or fatigue 2 8. Communication failure 1 Σ = 250 It can be seen from these tables that the most common form of error involved the maintenance people actually making an error and the error not being detected by the supervisor. The emphasis is very much on failures of the individual. Note that stress and fatigue - commonly thought to be the cause of many errors - were rarely reported as causes. PHASE 2: WORK CONDITIONS The second phase of the investigation involved structured interviews with 166 maintenance personnel organized into 18 focus groups. Groups typically met for up to an hour with two of the investigators for an open-ended discussion of factors affecting performance. The aim of this phase was to identify common themes relating to problems experienced in maintenance work and to weigh these against the official views summarised in the MIRs and MOREs. The findings are summarised below.
Table 2 Common Themes Emerging in Focus Groups Theme
Frequency Reported (max = 18) 14 13 13 11 10 10 10
Availability of parts Workload flow Physical conditions * Training deficiencies Scheduling problems Non-maintenance duties ~ Poor planning Notes: * Whilst on deployment ~ For example, military duties
To conserve space, issues that were raised in fewer than 10 of the 18 groups do not appear in Table 2. These data, stripped of their richness in this summary table, painted a somewhat different picture of the organization in which the MIRs and MOREs were generated. Here the emphasis was mainly on factors that can make maintenance work difficult and it can be seen that most of the issues relate to organisational planning. Personal issues such as fatigue and stress were not often mentioned. PHASE 3: DEVELOPING A MODEL As mentioned earlier, this study also investigated the extent to which a number of organisational, job and individual variables influence maintenance errors and other intermediate outcome variables, such as health and turnover. The variables comprising the “Dirty Dozen” (e.g., Taylor, 1997) were used as a starting point for an examination of the organisational and job elements that might impact on performance. Input variables for other outcomes indirectly related to performance have already been identified in the literature – for example safety (e.g., Shappell and Wiegmann, 1997) and job satisfaction (e.g., Bogg and Cooper, 1995). In addition, a decision was made to include a number of relevant individual aspects, especially the extent to which individual dispositions arising from personality characteristics influence performance. Maintenance Environment Survey Scale (MESS) A questionnaire was developed to measure a range of variables considered to be related to maintenance
performance. The variables comprising the questionnaire, which we called the Maintenance Environment Survey Scale (MESS), are described below. • Rewards, Recognition. This variable assesses the extent to which people feel that they are rewarded and recognised for doing good work. Example: Q33. In this job, people are rewarded according to performance. • Physical Conditions. Measures the quality of the actual physical surrounds of the workplace. Example: Q40. The physical conditions make working here unpleasant. • Attitude To Safety. Assesses the perception that the organisation has a strong concern for safety issues. Example: Q45. This unit regards safety as a major factor in achieving its goals. • Efficiency. There are many aspects to efficiency; here we looked at the tendency of the work units to emphasise improvement in work practices. Example: Q50. In my unit, management actively supports our efforts to improve. • Training. The items in this scale covered a number of different aspects of training, including adequacy of training for the job, encouragement to undertake further training, and opportunities for on-the-job training. Example: Q94. My training and experience has prepared me well for the duties of my current job. • Documentation/Procedures. Poor documentation is often cited as a reason for maintenance errors. Example: Q110. Maintenance procedures are accurately described in our technical manuals. • Family Pressures. Maintenance personnel in the armed forces are often required to be absent from home. It was expected that the absences would result in personal strain, which may in turn affect work performance. Example: Q115. The demands of my work interfere with my home and family life. • Stress. There is no doubting the effect that stress can have on work performance. The questions comprising this scale tended to tap actual feelings and consequences of stress, rather than background factors that might be causing the stress. Example: Q132. Workload pressures have at times affected the quality of my work.
• Fatigue/Sleep. Given the difficulty of adequately assessing fatigue in a self-report measure, the questions in this scale focussed on the quality of sleep. Example: Q140. My overall sleep quality is extremely poor. • Positive and Negative Affectivity. Much has been written about the work impact of background personality dispositions, such as the tendency to see things in a negative light (e.g., Fogarty et al, 1999). Items from Watson, Clark, and Tellegen's (1988) Positive and Negative Affectivity Schedule (PANAS) were used to measure both positive and negative affectivity. • General Health. The General Health Questionnaire (GHQ: Goldberg and Williams, 1988), an instrument already widely used in the armed services, was included as part of the survey of maintenance personnel. The GHQ explores four aspects of psychological health: somatic symptoms (e.g., Have you been getting any pains in your head?); anxiety and insomnia (e.g., Have you found everything getting on top of you?); social dysfunction (e.g., Have you felt that you are playing a useful part of things?); and severe depression (e.g., Have you felt that life isn't worth living?). An abbreviated, 12-item version of the GHQ was used here. • Job Satisfaction. The questions in MESS targetted the actual feeling of satisfaction, rather than why they might or might not feel this way. Example: Q13. I like maintenance work. • Responsibility. When employees enjoy a sense of responsibility for their work, it is reasonable to expect that they will exercise more care and diligence. Example: Q29. I feel I have little input into the decisionmaking at work. (Reverse-scored item). • Supervision. The quality of work supervision was brought forward as a problem in a number of our interviews with management in the early stages of this project. Example: Q69. My immediate supervisor really understands the maintenance task. • Support from Coworkers. It is difficult to operate effectively in a work environment unless there is a feeling of support from one's colleagues. In the present instance, questions focussed on expectations that - if needed - workers would receive assistance from coworkers. Example: Q83. Most of my workmates can be relied upon to do what they say they will do.
• Feedback. Many maintenance personnel are in the early stages of their careers and still learning the trade. Their effectiveness is likely to be shaped by the amount and quality of feedback they receive. Example: Q85. The quality of our work is rated or evaluated frequently. • Organisational Commitment. Again, interviews with management highlighted concerns with the level of organisational commitment in today's maintenance workforce. Such concerns were fuelled by the outsourcing of maintenance tasks, the mixing of civilians and service personnel in the same workplace, and a possible shift in values among service personnel. Example: Q106. I am proud to tell others that I am part of this unit. • Turnover Intentions. Q11 asked about the job intentions of staff, whether they intended to keep working in the maintenance industry, leave the industry, or whether they were uncertain. High turnover leads to manpower shortages and greater pressure on existing staff to keep up with the workload. • Errors. MESS included four questions that asked the respondents to indicate whether they made maintenance errors on the job (Q131 to Q134). These included errors that they detected themselves and those picked up by their supervisors. All items employed a five-point (1-5) Likert scale format where 1 indicated strong agreement and 5 strong disagreement. The Maintenance Environment Survey Scale (MESS) was delivered to all maintenance personnel, including officers in charge of maintenance units. Results of Survey Some salient features of the overall sample are worth mentioning: • 448 individuals responded to the survey, 95% of whom were male; • 84% of respondents were Army personnel, 15% civilian contractors, and 1% airforce or navy; • 11% were trainees, 41% tradespersons, 22% supervisors, 11% independent inspectors, 15% other; • average time in maintenance was approximately 10 years; • 61% of respondents indicated that they intended to continue working in maintenance, a further 23% were uncertain;
• 79% of respondents admitted to making errors that they picked up themselves, 50% to making errors that were detected by supervisors.
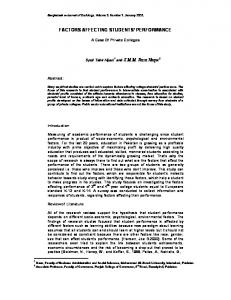
to test models of the relations among the MESS variables. A two-step approach was followed wherein a second order measurement model was derived from the composite variables followed by testing of a structural model linking the input and output variables. Without going into details of various competing models that were tested, the model shown in Figure 1 reflects the rationale for selection of variables for this study and provides a good fit to the observed data (χ2, 74 = 152.07 .14, p < .01; AGFI = .93; TLI = .93; RMSEA = .04).
To establish whether the questionnaire succeeded in measuring the aspects it set out to measure, the items were subjected to factor analysis. As a result of these analyses, some items were discarded. The remaining items were used to form scales that in general conformed to those intended to be captured by MESS. All scales had satisfactory reliability estimates (α > .70). Structural equation modelling (SEM), using Arbuckle's (1997) AMOS program, was then employed
Figure 1 Structural Model Showing Relations Among Input and Output Variables .36
e1
Rewards .25
e2
Safety
.60 .32
.50
e4
.57
.31
e5
.34 .56
Coworker
-.58
Workplace
Feedback
e7
Training
e8
Document
.57
.76
e11
GHQ
.58
.34
e12
Stress
.66
.43
e9
Sleep
-.54
Health
.39 .62
e6
.29
z1
Supervis
.38
.14
.44
.73
.51
e13
Jobsatis
.16 .72
.54
Errors
.18 .58 .76
e15
z3
Morale
Orgcomit
-.40 .16
z2
The salient points of the model are as follows: • Rewards, Safety, Supervision, Coworker Support, Feedback, Training, and Documentation are indicators of an underlying construct labelled Workplace. • Sleep Quality, Stress, and General Psychological Health are indicators of an underlying construct called Health. • Job Satisfaction and Organizational Commitment are indicators of a construct called Morale.
Jobinten
z4
• Errors and Job Intentions are entered as separate outcome variables. • Workplace predicts 54% of Morale and 34% of the variance in Health. Both of these are important work outcomes. • Workplace variables do not have a direct effect on Errors or Job Intentions but they do have an indirect effect through Morale and Health.
• Morale and Health, between them, predict 16% of self-reported errors and 16% of turnover intentions. • A number of variables did not appear in the final model for reasons which cannot be discussed here. CONCLUSIONS MESS provided two sorts of data: descriptive data (not reported here) and data pertaining to relations among variables thought to be important in maintenance. Both sorts of data have proved valuable in our quest to uncover sources of maintenance errors. The descriptive data, collected from 448 respondents, paints a picture of overall satisfaction with many aspects of the workplace. There was surprising support for the level of training and the quality of supervision, two areas that were often criticised during the interviews. Thus, the survey proved a useful counterbalance to some impressions acquired through the interviews. At the survey level, the present version of MESS captured some of the major factors relating to to work performance. The model shown in Figure 1 helps to explain what are apparently conflicting findings from the incident reports and the interview data. As mentioned earlier, the incident reports tend to put the spotlight on human error as the cause of incidents. This is not a surprising outcome, Shappell and Wiegmann (1997) noted that such reporting systems generally focus on identifying "human failures without regard for why the failures occurred" (p.270). Figure 1 shows that it is indeed the individual factors that affect errors and turnover intentions. The direct links between Workplace and these two output variables were not significant and therefore not shown in the diagram. However, Figure 1 also shows that the individual factors are strongly driven by workplace concerns. Thus, the casual path is as follows: organisational factors Æ individual factors Æ errors. The SEM approach has helped to demonstrate the nature of this link. REFERENCES Arbuckle, J.L. (1997). Amos users’ guide: Version 3.6. Chicago, IL: Smallwaters Corporation. Boeing, (1994). Maintenance error decision aid. Seattle: Boeing Commercial Airplane Group. Bogg, J. & Cooper, C. (1995). Job satisfaction, mental health and occupational stress among senior civil servants. Human Relations, 48 (3), 327-341. Edwards, E. (1988). Introductory overview. In E.L. Weiner & D.C. Nagel (Eds.), Human Factors in Aviation San Diego, CA: Academic Press. Fogarty, G.J., Albion, M.J., Sutherland, L.F., Lalor, G.I., Revitt, S. & Machin, M.T. (1999). Predicting
occupational strain and job satisfaction. Journal of Vocational Behavior. (In press). Goldberg, D., & Williams, P. (1988). A User's guide to the General Health Questionnaire. Windsor, Berkshire: NFER-Nelson. Graeber, R.C., & Marx, D.A. (1994). Human error in aircraft maintenance. In N. Johnston, N. McDonald, & R. Fuller, (Eds.), Aviation Psychology in Practice. Aldershot, U.K.: Avebury Technical. Hollnagel, E. (1993). Human Reliability Analysis – Context and Control. San Diego, CA: Academic Press. International Civil Aviation Organisation. (1992). Ergonomics. ICAO Circular 238 -AN/143, Montreal: ICAO. Marx, D.A. (1998). Learning from our mistakes: Review of maintenance error investigation and analysis systems. Report prepared for FAA. Galaxy Scientific Corporation. Miller, D.P., & Swain, A.D. (1987). “Human error and human reliability”. In G. Salvendy, (Ed.), Handbook of Human Factors. New York: John Wiley. Rankin, W.L. (1997). Maintenance error decision aid: Progress report. Proceedings of eleventh meeting on human factors issues in aviation maintenance and inspection: FAA. Rasmussen, J. (1983). Skills, rules, knowledge: signals, signs and symbols and other distinctions in human performance models. IEEE Transactions: Systems, Man & Cybernetics, SMC–13, 257-267. Reason, J.T. (1990). A framework for classifying errors. In J. Rasmussen, K. Duncan & J. Leplat (Eds.), New Technology and Human Error. London: John Wiley. Shappell, S.A., & Wiegmann, D.A. (1997). A human error approach to accident investigation: the taxonomy of unsafe operations. International Journal of Aviation Psychology, 7 (4), 269-291. Taylor, J.C. (1997). Evaluating the effects of maintenance resource management (MRM) interventions in airline safety. Report to FAA Office of Aviation Medicine, Washington, D.C. Watson, D., Clark, L.A., & Tellegen, A. (1988). Development and validation of brief measures of positive and negative affect: The PANAS scales. Journal of Personality and Social Psychology, 54, 1062-1070.