ENHANCING MODEL INTERCHANGEABILITY FOR POWERFLOW STUDIES: AN EXAMPLE OF A NEW HUNGARIAN NETWORK MODEL IN POWERFACTORY AND eASiMOV Bálint Hartmann Centre for Energy Research Hungarian Academy of Sciences Konkoly-Thege Miklós út 29-33., Budapest, 1121, Hungary E-mail:
[email protected]
KEYWORDS Hungarian transmission grid, power system simulation, computer modeling, PowerFactory, eASiMOV ABSTRACT The article presents a comparison of basic powerflow studies, performed with a market available and a new self-developed power grid analysis software suite. The example of the Hungarian power system is used to show a blueprint process for creating computer models of large-scale electric systems, using dominantly openly available data sources. The first part of the article introduces the Hungarian power systems, and details how topological, consumption and generation data are collected. The second part presents the implementation of these raw data in DIgSILENT PowerFactory and eASiMOV, highlighting the interoperability of the softwares and the additional value of model data conversion. INTRODUCTION The fact that all power grid simulation software use their own proprieraty model specification hinders the easy model exchange between various simulation platforms. For model benchmarking purposes the time-consuming remodelling process is a serious problem, especially for large and complex grid models. As a standard for basic model data exchange IEEE CDF (WGoCF 1973), PTI Power Flow Data Format (Portante et al. 1997) and PECO PSAP Format (Christie 1993) are used because of their simplicity and clarity. They are capable of describing grid topology based on nodes and branches with basic network component types. With the Common Information Model (CIM) an ontology for power grid specification has been presented (Uslar 2012). Due to its complexity and being still a work in progress, it is not finally established and also not fully supported by commercial software. Within the project "Energy System 2050", which is a joint initiative of the research field Energy of the Helmholtz Association (ES2050 2016), the model
Hüseyin K. Çakmak Uwe G. Kühnapfel Veit Hagenmeyer Institute for Applied Computer Science Karlsruhe Institute of Technology Hermann-von-Helmholtz-Platz 1 Eggenstein-Leopoldshafen, 76344, Germany E-mail:
[email protected],
[email protected],
[email protected]
exchange is essential for the close cooperation of research groups. It will boost the development of new methods for forecasting of loads and power generation with renewable energy sources, uncertainty analysis for power grids, new control algorithms, etc. by providing verified simulation models and validated basic power flow results. The ES2050 project focuses in detail on the integration of relevant technology elements into the energy system and on the development of solutions for the successful use of the partly strongly fluctuating renewable energy sources in the German and European energy supply systems. Work is aimed at obtaining tangible and exploitable findings and technologies by 2019, which may be used by politics and industry afterwards. The Institute for Applied Computer Science (IAI) at Karlsruhe Institute of Technology (KIT) is the leading partner of Topic 5 “Toolbox with Databases”. In this topic, standardized data formats are to be defined and various data sources are to be combined. It is aimed at developing standardized models for components of the energy system and at conceiving reliable algorithms for planning, operation, and optimization of the energy system. IAI manages the following four work packages: Data formats and data quality in database applications; Simulation platforms, IT systems architecture, security; Prognosis and automated operation planning; Instrumentation and control. Early phase of this work has seen collaboration between IAI and the Centre for Energy Research, Hungarian Academy of Sciences (MTA EK), where similar research is being performed in the field of electricity networks. The joint work of the colleagues of the two institutions aimed to create a new common model for the Hungarian power system that can be implemented in various simulation software and that is based dominantly on openly available datasets. Grid modelling is traditionally part of the activities of distribution and transmission system operator
Proceedings 31st European Conference on Modelling and Simulation ©ECMS Zita Zoltay Paprika, Péter Horák, Kata Váradi, Péter Tamás Zwierczyk, Ágnes Vidovics-Dancs, János Péter Rádics (Editors) ISBN: 978-0-9932440-4-9/ ISBN: 978-0-9932440-5-6 (CD)
companies, local and regional utilities and planning enterprises. Thus, the majority of network models are not available for public or research use, due to wellunderstood interests. The authors of the present contribution aim at negotiating this obstacle by creating a blueprint for modelling regional and national power systems, utilising openly available data to a maximum possible extent. Previous research experience has shown that by identifying the proper data sources (national statistics, the REMIT database, satellite image processing, etc.), such goals can be achieved, especially for high-voltage transmission networks (Çakmak 2015). Another challenge that is addressed is that various power system simulator tools require various input data, making the exchange of models harder and sometimes erroneous. For this reason, two well-known software platforms are chosen for the comparison, the market available DIgSILENT PowerFactory and the IAI inhouse developed eASiMOV. The presented research does not only aim to set up the network topology but also to define the behaviour of consumption and generation units of the examined area. This subtask was of primary importance, since proper load-flow analysis requires accurate power data. As the main results of the load-flow calculation are highly dependent on the load at the nodes of the system, the two biggest challenges concerning the distribution of the loads are replicating temporal behaviour and identifying separate groups of consumers. The first issue is necessary to be solved to run a 24-hour time-sweep, while addressing the second issue is necessary to determine the spatial distribution of loads. Due to page limitations, this process is only partially shown in the present contribution, while more focus is put on the compilation of the topological data and the example software environments. OVERVIEW OF DATA RESOURCES By the creation of MAVIR Hungarian Transmission System Operator Company Ltd. (hereinafter mentioned as MAVIR) on 1st January 2006, the transmission system operator incorporated the Division for Network Operation from National Power Line Company Ltd. (OVIT) and the Division for Transmission Network from Hungarian Power Companies Plc. (MVM). Within the transmission activity, it is MAVIR’s task to ensure a European-level, safe and balanced electricity supply on its transmission network that enables the improvement of economic life. This transmission network mainly consists of the 750, 400 and 220 kV transmission lines and substations, to connect them and to transmit the electricity. MAVIR also fulfils the transparency requirements of the Congestion Management Guidelines (Annex to Regulation (EC) 714/2009), thus provides an openly available data on topology, generation and consumption levels, power plants and cross-border exchanges. These data served as the basis for the computer models.
Transmission network By the end of 2014, MAVIR operated 30 substations (1 x 750/400 kV, 4 x 400/220/120 kV, 1 x 400 kV, 1 x 400/220 kV, 12 x 400/120 kV, 11 x 220/120 kV) (MAVIR 2013a). The total length of MAVIR operated high-voltage transmission lines was 4855 km (268 km of 750 kV, 2978 km of 400 kV, 1393 km of 220 kV, and 199 km of 120 kV). The vast majority of these lines are overhead lines, only 17 km of the network consists of 120 kV cables (MAVIR 2013b, MAVIR 2014a). Power plants Due to the economic and financial changes of recent years, the Hungarian power plant portfolio is experiencing a huge setback, both in terms of operating hours and active units. The share of cheap imported electricity is reaching new heights, leading to temporary or final shutdown of power plants. A good example of this process is Gönyű power plant, one of the newest units of the country, which only reached an annual load factor of 34% – in its first years. Another aspect of this process is the lack of physical inertia in the system. During summer off-peak periods, sometimes only three of the major plants are operating, leaving complete regions without inertial support. It is expected though that the picture will change in the near future, the market will rearrange itself, and the present period will only be temporary. To provide a rather proper background for modelling electricity generation in the Hungarian system, the authors have built on the dataset of 2013, the last year that has seen most of the plants operating. In the following, a brief overview is given on the state of the power system (MAVIR 2014b). The gross installed generation capacity of Hungarian power plants was 9113.1 MW on 31 December 2013. Taking into account constant losses, available capacity was 7521.1 MW. As installed capacity, there is a controllable capacity of 4824.5 MW (or 3780.7 MW considering constant losses) being available via smallscale and large power plants, that were present on the primary, secondary, tertiary and emergency markets in 2013. Upon the request of AES Tisza II. Power Plant (900 MW), submitted in order to be able to participate in the tender for the “Procurement of Ancillary Services” in 2013, the company regained its operation licence as from 1 January 2013. However, the power plant initiated the suspension of its generation licence. In pursuance to the Resolution, the permission of suspension was valid from 1 July 2013 to 30 June 2016. Due to the expiry of the Operational Licence of generating units X, XI and XII (645 MW) in block “F” of Dunamenti Power Plant (31 December 2012), the generating units above have become derecognised in the installed capacity of the Hungarian system as from 1 January 2013. The Operational Licence of generating unit XIII (215 MW) in block “F” was extended, later the Power Plant initiated the suspension of the Generation
Licence of this unit with regards to which they signed an agreement with the Transmission System Operator. Accordingly, the generating unit is in “constant nonoperational” status as from 1 January 2014. Referring to unfavourable market conditions, E.ON Hungaria group initiated the suspension of the Generation Licence of Debrecen Combined Cycle Power Plant that was approved by Hungarian Energy and Public Utility Authority. The Licence was valid from 1 July 2013 until 30 June 2016. Furthermore, EON initiated the suspension of operation of Nyíregyháza Combined Cycle Power Plant (49 MW). Pursuant to the agreement signed with the Transmission System Operator, the Power Plant is in “constant nonoperational” status with its total installed capacity. The Power Plants intends to suspend its operation until 30 June 2016. Depending on the maintenance periods, Gönyű and Dunamenti G3 Power Plants were available in 2013, however, they were operating only in 10 and 18% of this period, respectively, accounting for a load factor of 7.4% and 13% on an annual basis. This anticipates, depending on future market conditions, the possibility of a “constant non-operational state” of these power plants. The generation licence of Vértes Power Plant will expire on 31 December 2020. In order to sustain urban area heating, the duration of its availability may be temporarily extended. Taking into consideration the above mentioned facts, the suggested power system model of Hungary includes 18 power plants (capacity above 50 MW) that were operational in 2013. These units provide approximately 85% of domestic electricity production (26 366 GWh). The largest hydro power plants (Kiskörei and Tiszalöki erőmű), and two wind parks (Bőny and SopronkövesdNagylózs) are also included, however the share of these units in the final portfolio is neglectable. The remaining 15% (2833 GWh) is generated in small power plants, mostly gas engines, but smaller wind parks also belong to this group. To create a 24-hour representation of the power system, not only the annual generation of the power plants has to be taken into consideration, but one must also examine the generation patterns as well. Based on their behaviour we can define baseload, load-following and peaking power plants. Since the available data is not sufficient to make a good differentiation between the latter two groups, only baseload and load-following plants are modelled. In the Hungarian power system, two power plants provide roughly two-third of the annual generation: Paks nuclear power plant and the Mátrai power plant, running on lignite. During most of the year these two provide baseload capacity, which results in high annual load hours (7685 and 5968 in 2014, respectively), and provides an easy option to model them. In the model, the units are expected to keep a constant output during the day, where the actual output has been determined using the average of the daily load curve and ratio of the plants annual electricity
generation compared to total generation. If the resulting baseload output exceeded the available capacity of the power plant (2000 MW for Paks, 920 MW of Mátra), an upper limitation is set. The power output of remaining power plants is calculated in proportion to their share in total annual generation. In several cases the resulting generation curves exceeded the regulation range of the power plants (e.g. running on 20% load), but since their individual share is rather small, this assumption does not create significant errors during load-flow calculations. Cross-border exchange Partially as a result of the current situation of power plants, the share of imported electricity in the Hungarian consumption mix has reached new highs. Currently, approximately one-third of the total consumption is based on import, making it theoretically the second biggest “fuel source” in the system. Thus it is necessary to take into consideration the cross-border exchange, when creating the power system model of the country. Since there is no openly available data on the ratio of the loading of individual transmission paths, several assumptions have to be made. One of the available options is to use annual exchange volumes between Hungary and its neighbouring countries (MAVIR 2014c). The most important tendencies are that majority of imported electricity is transmitted from Slovakia (balance of 8278.3 GWh in 2013), while the main export routes lead to Croatia (balance of -2491.4 GWh in 2013). Since these exchange volumes do not have any temporal characteristic, they can only be utilised to calculate average daily exchange volumes or average exportimport power values. However, the temporal behaviour of the exchange is far not constant, and in some cases even the direction of transmitted power may change during a day. For this reason, instead of the previous values, transmission network measurements are taken into consideration in order to determine the cross-border exchange in the model. However, these measurements only indicate total exchange powers on state borders, but provide no information on how this is distributed among the separate transmission paths. To distribute the volume of 6 borders among the 15 transmission paths, nominal parameters of the transmission lines are used namely voltage and maximal loading current, which give us a good assumption on the theoretical transfer capacity of each line. Actual transmitted power on each line is then calculated in proportion to their share in total transfer capacity. The resulting exchange is modelled with a fictive load/generator unit, depending on the net volume of transmitted power. Consumption Among the data available on the website of MAVIR, net consumption, net generation and cross-border exchange data are downloaded for two characteristic days of 2014. These two days are the recorded winter and summer
peak consumption days, 1 December and 21 July, respectively. The temporal resolution of all data is 15 minutes. Consumption data of the substations, operated by the Hungarian State Railways, are obtained from the existing database of the authors. To distribute the load among the consumption points of the model, nominal power of substation transformers is used as a basis. In many cases, topology data of power systems includes the ownership of transformers, which allows us to estimate the share of industrial and residential units. However, it would be improper to assume that the industry-owned transformer units are responsible for all industrial consumption, since not all industrial consumers require separate high-voltage feeding points. Smaller industrial consumers are dominantly connected to medium-voltage distribution networks, and thus generate part of the consumption on “residential purpose” transformers. It is assumed that the daily minimum of the load curve (3480 and 3555 MW in the above examples) is evenly distributed among industrial and residential transformers, in proportion to the ratio of their built-in capacity - as if a constant power level is used for industrial electricity use. To distribute the rest of the load, only residential transformers are taken into consideration. In Hungary, the power supply of the railway system is using the same 120 kV sub-transmission network as all other consumers. Currently 42 substations provide traction power. Based on the available data, an average daily load pattern is calculated, which varies between 58 and 123 MW, while the average is 100 MW. This load is distributed among the traction substations in proportion to the nominal power of the transformers, installed at each substation.
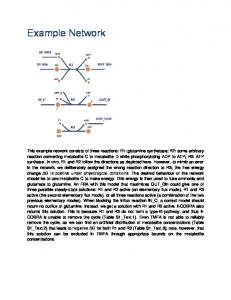
In PowerFactory, “type” and “element” data are defined. For example, in case of a transmission line, the type data includes per length impedance parameters, while exact length of the line is defined among element data. If the line consists of the same conductor for its total length, and the structure of the pylons is also the same, it is easier to define a set of types, representing the most widely used arrangements. However, if a regional or national system is modelled, it will occur relatively often that actual line parameters show a difference compared to our representative models. Thus it is more practical, to define a new type for every single transmission line, entering total impedance values instead of per length values. This latter solution is used in case of the present contribution. The model consist of 470 transmission lines, 386 terminals, 307 loads, 64 transformers, 25 generators and 14 shunt reactors. The graphical layout of the model is prepared aiming to replicate the actual layout of network elements. For this purpose, a background layer has been added to the model, which is an official map, issued by MAVIR. National borders are also indicated for better interpretation. The topological map is shown in figure 1. The colours are selected according to the conventional colouring of Hungarian topological maps, where purple, red, green and blue represent 750, 400, 220 and 120 kV, respectively.
POWERFACTORY MODEL The calculation program PowerFactory, as written by DIgSILENT, was collectively chosen by the authors of the present contribution as one of the tools, with the experience being an important factor for the decision. The constructed network model consists of 120, 220, 400 and 750 kV voltage levels, representing the vast majority of Hungarian transmission and subtransmission network power lines, substations and power plants. Transmission system substations are built with a more detailed model, including power transformers as well, while 120 kV substations are created as junction nodes. Net consumption is modelled with the use of general load elements whereas power plants are represented with synchronous machines. Additional shunt reactors (RL units) are also placed at transmission substations for voltage regulation. At the non-Hungarian end of crossborder lines, fictive load/generator units are used to model both import and export power flows. Due to data handling of PowerFactory being different compared to other modern simulator programs, the authors had two options to model the transmission lines.
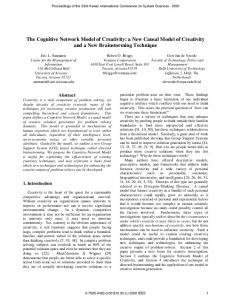
Figure 1: Topology of the Hungarian power system in the PowerFactory model. To implement the summer and winter peak load days, an additional script is created. The script includes 4 subscripts that perform data acquisition from text files. The 4 text files cover generation and load data for the two characteristic days, ordered according to the list of load and generator elements in the model. The main script performs a time-sweep (96 steps in case of 15-minute resolution), at each step setting consumption and generation values, performing a load-flow and storing the results. The script allows the user to decide whether a summer or a winter peak load day is to be simulated. Dunamenti power plant is selected as the system slack. Example results for summer and winter days are shown in figure 2a and 2b, respectively.
(a)
(b)
Figure 2: Load-flow results for summer day (a) and winter day (b), colour representation of substation voltages green: 1 p.u., yellow: 1.05 p.u., orange: 1.1 p.u., red: 1.15 p.u. THE eASiMOV SOFTWARE FRAMEWORK The new software framework eASiMOV for Electrical Grid Analysis, Simulation, Modelling, Optimization and Visualisation was initiated as an expandable collection of software tools for interactive power grid modelling and analysis introducing a distributed system architecture (see figure 3).
import models to and from other simulation software. So far direct import and export functionality for Excel based data sheets, and model data for OpenDSS, Matpower and DIgSILENT PowerFactory have been realized. NEPLAN, Simulink and Siemens PSS SINCAL model connectors will be added to eASiMOV in future. The distributed eASiMOV architecture comprises three main components, which are the Java-based interactive grid modelling editor ePowMod and the simulation software module ePowSim with the power flow computation engines comprising pure CPU with Eigen (Guennebaud 2013), GPU with Arrayfire (Malcolm et al. 2012) and a hybrid simulation with Eigen-CUDA (Storti 2015) using various solvers.The third component is the Java EE-Server application ePowVis that manages external simulators and provides a web based visualisation module for power grid simulation results. It also handles network storages for model and time series data combined with a user database with hierarchical user rights organisation. It supports sharing of simulation models, time series data and simulation results via public hyperlinks. Also various software modules for analysis and interactive exploration of high rate energy data, web based energy data monitoring, remote software control, model converters as well as support for mobile devices are part of the software suite (Çakmak 2014). INTERFACES TO POWERFACTORY Using the PowerFactory Python API (Rueda et al. 2015) and the Java Py4J library (Dagenais 2014) a data and command interface between ePowMod and PowerFactory was developed (see figure 4). This enables to import PowerFactory models and to export eASiMOV models. Via the command interface offline simulations can be performed and the results can be imported back to ePowVis for visual presentation.
Figure 4: Model conversion and offline simulation in PowerFactory. Figure 3: Overview of the eASiMOV software framework with the basic software modules ePowMod, ePowSim and ePowVis. The eASiMOV framework aims at a “One user interface, One simulation model, Multiple simulators” policy. Model data converters enable to export and
After a model in the eASiMOV jmdl-format is imported, the bus, line, transformer and generator data arrays are created. The converter then starts the gateway server and calls the phython script and waits for a response in order to stop the gateway server communication. The Python script fetches the grid model data and creates the PowerFactory model dynamically. In a further step the
Python script requests a power flow simulation in PowerFactory and also to export the simulation results. With a similar approach PowerFactory models in pfdformat can be imported into ePowMod. This enables to create models and execute them in other simulation platforms as Matpower (Zimmerman 2011) or OpenDSS (Montenegro 2012), or simply for data sharing via Excel sheets. The introduced Hungarian transmission network model in PowerFactory serves as a reference for further optimization of the model conversion algorithms. THE eASiMOV MODEL The compiled data resources describing the Hungarian transmission grid are also available as Excel sheets utilizing the IEEE CDF specification. The ePowMod Excel-import filter enables to import the model together with the varying loads as time series data. The 400 kV and 220 kV transmission lines are modeled only roughly, whereas the 120 kV lines are direct node to node connections (see figure 5).
three voltage levels, transformers, switches, loads and connections. The hierarchical model concept in ePowMod uses superblocks for a top-down modelling approach that encapsulates local details. A further benefit of the concept is the ability to store variations of submodels with different levels of details and to compose simulation models easily via configuration scripts. PARALLEL SIMULATION IN MATPOWER Since ePowMod is fully compatible with the power flow module of Matpower, each of the load cases are exported as individual Matpower simulation files. The Matpower model has a total number of 389 nodes and 683 branches, which may vary from the PowerFactory model, since restrictions in the Matpower model definition needed to be considered. The simulation of 96 load cases takes 10.47 seconds in total, which includes the time for creation of output files and 2.09 second for pure power flow calculation for all load cases. The total number of iterations is 480 to solve the NewtonRaphson algorithm for all cases. Using a 32 core parallel simulation the total time for 96 load cases is 2.78 seconds including hard disc write operations. All power flow calculations are performed in 0.39 seconds. Thus, the speedup factor is 3.7 for the complete time series simulation and 5.3 for power flow calculations. A significant benefit of parallel simulation is obtained for more complex and large models with several thousands of nodes. The result of one power flow calculation is shown in figure 7 as a heat map.
Figure 5: The hungary transmission grid model in eASiMOV-ePowMod.
Figure 7: Power flow simulation of a winter day with ePowMod using Matpower. The color scale indicates the voltage magnitudes in p.u.
Figure 6: The detail plan of the station Győr showing the buses with the three voltage levels, breakers and transformers. All 29 substations have been modeled manually according to the MAVIR data (MAVIR 2013a). Figure 6 shows the detailed model of the station Győr with
Note that the visualization may differ from those in figure 2 due to the necessary model adaptation, the simplification regarding the lines and the selected load case. In addition, the rendering methods in PowerFactory and in ePowMod differ. PowerFactory uses colored circles with radial fading; ePowMod uses a Voronoi partitioning (Aurenhammer 1991) and Delaunay triangulation (Fortune 1997). Additionally in figure 7, the superblocks that represent the substations
are flattened. The flattening process produces also a non-optimal graphical triangulation due to the premature automated component placement. FURTHER STUDIES WITH THE HUNGARIAN POWER GRID MODEL The introduced simulation model is available for various simulation platforms and can be used for further studies. For the optimization of the automated transmission power grid model creation using open source data as the OpenStreetMap data, the model could be used as a further benchmarking model (Çakmak 2015). As part of the R&D at IAI but also as contribution to the ES2050 project (ES2050 2016) and the Energy Lab 2.0 project (Hagenmeyer et al. 2016) the new Hungarian model will be embedded into a detailed EU transmission power grid model. Also selected rural and urban low voltage distribution grids as well as specialized island grids as the KIT campus north 20/0.4 kV power grid with a 1 MW solar park will be integrated. The EU power grid model will cover renewable energy sources as solar and wind parks besides the traditional power plants and load profiles based on statistical data combined with standardized load profiles. The introduced Hungary model can also be used for the development of novel forecasting methods for loads (Almeshaiei 2011; Hahn 2009), wind (Monteiro 2009) and solar energy (Ordiano 2016a,b) but also for new stochastic optimal power flow algorithms (Mühlpfordt 2016) and analysis of electricity markets (Keles 2016). The computation of large and complex power grids can be performed in close cooperation with the SCC (Steinbuch Centre for Computing) at KIT on the high performance computer ForHLR II with 24.000 computation nodes (Kühnapfel 2016). This facility can also be used to apply genetic and other soft computing algorithms e.g. to power grid scheduling optimization (Blume et Jakob 2009). The management of large-scale data comprising complex simulation models can be handled with generic data services (Süß 2016) using the large scale data facility located at the SCC-KIT (García 2011). The midterm expected extension for eASiMOV will enable parallel dynamic simulation of large power grids as the highly detailed EU model comprising the introduced new Hungarian transmission model with voltage, power and frequency control on the ForHLR II cluster (Kyesswa 2016; Kundur 1994). CONCLUSIONS In the present contribution, a novel, detailed model of the Hungarian transmission power grid based on openly available data sources is shown. Power flow simulations with the commercial simulation software DIgSILENT PowerFactory and the eASiMOV software suite, which is developed at the IAI-KIT, are carried out. The value of direct model data conversion in eASiMOV is demonstrated. The Hungarian power grid model can be used for further research e.g. for load and power
generation forecasting but also for grid optimization studies. Furthermore, the new model can serve as a basis for future Hungarian power grid expansion planning with renewable energy sources, since only two wind parks are in operation at the moment and more or less no photovoltaic energy is used. REFERENCES Almeshaiei, E.; H. Soltan. 2011. “A methodology for Electric Power Load Forecasting”. Alexandria Engineering Journal, 50(2), June 2011, pp. 137-144, ISSN 1110-0168, dx.doi.org/10.1016/j.aej.2011.01.015. Aurenhammer, F. 1991. “Voronoi diagrams – a survey of a fundamental geometric data structure”. In: ACM Computing Surveys, vol. 23, no.3, pp. 345–405. Blume, C.; W. Jakob. 2009. “GLEAM - ein Evolutionärer Algorithmus und seine Anwendungen”. KIT Scientific Publishing, Band 32, ISBN 978-3-86644-436-2. Christie, R. 1993. “The PSAP File Format” in Power Systems Test Case Archive. (15.02.2017). www2.ee.washington.edu/research/pstca/formats/psap.txt. Çakmak H.K.; H. Maas; F. Bach; and U. Kühnapfel. 2014. “A New Framework for the Analysis of Large Scale MultiRate Power Data”. In: KIT Scientific Working Papers 21, Publisher: KIT, Karlsruhe, ISSN: 2194-1629, urn:nbn:de:swb:90-423694. Çakmak, H.K.; H. Maaß; F. Bach; U. Kühnapfel; and V. Hagenmeyer. 2015. “Ein Ansatz zur automatisierten Erstellung umfangreicher und komplexer Simulationsmodelle für elektrische Übertragungsnetze aus OpenStreetMap-Daten”, at – Automatisierungstechnik, 63(11), pp. 911-925, DOI: 10.1515/auto-2015-0046. Dagenais, B. 2014. “Py4J - A Bridge between Python and Java”. https://www.py4j.org (15.02.2017). ES2050. 2016. “Energy System 2050 – A Contribution of the Research Field Energy”,Helmholtz Assoc. (15.2.2017). helmholtz.de/forschung/energie/energie_system_2050. Fortune, S. 1997. “Voronoi diagrams and Delaunay triangulations”. In: Handbook of discrete and computational geometry, Jacob E. Goodman and Joseph O'Rourke (Eds.). CRC Press, Boca Raton. pp. 377-388. García, A.; S. Bourov; A. Hammad; J. van Wezel; B. Neumair; A. Streit; V. Hartmann; T. Jejkal; P. Neuberger; and R. Stotzka. 2011. “The large scale data facility: data intensive computing for scientific experiments”. In: 25th IEEE International Symposium on Parallel and Distributed Processing Workshops and Phd Forum (IPDPSW) (2011), S. 1467–1474; doi:10.1109/IPDPS.2011.286. Guennebaud, G. 2013. “Eigen: a c++ linear algebra library. Libraries for scientific computing”. Ecole Polytechnique. Hagenmeyer, V; H.K. Çakmak; C. Düpmeier; T. Faulwasser; J. Isele; H.B. Keller; P. Kohlhepp; U. Kühnapfel; U. Stucky; S. Waczowicz; and R. Mikut. 2016. “Information and communication technology in energy lab 2.0: Smart energies system simulation and control center with an open-street-map-based power flow simulation example”. In: Energy Technology, 4 (1), pp. 145-162. doi:10.1002/ente.201500304. Hahn, H; S. Meyer-Nieberg; S. Pickl. 2009. “Electric load forecasting methods: Tools for decision making”. European Journal of Operational Research, Volume 199, Issue 3, 16 December 2009, Pages 902-907, ISSN 03772217, http://dx.doi.org/10.1016/j.ejor.2009.01.062.
Keles, D.; J. Scelle; F. Paraschiv; and W. Fichtner. 2016. Extended forecast methods for day-ahead electricity spot prices applying artificial neural networks. Applied energy, 162, 218–230. doi:10.1016/j.apenergy.2015.09.087. Kundur, P. 1994. “Power System Stability and Control”, McGraw-Hill Education; 1st edition, ISBN-13: 9780070359581. Kühnapfel, U.; H.K. Çakmak; D. Piccioni Koch. 2016. “Power Grid Simulation – Using the MATPOWERLibrary on bwUniCluster for high-performance parallel Power Flow Timeseries Computation”. Workshop HGFProgramm SBD - Schwerpunkt “Energie, 30.6.-1.7.2016. Kyesswa, M. 2016. “Analysis of power system dynamics”. 2016. Doktorandenworkshop der Initiative EnergieSystem 2050, Friedrichsdorf, 7.-8. Dezember 2016. Malcolm, J.; P. Yalamanchili; C. McClanahan; K. Patel; V. Venugopalakrishnan; and J. Melonakos. 2012. “ArrayFire: a GPU acceleration platform”. In: SPIE Defense, Security, and Sensing. pp. 84030A–84030A. International Society for Optics and Photonics. MAVIR. 2013a. “Transmission network substations of MAVIR Ltd.”. MAVIR Hungarian Independent Transmission Operator Company (In Hungarian: A MAVIR Zrt. átviteli hálózati alállomásai). MAVIR. 2013b. “Transmission lines of MAVIR Ltd.”. (In Hungarian: A MAVIR Zrt. átviteli hálózati távvezetékei). MAVIR. 2014a. “Data of the Hungarian Electricity System”. MAVIR. 2014b. “Medium and lon-term generation capacity development plan of the Hungarian power system”. (In Hungarian: A Magyar Villamosenergia-rendszer közép- és hosszútávú forrásoldali kapacitásfejlesztése). MAVIR. 2014c. “Statistical data of the Hungarian Power System 2013”. Monteiro, C.; R. Bessa; V. Miranda; A. Botterud; J. Wang; and G. Conzelmann. 2009.“Wind Power Forecasting: State-of-the-Art 2009“, ANL/DIS-10-1, Argonne National Laoratory, http://www.osti.gov/bridge. Montenegro, D.; M. Hernandez; G.A. Ramos. 2012. “Real time OpenDSS framework for distribution systems simulation and analysis”. Sixth IEEE/PES Transmission and Distribution: Latin America Conference and Exposition (T&D-LA), Montevideo, 2012, pp. 1-5. doi: 10.1109/TDC-LA.2012.6319069. Mühlpfordt, T.; T. Faulwasser; and V. Hagenmeyer. 2016. “Solving stochastic AC power flow via polynomial chaos expansion”. IEEE Conf. on Control Applications, Buenos Aires, pp. 70-76, doi: 10.1109/CCA.2016.7587824. Ordiano, J.A.G.; W. Doneit; S. Waczowicz; L. Gröll; R. Mikut; and V. Hagenmeyer. 2016a. “Nearest-Neighbor Based Non-Parametric Probabilistic Forecasting with Applications in Photovoltaic Systems”, Proc., 26. Workshop Computational Intelligence, Dortmund, 2016, 2017arXiv170106463A. Ordiano, J.A.G.; S. Waczowicz; M. Reischl; R. Mikut; and V. Hagenmeyer. 2016b. “Photovoltaic Power Forecasting using Simple Data-driven Models without Weather Data”. Computer Science - Research and Development, pp. 1–10. Portante, E.C.; J.A. Kavicky; J.C. VanKuiken; and J.P. Peerenboom. 1997. “Load Flow Analysis: Base Cases, Data, Diagrams, and Results”, AND/DIS/TM-40. Rueda, J.L.; F.M. Gonzalez-Longatt. 2015. “PowerFactory Applications for Power System Analysis”, Springer, ISBN: 978-3-319-12957-0. Storti, D.; M. Yurtoglu. 2015. “CUDA for Engineers: An Introduction to High-Performance Parallel Computing”. Addison Wesley, ISBN: 978-013417741.
Süß, W.; K.-U. Stucky; W. Jakob; H. Maaß; and H.K. Çakmak. 2016. “Generic data services for the management of large-scale data applications”. WSEAS transactions on computers, 15, pp. 265-278. Uslar, M; M. Specht; S. Rohjans; J. Trefke; and J.M. González. 2012. “The Common Information Model CIM”, Springer, ISBN 978-3-642-25215-0. Working Group on a Common Format for the Exchange of Solved Load Flow Data. 1973. “Common Data Format for the Exchange of Solved Load Flow Data”. IEEE Transactions on Power Apparatus and Systems, Vol. PAS92, No. 6, Nov./Dec. 1973, pp. 1916-1925. Zimmerman, R.; C. Murillo-Sánchez; and R. Thomas. 2011. “MATPOWER: Steady-State Operations, Planning and Analysis Tools for Power Systems Research and Education”. IEEE Transactions on Power Systems, vol. 26, no. 1, pp. 12-19.
AUTHOR BIOGRAPHIES HÜSEYIN KEMÂL ÇAKMAK was born in 1971 in Bolu-Turkey. He holds a Ph.D. in computer sciences from the University Karlsruhe-Germany (2000). He is scientific staff at the Institute for Applied Computer Sciences at the Karlsruhe Institute of Technology. His research interest include modeling, simulation, visualization, 3d/VR/AR, big data analysis, web systems and parallel computing for energy system analysis. His e-mail address is:
[email protected] BÁLINT HARTMANN was born in 1984. He received M.Sc. degree in electrical engineering and obtained his Ph.D. degree from Budapest University of Technology and Economics in 2008 and 2013, respectively. He is senior lecturer with the Department of Electric Power Engineering, Budapest University of Technology and Economics. He is also a part-time research fellow with the Centre for Energy Research, Hungarian Academy of Sciences. His fields of interest include distributed generation, renewable energy sources, energy storage and smart grids. His e-mail address is:
[email protected] UWE G. KÜHNAPFEL is leader of the working group energy systems simulation and analysis at the Institute for Applied Computer Sciences at Karlsruhe Institute of Technology. His main research fields are energy systems (modeling, simulation, monitoring, analysis), mechatronics, virtual and augmented reality. His e-mail address is:
[email protected] VEIT HAGENMEYER was born in 1971. He is director of the Institute for Applied Computer Sciences at Karlsruhe Institute of Technology. His main field of research is automation technology, control engineering and energy informatics. His e-mail address is:
[email protected]