Proceedings of the 7th Asia-Pacific Conference on Complex Systems Cairns Converntion Centre, Cairns, Australia 6-10th December 2004
Complex 2004
Scale-Free Networks and Robustness of Critical Infrastructure Networks A. H. Dekker 1 and B. Colbert 2 1 Defence Science and Technology Organisation DSTO Fern Hill, Department of Defence, Canberra ACT 2600 AUSTRALIA Email:
[email protected] 2
School of Information Technology, Deakin University 221 Burwood Highway, Burwood VIC 3125 AUSTRALIA
Abstract We examine the robustness of critical infrastructure networks, specifically aspects which relate to the network topology. We describe some simulation studies which identify a number of characteristics that make a network robust in the face of terrorist attacks, taking link capacity into account. Our simulations utilise a network analysis package called CAVALIER, which we have developed. Our results confirm the resistance of scale-free networks to random failures, but not to targeted terrorist attacks. We show that physical networks, including telecommunications networks, are not scale-free, and therefore the robustness of other kinds of networks is more relevant to critical infrastructure. However, terrorist organisations are structured as scale-free networks, which suggests that they might themselves be vulnerable. We examine the feasibility of targeting scale-free networks by examining two historical case studies, from the 1st and 14th centuries.
1.
Introduction
Modern technological civilisation is dependent on its critical infrastructure networks: communication, electrical power, rail, and fuel distribution networks. Failure of any of these critical infrastructure networks can bring the ordinary activities of work and recreation to a standstill: schools close, government and businesses are unable to function, medical personnel cannot treat the sick and injured, and people are left isolated, cold, and in the dark. This dependence has led to the frequent selection of critical infrastructure networks as military targets in times of war. In the US Civil War, the rail junction of Chattanooga became a key military objective, and telegraph networks were also attacked (Dickson, 2001). In the Second World War, Allied bombers targeted rail, fuel, and electrical power networks in the German Ruhr. More recently, in the former Yugoslavia, the US Air Force temporarily disabled electrical power stations by dropping conductive fibres (Jones & Geppert, 2002).
Complex2004
The 7th Asia-Pacific Conference on Complex Systems
The same vulnerability that makes critical infrastructure networks attractive as military targets also makes them targets for terrorist attacks. Terrorist attacks on electrical power networks, rail networks, and oil pipelines have occurred in Colombia, India, Pakistan, Turkey, Algeria, and Spain (ICT, 2004). An important aspect of critical infrastructure networks is their interdependence. Attacks on the electrical power and communication networks in particular have a “force multiplier” effect on other services. For example, the terror attacks which destroyed the Twin Towers in New York City on 11 September 2001 had the side-effect of severely damaging Verizon’s central telephone switch, and destroying many communication antennas. Police and other emergency services lost both communications and electrical power (Van Ooyen et al, 2002). The critical infrastructure networks we have discussed, like all other networks, consist of nodes (railway stations, pumps, transformers, switches, etc.) and links (tracks, pipes, cables, etc.). Trains, oil or gas, electrical power, and messages flow through the networks, and importantly each link has a fixed capacity. A single track can only carry only so many railway carriages per hour, a communication line can carry only so many bits per second, etc. Redundancy in the network comes from the presence of alternate paths along which traffic (trains, fuel, electrical power, or messages) can travel. However, if the usual (shorter) path on which traffic travels is unavailable, and traffic is re-routed along a longer path, the total load on the network is increased. This in turn can result in further overloaded links and more rerouting. If this process “snowballs” out of control, the result is a cascading failure of the network. This is more likely to occur if the overload condition causes the links or the nodes to fail completely (Motter & Lai, 2002). Cascading failure has occurred several times in the North American electrical power grid, with major blackouts occurring in March 1989, August 1996, and August 2003. These failures could have been avoided if some load had been shed instead of being re-routed (Amin, 2001). In this paper, we examine the robustness of critical infrastructure networks, specifically aspects which relate to the network topology, rather than other network characteristics, such as management and control, or physical security. We describe some simulation studies which identify a number of characteristics that make a network robust in the face of terrorist attacks. Specifically, networks begin to fail when the number of attacks is equal to the node connectivity, with the severity of failure dependent on the average degree. Our simulations utilise a tool suite for analysing, visualising, and simulating networks called CAVALIER (Dekker, 2001; Dekker, 2003), which we have developed. The visualisation capabilities of CAVALIER were used to produce the diagrams in this paper. Scale-free networks (Barabási, 2002) have been recently introduced into the field of network theory, and have been found to accurately model a wide range of phenomena, including social interactions and the logical structure of the Internet. Scale-free networks are resistant to random failure, but not to targeted terrorist attacks. However, we show that physical networks, including telecommunications networks, are not scale-free, and therefore the robustness of other kinds of networks is more relevant to critical infrastructure. Terrorist organisations, however, are structured as scale-free networks (Sageman, 2004), which raises the possibility that targeted law-enforcement activities will be able to neutralise them. We examine two historical cases where such techniques were used: the Cathars in the 14th century, and the early Christians in the 1st century. In the first case, authorities succeeded in neutralising the nascent movement, while in the second case they did not. The historical evidence is thus ambiguous as to whether targeted law-enforcement activities will be successful, thus indicating that further modelling of terrorist organisations is needed.
Complex2004
2.
The 7th Asia-Pacific Conference on Complex Systems
Network Farming and Graph Theory
In order to study network-based processes, we use network farming, a technique we have developed (Dekker, 2004b) as an extension of data farming. Data farming was developed by Gary Horne for the US Marine Corps (Horne, 1997; Brandstein & Horne, 1998). In network farming, we study the performance of a complex parameterised process P(N,x1,…,xn), normally simulated by a computer model (often agent-based). The parameter N here is a particular network topology, while x1,…,xn are numerical parameters. For the study reported in this paper, the parameters are the number of attacks (which ranged from one to six), and the style of attack (centralised or random, as described in Section 5). In order to study the process P(N,x1,…,xn), we must generate a list of different networks N, as well as choosing values or ranges for the numerical parameters. For the purpose of analysis, we therefore derive various metrics M1(N),…,Mm(N) for each network N. These metrics provide a numerical summary of the structure of the networks N. We can then use statistical and visualisation techniques, to see how performance varies with the parameters and metrics. The mathematical discipline of graph theory (Biggs, 1993; Gibbons, 1985) is a natural way to study network topologies. Graph theory models the topology of a critical infrastructure network as an (undirected) graph consisting of nodes and links. Graph theory also provides the metrics necessary for network farming. If the number of outgoing (or incoming) links of a node is d, then we say that the node has degree d. For the network as a whole, we can then calculate the minimum, maximum, and average degrees, and these are potentially useful metrics. In previous work (Dekker & Colbert, 2004; Dekker, 2004a), we identified node connectivity as the best single robustness metric for a network. The node connectivity of a network is the smallest number of nodes whose removal disconnects the network, or equivalently, the smallest number of node-distinct paths between any pair of nodes. Our CAVALIER tool includes a facility for calculating node connectivity and other metrics. The diameter of a network is the longest of all the shortest paths between pairs of nodes. It provides a limit on the average distance, which is the average length of all shortest paths between pairs of nodes. Networks with low diameter and average distance are desirable, because traffic uses fewer links to get to its destination, and therefore places less load on the network as a whole.
3.
Scale-Free Networks
The concept of scale-free networks was introduced by Barabási & Albert (1999), and scalefree networks have attracted a great deal of interest (Bollobás, 2001; Albert & Barabási, 2002; Barabási, 2002; Barabási & Bonabeau, 2003; Bollobás & Riordan, 2003).
Complex2004
The 7th Asia-Pacific Conference on Complex Systems
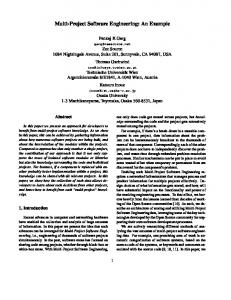
Figure 1: A 2-Linked Scale-Free Network Scale-free networks grow by a process of preferential attachment. In particular, a k-linked scale-free graph grows by incrementally adding nodes, and connecting each new node by k links to existing nodes (k must be at least 2 to guarantee connectivity). These new links are preferentially connected to existing highly-connected “hub” nodes. In particular, the nodes that the new links go to are chosen randomly with probability proportional to their degree (it is possible for some or all of these links to go to the same node). Figures 1 and 2 show randomly generated 2-linked and 4-linked networks respectively.
Figure 2: A 4-Linked Scale-Free Network Bollobás (2001) has shown that such a randomly-generated scale-free network is almost certainly connected, with very small diameter. Plotting the number of nodes of a given degree against their degree on a log-log scale gives a straight line (Albert & Barabási, 2002; Barabási & Bonabeau, 2003). Alternatively, plotting the rank of nodes (i.e. 1 for the node with highest degree, 2 for the next node, and so on) against their degree also gives a straight line, and this usually gives a clearer result for small networks. Figures 3 and 4 show these graphs for the networks of Figures 1 and 2.
Complex2004
The 7th Asia-Pacific Conference on Complex Systems
Figure 3: Rank/Degree log-log Plot for 2-Linked Scale-Free Network The straight line indicates that the rank of nodes is inversely proportional to some power of their degree. Specifically, the rank of a node of degree d is proportional to d –1.7. This means that low-degree nodes are common, but high-degree “hub” nodes are exponentially more rare. Scale-free networks have small diameter, and are resistant to random attacks, but are not particularly robust against deliberate attack (Albert & Barabási, 2002; Barabási & Bonabeau, 2003; Bollobás & Riordan, 2003). This is confirmed by our simulation results in Section 6.
Figure 4: Rank/Degree log-log Plot for 4-Linked Scale-Free Network
4.
Scale-Free Networks and Critical Infrastructure
At a logical level, critical infrastructure networks can be scale-free. For example, at a TCP/IP level the Internet is a scale-free network (Faloutsos et al, 1999). This holds at both the domain and router levels, and at both these levels there are “hubs” which have TCP/IP connections to many other nodes. However, at a physical level, critical infrastructure networks are not usually scale-free. Hubs of high degree are not generally possible, since there is room for only so many railway tracks, pipes, or cables to connect to a single spot. For example, Figure 5 shows a communications network for the Qwest Internet service provider, redrawn from the Atlas Of Cyberspaces (Dodge, 2004). In this network, 92% of the nodes have degree 2 or 3.
Complex2004
The 7th Asia-Pacific Conference on Complex Systems
Figure 5: Qwest Internet Backbone Network The corresponding rank/degree plot in Figure 6 shows two long sequences of nodes. This is similar to the plot in Figure 8 of the non-scale-free random network in Figure 7, where 57% of the nodes have degree 4 or 5. The data points in Figures 6 and 8 do not fit a straight line as they did in Figures 3 and 4.
Figure 6: Rank/Degree log-log Plot for Qwest Internet Backbone Network
Figure 7: Random Network with Average Degree 5
Complex2004
The 7th Asia-Pacific Conference on Complex Systems
Figure 8: Rank/Degree log-log Plot for Random Network with Average Degree 5 How then, can the Internet be scale-free? This results from multiplexing, where a large number of logical TCP/IP connections are carried over a very much smaller number of physical links, such as ATM, ethernet, and frame relay. It is also possible for a logical link to represent a path containing many physical links. Since we are concerned with robustness in the face of physical destruction of nodes, the structure of the Internet at the physical level is most appropriate. However, it should be noted that in the transmission of viruses (PastorSatorras & Vespignani, 2001), the logical structure is of more significance. In particular, the scale-free logical structure of the Internet means that virus infections can propagate even with low spreading rates. Critical infrastructure networks are also often planar, i.e. they can be drawn on paper without crossing links. Figure 5 is an example of a planar network. When railway tracks cross, it usually makes sense to build a station (i.e. a node) and similar factors apply to other critical infrastructure networks. For networks built from pipes or cables buried in trenches, crossing links are often avoided where possible, because of the dangers of damaging infrastructure while digging new trenches. On the other hand, scale-free networks are typically not planar.
5.
The CAVALIER Terrorist Attack Simulator
The CAVALIER tool which we have developed includes a simulator for studying the effect of terrorist attacks on networks. The terrorist attack simulator studies the effect of destroying nodes in a network which sends “packets” of traffic to and fro along links, i.e. a network such as a rail or communications network. The simulator assumes that the same number of packets are sent between every pair of nodes, and that each link in the network has just enough capacity to handle the load that would exist in a ring-shaped network topology. The simulator then simulates the behaviour of the network with between 1 and 6 nodes destroyed by terrorist attack, and measures the percentage of packets which successfully reached their destination (over 10 choices of node removal, and 10,000 packets sent). Clearly, this is a network farming process, and the simulator is simulating a terrorist attack process P(N,x,y), where x is the number of attacks, and y is the attack mode. For the purpose of analysis, we utilise two numerical metrics for each network N, namely node connectivity and average degree.
Complex2004
The 7th Asia-Pacific Conference on Complex Systems
The network farming process requires a method for generating a list of different networks N. For the study described in this chapter, we generated a variety of networks with 60 nodes, using a combination of three techniques: • Nine randomly generated scale-free networks, three 2-linked, three 3-linked, and three 4linked, including the two networks shown in Figures 1 and 2. • Fifty randomly generated networks, with average degree ranging from 2 to 10, created by taking a randomly generated tree network and adding additional links with the identical probability for a link being added between any pair of nodes (i.e. the Erdös-Rényi model). Figure 7 illustrates one of the randomly generated networks used. • A fixed list of six symmetrical networks, satisfying the design criteria in Dekker & Colbert (2004), and shown in Figure 9.
Figure 9: Six Designed Networks The simulator uses a shortest-path routing algorithm, i.e. packets are sent along the shortest path or paths. The simulator balances traffic between all the shortest paths if there is more than one. However, if all the shortest paths are loaded to maximum capacity, the simulator drops traffic rather than re-routing it on longer paths. This simulates strategies for preventing cascading failure, which can result from such re-routing (Amin, 2001). Two terrorist attack strategies are used: • Centralised attack: where terrorists select the most central, or most important, node (or one of the most central nodes, if there are several choices). • Random attack: where terrorists choose a node to be destroyed purely at random. The concept of centrality used is that in Dekker (2002), i.e. the most central node is the one with the largest average closeness to all the other nodes (where closeness is the inverse of distance). Centralised attack is the more realistic model of terrorist operations, since terrorists can be expected to target precisely those nodes whose destruction has the most impact.
The 7th Asia-Pacific Conference on Complex Systems
Complex2004
6.
Simulation Results
For the case of centralised attacks, the results of our simulation are shown in Table 1. The measure of performance we use is the average percentage of packets which successfully reached their destination. Table 1 indicates, for each of the three kinds of network: • The average percentage of messages received, over one to six attacks. • The range of node connectivities for each kind of network. • The range of average degrees for each kind of network (which are equal to the node connectivities for the designed networks). • The average percentage of messages received for different numbers of attacks. Table 1. Simulation Results — Centralised Attack Network
Ave Msgs Rcvd
Node Conn. Range
Ave Deg. Range
Messages Received for Relative Number of Attacks (%) –1
0
1
2
3
4
5
Scale-free
93.5%
1–3
3.6–7
99
98
12l+76 (96)
13l+74 (95)
21l+57 (92)
85
68
Random
76.6%
1–5
2–10
100
41l+17 (84)
52l–7 (79)
56l–16 (76)
62l–25 (72)
72l–40 (62)
78l–50 (46)
Designed
98.5%
3–5
3–5
100
9l+86 (98)
98
96
94
Because of the importance of node connectivity, we have found it useful to count the relative number of attacks, i.e. the difference between the number of attacks and the node connectivity. For example, if the node connectivity is 3, then the relative attack numbers for one to six attacks are –2 to 3. The percentage of messages received in this case is often dependent on the average degree, or rather on the logarithm (l) of the average degree, since the relationship is highly non-linear. Where this relationship exists and is statistically significant, we indicate this in Table 1, as well as showing the average value. This dependence on average degree means that adding links to a network can improve performance, even when the addition is random (although the best performance occurs with the designed networks, where node connectivity and average degree are identical). It is illustrated graphically in Figure 10, where the percentage of messages received (vertical axis) increases dramatically as the average degree increases (moving into the figure), particularly at high relative numbers of attacks (on the right of the figure). Figure 10 also shows the excellent performance of the symmetrical designed networks (boxes), compared to the scalefree networks (cylinders), and the random networks (spheres). Table 1 shows that most networks begin to fail when the number of attacks is equal to the node connectivity (i.e. zero relative attacks), although some well-designed networks, such as the Rhombicosidodecahedron network in Figure 9(e) and the Snub Dodecahedron network in Figure 9(f), do not fail with up to six terrorist attacks. The scale-free networks do not perform as well as the designed networks, although they have more links. However, they do perform better than the random networks.
Complex2004
The 7th Asia-Pacific Conference on Complex Systems
Figure 10: Performance as a Function of Average Degree and Relative Attacks — Centralised Attack The vulnerability of scale-free networks to targeted attacks has been demonstrated in previous studies that do not take link capacity into account (Albert & Barabási, 2002; Barabási & Bonabeau, 2003; Bollobás & Riordan, 2003). Our simulation results confirm this in a setting which does take account of link capacity. There are two fundamental reasons for this vulnerability. Firstly, although scale-free networks may have many links, these links are often attached to “hubs,” so that terrorist attacks on the “hubs” will simultaneously disable many links. The second factor is that, although scale-free networks have very low diameter and average distance between nodes, these two metrics increase as nodes are destroyed. Holme et al (2002) showed that the average distance in a scale-free network increases approximately linearly as nodes are destroyed. This is confirmed by studying the behaviour of our scale-free networks under terrorist attack. For these networks, the average distance did indeed increase approximately linearly, until the networks were disconnected. Figure 11 shows the growth of average distance under attack for the 2-linked (circles), 3-linked (rounded boxes), and 4linked (square boxes) scale-free networks. The average distances are adjusted relative to the averages for the 2-linked (2.88), 3-linked (2.46), and 4-linked (2.20) networks. The correlation in this graph is 0.96, with an extremely high statistical significance.
Figure 11: Growth of Average Distance under Centralised Attack
The 7th Asia-Pacific Conference on Complex Systems
Complex2004
For random attacks, the results of our simulation are shown in Table 2 and Figure 12. Random attacks are less realistic as a model of terrorist behaviour, and correspond more closely to accidental failures. For the random attack case, none of the designed networks failed (with up to six attacks), and the scale-free networks almost never failed. However, the randomly generated networks continue to perform poorly, especially with low average degree. Table 2. Simulation Results — Random Attack Network
Ave Msgs Rcvd
Node Conn. Range
Ave Deg. Range
Messages Received for Relative Number of Attacks (%) –1
0
1
2
3
4
5
Scale-free
99.8%
1–3
3.6–7
99.9
99.9
99.9
99.9
99.8
99.5
98.5
Random
94.2%
1–5
2–10
100
12l+77 (96)
14l+72 (95)
16l+68 (94)
18l+66 (93)
27l+52 (89)
33l+44 (85)
Designed
100%
3–5
3–5
100
100
100
100
100
Figure 12: Performance as a Function of Average Degree and Relative Attacks — Random Attack Our simulations confirm the resistance of scale-free networks to random attacks demonstrated in previous studies which do not take link capacity into account (Albert & Barabási, 2002; Barabási, 2002; Barabási & Bonabeau, 2003). This resistance is not relevant to terrorist attacks, although the properties of scale-free networks are relevant to the robustness of organizations, including terrorist organisations themselves, and we discuss this next.
7.
Responding to Scale-Free Networks
We have established the fact that scale-free networks are vulnerable to targeted attacks on their most important nodes. This leads to an interesting implication for countering terrorist organisations themselves. Several studies have shown that terrorist organisations are scalefree networks (Krebs, 2002; Sageman, 2003; Sageman, 2004).
Complex2004
The 7th Asia-Pacific Conference on Complex Systems
Indeed, terrorist organisations appear to grow by the process of preferential attachment of new recruits to highly connected “hub” individuals. This fact is not surprising, since scalefree networks are ubiquitous in social networks: collaboration networks between movie actors and scientists are also scale-free, as are phone-call patterns and sexual networks (Albert & Barabási, 2002). Social Network analyses by the first author in the Australian Department of Defence have replicated this scale-free pattern. The scale-free nature of terrorist organisations means that uncoordinated responses will have limited success. However, good police work to identify and arrest highly connected individuals should be much more successful (Sageman, 2003; Sageman, 2004). There is some historical support for this recommendation. Ormerod & Roach (2003) make the observation that the Cathars in southern France formed a scale-free network. The Cathars or Albigensians were a sect that appeared in southern France in the late 12th century, and were perceived as a serious religious and political threat to society. Initially, this threat was countered by a military campaign, led by Simon de Montfort. This campaign ended with the fall of the Cathar fortress of Montségur in 1244, but the Cathar movement continued to linger in the mountains of Ariège in the Diocese of Pamiers (le Roy Ladurie, 1978). A more successful response was mounted by Jacques Fournier, who became the local bishop in 1317. Assisted by the Dominican Inquisition, he implemented what today would be called good police work: employing informers, taking detailed witness statements, and identifying key individuals (Ormerod & Roach, 2003). These individuals were then neutralised either by imprisonment, by being forced to go on a pilgrimage (to Rome, Constantinople, or Canterbury), or by being forced to wear yellow crosses on their clothing, which discouraged social contact. After 8 years of these tactics, Catharism was a spent force (le Roy Ladurie, 1978). On the other hand, other historical evidence should provide a note of caution. Barabási’s classic book on networks (Barabási, 2002) points out that the early Christians formed a scalefree social network, with the apostle Paul (the great traveller and writer) as one of the mostconnected “hub” individuals. Christianity was also viewed as a religious and political threat by Roman and Jewish authorities, who made determined efforts to suppress the new religion. Of the key first century individuals—apostles, writers, and bishops of major cities—at least half were neutralised. The apostle Judas was financially corrupted and the apostle John was exiled to the penal colony of Patmos, but most key individuals were simply executed. James, the first bishop of Jerusalem, was stoned to death (62 AD), Ignatius, bishop of Antioch, was eaten alive by lions (107 AD), and Paul himself was beheaded (65 AD), after having been imprisoned and beaten many times during his career (Farmer, 1997). However, the deaths of these martyrs in fact strengthened, rather than weakened, the Christian cause. Particularly in Rome, early Christians were forced to meet underground, in catacombs. Yet, by 312 AD, when Constantine became the first Roman emperor sympathetic to Christianity, the new religion was well-established, and today approximately 2 billion people identify themselves as Christian (Barabási, 2002). There is therefore no firm guarantee of success for the strategy of neutralising the highly connected “hub” nodes of scale-free organisations.
8.
Conclusions
In this paper, we have examined the robustness of the critical infrastructure networks on which civilisation depends, and which are now under the threat of terrorist attack. We have used an extension of data farming, which we call network farming, as a framework for conducting a simulation experiment.
Complex2004
The 7th Asia-Pacific Conference on Complex Systems
This network farming process involved generating a test set of network topologies, and using metrics derived from graph theory to analyse the results. The network topologies we used included the designed networks in Figure 9, nine scale-free networks, and fifty randomly generated networks. For each network, we simulated the effect on performance of targeted and random terrorist attacks. Most networks began to fail when the number of attacks was equal to the node connectivity, although some designed networks did not fail, even with up to six terrorist attacks. On the other hand, randomly generated networks were not robust. Scale-free networks were robust against random attacks, but not against targeted attacks. These are general observations, however, and the behaviour of a specific real-world critical infrastructure network will depend on sector-specific factors. For this reason, we expect to see more sophisticated sector-specific terrorist attack modelling emerge over the next few years. The vulnerability of scale-free networks suggests techniques for law-enforcement personnel to respond to terrorist organisations, since terrorist organisations are themselves scale-free networks. However, historical experience is ambiguous on the prospects of success for these techniques, and therefore more sophisticated modelling of the growth of these organisations is necessary. A significant future challenge will be modelling, monitoring, and managing the interactions between critical infrastructure networks. Most important of all, modelling of terrorist organisations themselves needs to be improved. In particular, the processes by which terrorist organisations grow or recover from the loss of a leader (Sageman, 2004) need to be better understood and modelled, in order to guide law-enforcement personnel. Emerging techniques in agent-based simulation of social structures (Srbljinović et al, 2002; Lustick, 2002; Raczynski, 2004) will be essential in this endeavour.
Acknowledgements The authors are indebted to Martine Dekker and David Wood for comments on earlier drafts of this paper. Figures 9, 10, and 12 were produced by interfacing CAVALIER to the Persistence of Vision™ ray-tracing package.
References Albert, R. & Barabási, A.-L. (2002), Statistical mechanics of complex networks, Reviews of Modern Physics, 74, 47–97. http://www.nd.edu/~networks/Papers/review.pdf Amin, M. (2001), Towards Self-Healing Energy Infrastructure Systems, IEEE Computer Applications in Power, January, 20–28. Barabási, A.-L. & Albert, R. (1999), Emergence of scaling in random networks, Science, 286, 509–512. http://www.nd.edu/~networks/Papers/science.pdf Barabási, A.-L. (2002), Linked: The New Science of Networks, Perseus Publishing, Cambridge, Massachusetts. Barabási, A.-L. & Bonabeau, E. (2003), Scale-Free Networks, Scientific American, 288, 50– 59. http://www.nd.edu/~networks/PDF/Scale-Free Sci Amer May03.pdf
Complex2004
The 7th Asia-Pacific Conference on Complex Systems
Biggs, N. (1993), Algebraic Graph Theory, 2nd edition, Cambridge University Press. Bollobás, B. (2001), Random Graphs, 2nd edition, Cambridge University Press. Bollobás, B. & Riordan, O. (2003), Robustness and Vulnerability of Scale-Free Random Graphs, Internet Mathematics 1 (1), 1–35. Brandstein, A. G. & Horne, G. E. (1998), Data Farming: A Meta-technique for Research in the 21st Century, Maneuver Warfare Science 1998, US Marine Corps Combat Development Command Publication, http://www.mcwl.quantico.usmc.mil/divisions/albert/research/documents/data_farming.rtf Dekker, A. H. (2001), Visualisation of Social Networks using CAVALIER, Proc. Australian Symposium on Information Visualisation, P. Eades & T. Pattison (Eds.), Sydney, Australia. Conferences in Research and Practice in Information Technology, 9, 49–55. http://crpit.com/confpapers/CRPITV9Dekker.pdf Dekker, A. H. (2002), C4ISR Architectures, Social Network Analysis and the FINC Methodology: an Experiment in Military Organisational Structure, DSTO Report DSTO-GD0313, January. http://www.dsto.defence.gov.au/corporate/reports/DSTO-GD-0313.pdf Dekker, A. H. (2003), Using Agent-Based Modelling to Study Organisational Performance and Cultural Differences, Proc. MODSIM 2003 International Congress on Modelling and Simulation, Townsville, Queensland, 1793–1798. http://mssanz.org.au/modsim03/Media/Articles/Vol 4 Articles/1793-1798.pdf Dekker, A. H. (2004a), Simulating Network Robustness: Two Perspectives on Reality, Proceedings of the SimTecT 2004 Simulation Conference, Canberra, 126–131. Dekker, A. H. (2004b), Network Farming for the Analysis of Complex Network Systems, Presentation to the Complex Adaptive Systems in Defence Workshop, University of Adelaide, July. Dekker, A. H. & Colbert, B. (2004), Network Robustness and Graph Topology, Proc. 27th Australasian Computer Science Conference, V. Estivill-Castro (Ed.), Dunedin, New Zealand. Conferences in Research and Practice in Information Technology, 26, 359–368. http://crpit.com/confpapers/CRPITV26Dekker.pdf Dickson, K. D. (2001), The Civil War for Dummies, IDG Books, Indianapolis. Dodge, M. (2004), An Atlas Of Cyberspaces, http://www.cybergeography.org/atlas/more_isp_maps.html, accessed 19 May. Faloutsos, M., Faloutsos, P. & Faloutsos, C. (1999), On Power-Law Relationships of the Internet Topology, ACM SIGCOM, Computer Communication Review, 29 (4). http://www.cs.cmu.edu/~christos/PUBLICATIONS/sigcomm99.ps.gz Farmer, D. (1997), The Oxford Dictionary of Saints, 4th edition, Oxford University Press. Gibbons, A. (1985), Algorithmic Graph Theory, Cambridge University Press. Holme, P., Kim, B. J., Yoon, C. N. & Han, S. K. (2002), Attack vulnerability of complex networks, Physical Review E, 65, 056109. http://arxiv.org/ftp/condmat/papers/0202/0202410.pdf
Complex2004
The 7th Asia-Pacific Conference on Complex Systems
Horne, G. E. (1997), Data Farming: A Meta-technique for Research on 21st Century Questions, briefing presented at the US Naval War College, Newport, Rhode Island, November. ICT: International Policy Institute for Counter-Terrorism (2004), International Terrorism Database, http://www.ict.org.il/, accessed 27 April. Jones, W. D. & Geppert, L. (2002), 9/11: One Year Later, IEEE Spectrum, September, 35–36. Krebs, V. E. (2002), Uncloaking Terrorist Networks, First Monday, 7 (4), April. http://www.firstmonday.dk/issues/issue7_4/krebs/ le Roy Ladurie, E. (1978), Montaillou, village occitan de 1294 à 1324, Editions Gallimard, Paris. Lustick, I. (2002), PS-I: A User-Friendly Agent-Based Modeling Platform for Testing Theories of Political Identity and Political Stability, Journal of Artificial Societies and Social Simulation, 5 (3), June. http://jasss.soc.surrey.ac.uk/5/3/7.html Motter, A. E. & Lai, Y.-C. (2002), Cascade-based attacks on complex networks, Physical Review E, 66, 065102. http://arxiv.org/PS_cache/cond-mat/pdf/0301/0301086.pdf Ormerod, P. & Roach, A. P. (2003), The Medieval Inquisition: Scale-free Networks and the Suppression of Heresy, arXiv.org Condensed Matter Archive, Paper 0306031, May. http://arxiv.org/ftp/cond-mat/papers/0306/0306031.pdf Pastor-Satorras, R. & Vespignani, A. (2001), Epidemic Spreading in Scale-Free Networks, Physical Review Letters, 86 (14), 3200–3203. http://arxiv.org/PS_cache/condmat/pdf/0010/0010317.pdf Raczynski, S. (2004), Simulation of The Dynamic Interactions Between Terror and AntiTerror Organizational Structures, Journal of Artificial Societies and Social Simulation, 7 (2), March. http://jasss.soc.surrey.ac.uk/7/2/8.html Sageman, M. (2003), Statement to the National Commission on Terrorist Attacks Upon the United States, July 9, http://www.9-11commission.gov/hearings/hearing3/witness_sageman.htm Sageman, M. (2004), Understanding Terror Networks, University of Pennsylvania Press. Srbljinović, A., Penzar, D., Rodik, P. & Kardov, K. (2002), Agent-Based Modeling of Ethnic Mobilization: The Former Yugoslavia Case, Paper presented to the first Lake Arrowhead Conference on Computational Social Science and Social Complexity, May. http://www.ffzg.hr/hsd/polemos/ModelingOfEthnicMob.pdf U.S.-Canada Power System Outage Task Force (2004), Final Report on the August 14, 2003 Blackout in the United States and Canada: Causes and Recommendations, April. https://reports.energy.gov/BlackoutFinal-Web.pdf Van Ooyen, M., Noe, N. & Lynn, J. (2002), Technology Lessons Learned From New York City’s Response To 9/11, Council of the City of New York Report, August. http://www.nyccouncil.info/pdf_files/reports/9_11techreport.pdf