Dec 9, 1997 - a software engineering environment for parallel applications [34,33]. ... execution with monitoring and load-balancing support, and testing and ...
An Experiment in Tool Integration: the DDBG Parallel and Distributed Debugger Jos´e C. Cunha a, Jo˜ao Lourenc¸o a , Tiago R. Ant˜ao a a Universidade
Nova de Lisboa, Faculdade de Ciˆencias e Tecnologia, Departamento de Inform´atica, 2825 Monte de Caparica, Portugal ( jcc, jml, tra) @ di.fct.unl.pt
Abstract This paper discusses the development of a debugging tool for parallel programs showing how the requirements posed by high-level tools for parallel program development have influenced the design of the debugging system since its early stages of development. We concentrate our attention upon the interfacing of the debugger with other tools of a parallel software engineering environment, namely a graphical programming language and a testing and debugging tool. This is illustrated with the results of our experimentation with the design and implementation of DDBG, a debugger for the PVM environment. Key words: Debugging, monitoring, parallel programming environments.
1 Introduction Our work is part of an ongoing European project which aims at the development of a software engineering environment for parallel applications [34,33]. This project concerns the design and implementation of visual programming components for graph-based design of parallel programs, mapping components for specific hardware target distributed-memory architectures, simulation support tools, real parallel execution with monitoring and load-balancing support, and testing and debugging tools. Integration means the provision of a suitable degree of consistency among the multiple views that are offered by the multiple tools in the environment. Specifically, consistency should apply to several aspects: multiple user interfaces, tool behavior, tool interaction, and tool composition. It is very difficult to support a completely coherent environment because this requires all the tools to be developed anew from the beginning of the project. This requirement conflicts with the constraints put both by the users, and the vendors of parallel computing platforms. Even if all the Preprint submitted to Elsevier Preprint
9 December 1997
tools in a programming environment could be jointly developed from the beginning, a successful integration is a difficult goal to achieve because it requires a collaborative effort involving experts from multiple domains including the users, the machine vendors, the computer experts, and the human computer interaction experts. The main goal of our project is to provide an integrated environment for program development centered on the graphical programming model of the GRAPNEL language [14,18,19]. This means that all of the above mentioned tools must refer to the abstractions that are defined by the graphical entities of the GRAPNEL model. Here we discuss design and implementation issues for one component of such parallel programming environment: the debugging tool called DDBG. In the following sections, we first identify some requirements for the design of the DDBG debugging tool. Then we discuss the interface library and the user interface offered by DDBG, as well as its internal architecture. Finally we discuss the interfacing of the DDBG debugging tool with high-level tools and languages, namely the GRAPNEL graphical editor [14,18], the STEPS testing tool [21], and the PVM-Prolog parallel logic programming system [28]. Finally we present some conclusions and an outline of our ongoing work.
2 Providing Basic Debugging Support to other Tools In this section we identify the requirements put upon a debugging tool based upon its interfacing with high-level tools. We also discuss the main requirements for the design of a portable, scalable, and adaptable architecture for a parallel and distributed debugger. 2.1 Requirements to Support Tool Integration The functionalities that are required in a parallel and distributed debugger are as follows:
� For individual processes, support must be provided for inspection and control commands that allow to observe and to modify the execution state of each application process; � For the distributed program, commands must be provided to monitor and control the execution of multiple processes as well as interprocess communications. Even if we have a parallel and distributed debugger with the above mentioned functionalities, we still have to address the more difficult issues of handling the nondeterministic and nonreproducible behavior of parallel and distributed programs, 2
as well as the intrusion effect due to the debugging system. Many proposals have been made in this regard for the past years [22,1,6,2,13,26,3,32]. Namely, the Instant Replay technique [22] was a significant contribution to allow efficient implementations of a facility for deterministic program re-execution. By forcing the same ordering of events as occurred during execution, the replay system gives a great help in the identification of program bugs. However, due to the large number of internal states that is (in a non-deterministic way) exhibited by a parallel program, it is very important that the programmer has also the possibility of specifying the parts of the program that should be put under test, such as a part of a process or a subset of processes. This requires a more flexible and expressive approach that is typically supported by a testing tool. Further expressiveness can be achieved through a well-designed integration between a testing tool and a debugging tool, as we explain in a section ahead. But this raises the problem of supporting easy integration of the debugger with other tools in a parallel software engineering environment. A well-defined debugging interface must be provided to be used by high-level tools, namely graphical editors, graphical interfaces, runtime support systems for distinct parallel and distributed language models, and testing and high-level debugging tools. Concerning such interface to high-level tools, the following aspects must be taken under consideration:
� A bidirectional interaction scheme supporting an aynchronous operation mode. � A mapping service of high-level process names onto low-level system process identifiers. � Access to information that is internally generated by the high-level language compilers, e.g. concerning program variables, and which must be passed to the debugging system. � A command line user interface giving access to all the debugging functionalities. � A graphical user interface that is consistent with the user views being offered by other tools in the environment. � Multiple simultaneous client connections should be supported by the debugging system so that multiple cooperating tools can be accessing the debugging environment for inspection and control of the distributed program execution. The first aspect concerns the fact that many user tools such as editors and graphical interfaces exhibit an event-driven behavior. If we provide a debugging interface through a library of primitives that are invoked by each high-level tool, such primitives must support non-blocking semantics because some debugging commands don’t provide an immediate answer. A communications interface must support the passing of the output information coming from such delayed debugging commands back to the user tool (e.g. a grahical editor). A simple solution to this problem is to provide a library function that allows the user tool to poll a communication channel that is associated to this interaction with the debugging system. Alternatively, 3
it would be better to provide a facility for the handling of asynchronous events by the user tool such that the invocation of a previously specified routine could be triggered by the arrival of the debugging information. The second aspect relates to the need of supporting high-level symbolic process identifiers at the user tool level, while typically the debugging tool is required to name processes using their system level identifiers. A solution to this problem requires the support of a process naming service. The third aspect requires the debugging interface to be able to access information concerning variable names in the distributed program. In order to provide this information, well-defined interfaces should be supported by the compiler writers so that access to such information is allowed without having to expose the compiler internals. This is one of the critical issues in current efforts towards parallel tool integration, and it is expected that the new generations of compilers will be able to offer such interfaces to low-level runtime debugging and performance monitoring tools. Finally, requirements concerning the support of user interfaces correspond to the recommendation of offering a command line console giving access to all the functionalities of the debugging interface library. Concerning the support of graphical user interfaces the consistency requirement should apply, as far as other tools in the environment are concerned.
2.2 Architecture of the Debugging Tool
A well-defined interface must be provided to the underlying operating system and hardware platform, assuring portability and adaptability of the debugging support architecture, while still allowing efficient implementation on top of each specific physical environment. However, the debugging commands supporting the inspection and control of the execution of each individual process are typically dependent upon the hardware/operating system platform as they must access very lowlevel representations of the information. However, the architecture of the debugging system has a distributed organization consisting of multiple monitor/debugger instances which are scattered on the nodes of a parallel and distributed platform. The goal is to design such architecture in such a way that it is amenable to be adapted to different machines, operating systems, and even to support different process-level debugging commands. This requires a distinction between what we call the process-level debugger and the distributed debugger. The process-level debugger is responsible for the actual application of the low-level state inspection and control commands to each individual application process. This may correspond to a proprietary machine-specific debugger or to a widely-used, 4
portable, and public debugger like the GNU gdb. The distributed debugger is responsible for the coordination of the actual operation of a collection of process-level debuggers associated with the distributed program. It interprets the user interface commands and forwards them (after possible conversions) to the process-levels debuggers. The main components of the distributed debugger architecture are the following ones:
� The main daemon (MD). It is responsible for the global interpretation of the commands of the debugging interface library. It acts as a master or coordinator of the other components in the architecture. � The local daemons (LD). Each local daemon is responsible for the local interpretation of the commands received from the MD. There is (at least) one LD on each node of the parallel platform that is responsible for the management of all interactions with the process-level debuggers which are local to that node. � The process-level debuggers (PD). This was explained above. We are assuming that for each application process under debugging there is one associated PD. Besides these main components there may be others, such as the ones supporting some of the requirements we have presented above. An example is given by a name server that supports the mentioned process name mapping. For simplicity we just discuss the basic components of the architecture. There are several alternative designs, depending on how the responsibilities are distributed among the MD and PD processes. A hierarchical or master-slave design lets the MD assume all interpretation of debugging commands, taking care of all necessary conversions, and forwarding the actual PD-level commands to the corresponding LD. In this solution, the LD processes are just slaves with very limited responsibility: just contacting the right PD and get their answer back to the MD. The MD does all the work. There are several disadvantages in this design:
� It makes the MD process very complex, mostly when it must also support multiple client connections and keep a lot of information concerning pending requests to the PD processes; � It makes it more difficult to support heterogeneous systems, i.e. consisting of distinct types of PD processes. This is actually an important issue related to heterogeneous distributed computing. One can have an application decomposed into multiple parts, each running on distinct sequential or parallel machines, with distinct PD processes. Assuming that the debugger user interface library is able to support such an environment, then it is not a good idea to have all necessary command and data interpretations be performed by the MD process. As an alternative, more flexible design, we propose to distribute the responsibility for actual command and data interpretation to each LD, and let the MD do only the 5
interfacing to the client tools. This allows each LD to perform the above mentioned tasks in an independent way, and according to the specific characteristics of each local PD. We argue this design is a better one to support heterogeneous debugging, as well as more easily adaptable. Indeed, the possible modifications are more localized into specific LD processes. The only possible functions left to the MD (besides interfacing with client tools) are the ones related to the presentation of global views to the user concerning the state of the distributed program. It is also responsible for the management of the multiple connections to the debugging system. An additional aspect of the design of the distributed debugger architecture concerns the communication interactions between its components:
� User tool - MD; � MD - LD; � LD - PD Ideally, one would like to use an uniform communication mechanism for all the above interactions, but typically one is faced with specific constraints and limitations due to the underlying operating system platforms.
2.3 Related Work
Only a few experiments have been made towards meeting the above goals, as well as to support integrated environments fully satisfying the above mentioned requirements. A component based approach is often used to alllow the interaction between distinct tools but usually there is no specific methodology or infrastructure to support tool composition using well-defined interfaces as tool building blocks. Exploitation of an object-oriented framework is very interesting in this regard. Recent research shows great concern in addressing tool integration issues, and a very good survey can be found in [30]. The development of computational steering environments has also been providing interesting lessons concerning tool integration [15]. A significant and very broad effort has recently been launched towards meeting the above mentioned goals [24] through a careful definition of interface libraries. We are currently pursuing a similar goal, as far as debugging support is concerned. In the following sections we will illustrate how we have faced the above mentioned problems when designing the interfaces of the GRAPNEL editor [18] and the STEPS testing tool [21] to our distributed debugging system DDBG [9,12]. A distinctive aspect of our work is that the development of the debugging tool was greatly influenced by its use and interfacing with the other mentioned software development tools. 6
3 The DDBG Parallel and Distributed Debugger
In this section we briefly describe the functionalities, architecture, and user interfaces which are currently supported by the DDBG distributed debugger. The DDBG system supports the debugging of parallel and distributed programs written in C using the PVM programming model. It has also been successfully interfaced with the graphical editor of the GRAPNEL programming system, and with the STEPS testing tool.
3.1 Functionalities
The debugging functionalities may be summarized as follows:
� Dynamic attachment and detachment of debugger instances to already running distributed processes; control of remote debugger instances from a central debugging user interface; � An interface library that gives access to such control of remote debuggers, and which can be used by high-level tools, like graphical editors, testing tools, and graphical user interfaces ; � An event trace is collected with minimal information to support program replay in PVM programs. This allows reproducible behavior and will make the debugging control commands available during a replay session; a checkpoint facility under replay mode will support execution replay from an intermediate point, instead of from the beginning of the program only. The program replay mechanism has already been implemented but it is currently in a testing stage. The checkpointing facility is still under development. The prototype runs on the PVM environment, and relies upon a well known debugger—the GNU gdb—to act as a process-level debugger, i.e. to provide conventional debugging commands within each sequential process.
3.2 Architecture
We have developed two prototypes that implement the debugger functionalities based on two different designs for the distributed debugger architecture, as discussed in the previous section. The first developed prototype is based on a hierarchical master-slave organization where the main daemon (MD) manages all the interactions with the client process, by forwarding the debugging commands to the machines where the application processes are placed, and gathering their corresponding answers. This is achieved by 7
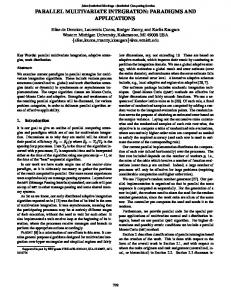
having a local daemon (LD) on each machine that is responsible for the activation and control of multiple debugger instances (PD), based on the GNU gdb, located in that machine. Each application process can be dynamically attached (detached) to (from) a distinct debugger instance. In this design, communication between the master and the local daemons is based on the PVM primitives. Communication between the master daemon and the user client process is based on UNIX sockets. Although in our current implementation we use UNIX domain sockets requiring the master daemon to run on the same machine as the user client process, this limitation can be removed by using UNIX Internet sockets instead. Communication between the local daemons and the debugger instances on each machine is currently based on UNIX pipes. The first distributed debugger architecture is illustrated in the figure 1. User Machine
Other Machines process
(main deamon) Central controller
User Tool debugging library debugging library Graphical Interface
debugger controller library
front-end (local deamon)
debugger
process
debugging library Other processes
front-end
debugger
process Request / Answer (immediate) Answer (delayed)
Fig. 1. The Distributed Debugger Architecture
The second prototype is based on the alternative distributed design that we have previously discussed. It pushes the responsibilities for the actual interpretation of the debugging commands to the local daemons. It also uses an architecture independent communication model to support the interactions between the master daemon and the local daemons. This model can be mapped onto different communication mechanisms such as TCP/IP sockets, PVM messages, UNIX pipes, etc.
3.3 Distributed Debugger Interface Library
Any user tool can access the DDBG system as a client process that uses an interface library to interact with the main debugging daemon. The interface library supports functions for the control of the DDBG system and for supporting the interfacing with other tools, and functions supporting distributed process control and state inspection. The latter type of functions are currently adapted from identical functions provided by the GNU gdb debugger, but they operate upon multiple distributed processes. A detailed definition of these functions is presented in [11,12]. 8
There are functions to support, respectively, the initialization and the cleanup of the debugging environment. The initialization also establishes a connection between each user tool and the main daemon, that is used for further interaction with DDBG. It also sets up an interprocess communication channel that is used for the passing of delayed output information between the DDBG and the user tool. This channel can be inspected by invoking another interface function with a non-blocking semantics, corresponding to a design requirement that was discussed in a previous section. An user application or tool may use specific Process ID’s (strings) to identify the processes. In order to support the mapping between the user processes symbolic names and the PVM task names, a name mapping function is provided allowing to associate a tid, a PVM task identifier, to a given process identifier. This allows any of the library primitives, as well as the corresponding user consoles, to refer to string process identifiers, besides PVM task ID’s (integers). This solution currently solves the name mapping problem and it is used by the current interface of the GRAPNEL and DDBG (described in a section ahead). There are also functions supporting the dynamic attachment and detachment of application processes to new debugger instances, as well as to obtain information about new components (e.g. newly spawned application processes) in the debugging environment. The functions for distributed process control and state inspection include support for debugging commands that control the execution of each individual process in a detailed way, including step by step execution, handling breakpoints and watchpoints, and displaying or modifying local process information (variables, status, stack frames, current breakpoints).
3.4 DDBG User Interfaces
Currently DDBG supports a command line console that gives access to all the interface library functions. Additionally it is possible to interface any kind of graphical user interface to the main daemon of the DDBG system. The current prototype provides an X-based window interface that allows the interactive display of process variables. Although this is still in development, we illustrated it on the figure 2. This interface requires the user to select the processes of interest in the main window provided by the interface. An individual window is then provided for each selected process so that the user can individually select the names of the variables that should be displayed. 9
Fig. 2. The DDBG User Interfaces
4 Tool Composition Using the DDBG Debugger
In this section we briefly discuss our experimentation with the interfacing of the DDBG system and two high-level tools of a parallel software engineering environment: the STEPS and the GRAPNEL tools. More detailed descriptions of these tools and interfaces is given in [21,14,18–20,9,23].
4.1 Tool Composition for Testing and Debugging
In our project we have given great consideration to the search of a close integration of static analysis and dynamic analysis methods in order to guarantee the final quality of the parallel software. The development of a methodology and tool to aid the user in the process of identifying the execution paths which should be generated and tested, is a key component of an advanced testing and debugging environment. This aspect has been investigated within the scope of the mentioned project [34,21], by our partners of the Technical University of Gdansk that have independently developed a testing tool called STEPS that generates selected execution scenarios for a given parallel (C/PVM) program. The description of STEPS is beyond the scope of this paper but their authors have reached a very successful trade-off between the systematic testing tool (that should generate all possible execution paths) and the degree of supported user interaction that allows the user to direct the tools towards interesting program parts. After the generation of a testing scenario by the 10
STEPS tool, and through a suitable integration with the debugger, it is possible to submit to an user controlled execution of the paths under test, allowing the user to inspect program behavior at the desired level of abstraction and with the guarantee of the reproducibility of its execution. The user is allowed to run a complete test scenario until the end or alternatively it is possible to follow a step by step execution controlled by breakpoints. This is achieved by converting the information associated to the specification of each testing scenario onto corresponding information and commands known to the DDBG debugger. Such conversion is easily implemented as an interface component between the STEPS and DDBG tools, i.e. no new debugging commands need to be implemented, and for this matter a lowlevel instant reply facility is not necessary at the DDBG level. This illustrates an interesting characteristic of tool composition that should be a goal in an integrated environment. Given two distinct tools, each with its own functionality, we obtain a new functionality as a result of their integration. Moreover this is achieved with no change to each tool, by just developing an interfacing component, as illustrated on the DDBG figure presented above.
4.2 Interfacing DDBG to a Graphical Editor
The GRAPNEL model, a graph-based parallel programming language [14,18], supports a structured style for designing parallel applications. In an integrated development environment there is a requirement that the debugging commands and output information must be directly related to the GRAPNEL model such that only GRAPNEL abstractions should be handled by the user at this level. This requires a high-level interface to the user, such that the information on specific debugging commands is directly related to the GRAPNEL source program, e.g. by highlighting corresponding entities in the graphical representation, and their corresponding lines of source code in the textual program representation. The GRAPNEL system is supported by a compiler that generates C code plus PVM calls to support parallel program execution. It also includes a graphical editor called GRED [14,18]. For each debugging action at the GRAPNEL editor, corresponding DDBG primitives are invoked, and process names are converted as previously explained. The GRAPNEL editor, and its current implementation relies upon a TCP/IP socketbased communication protocol to interact with the DDBG system, but this is hidden in the interface library functions that send commands to the debugger. Also, delayed debugging information is passed back to GRAPNEL through a socket that is polled by the editor, in an event-driven mode, and using an interface library function to get that information. 11
4.3 Interfacing DDBG to a High-level Programming Language
Currently, the DDBG system is being used to develop a distributed debugger for PVM-Prolog [28], an extension to Prolog [7] that provides full access to the PVM environment. The process-level debuggers (gdb) will be replaced with Prolog processlevel debuggers for Prolog, and the interfacing between the local daemons and these debuggers will be adapted accordingly. As this requires a specific interpretation of the PVM-Prolog level debugging commands this is a good test to evaluate the benefits from the distributed design of the debugging system that we have previously discussed.
5 Conclusions
We have shown how a distributed debugger has been designed under the influence of specific interfacing requirements posed by high-level parallel software development tools. There is already a working prototype that has been used to support integration with the GRAPNEL and the STEPS tools. The DDBG is currently under further development concerning a more flexible distributed architecture that should more completely support the requirements for tool integration. Ongoing work concerns the improvement of the existing DDBG architecture, and the development of a MPI-based version, as well as its extension with performance monitoring functionalities. Its evaluation is being made by real users both on our undergraduate and master student projects, and on ongoing projects that use the PVM system for applications in environmental sciences involving researchers in other departments of our university. This will hopefully provide us with users’ feedback to improve this tool.
Acknowledgments
This work was partially supported by the CEE COPERNICUS Programme, SEPP Project (Contract CIPA-C193-0251) and HPCTI Project (Contract CP-93-5383), by the Portuguese CIENCIA Programme.
References
[1] ACM Workshop on Parallel and Distributed Debugging. ACM SIGPLAN Notices 24, 1 (1988).
12
[2] ACM/ONR Workshop on Parallel and Distributed Debugging. Notices 26, 12 (1991).
ACM SIGPLAN
[3] ACM/ONR Workshop on Parallel and Distributed Debugging. Notices 28, 12 (1993).
ACM SIGPLAN
[4] A, Beguelin, J.J. Dongarra, G.A. Geist, R. Manchek, V.S. Sunderam. A User’s Guide to PVM Parallel Virtual Machine. Technical Report, ORNL/TM-118266, Oak Ridge National Laboratory, USA, 1991. [5] A, Beguelin, J.J. Dongarra, G.A. Geist, V.S. Sunderam. Visualization and Debugging in a Heterogeneous Environment. IEEE Computer 26, 6 (1993). [6] W. Cheung, J. Black, E. Manning. A framework for distributed debugging. IEEE Software, Jan. (1990). [7] W.F. Clocksin, C.C. Mellish. Programming in Prolog. (Springer, 1981). [8] J.C. Cunha, H. Krawczyk, B. Wiszniewski, P. Mork, P. Kacsuk, E. Luque, L. Sutovska, L. Hluchy. Monitoring and Debugging Distributed Memory Systems. in: Proc. uP’94: The Eight Symposium on Microcomputer and Microprocessor Applications (Budapest, Hungary, 1994). [9] J.C. Cunha, J. Lourenc¸o, T. Ant˜ao. Integrating a debugging engine to the GRAPNEL environment. HPCTI Project, COPERNICUS Programme, 3rd Progress Report, University of Westminster, London, UK, 1996. [10] J.C. Cunha. Design of Parallel and Distributed Monitoring and Debugging Sy stems. SEPP Project, COPERNICUS Programme, 4th Progress Report, University of Westminster, London, UK, 1996. [11] J.C. Cunha, J. Lourenc¸o, T. Ant˜ao. A Debugging Engine for a Parallel and Distributed Environment. in: Proc. DAPSYS’96, Austrian-Hungarian Workshop on Distributed and Parallel Systems (Miskolc, Hungary, 1996). [12] J.C. Cunha, J. Lourenc¸o, T. Ant˜ao. DDBG: A Distributed Debugger – User’s Guide. Technical Report, Departamento de Inform´atica, FCT-Universidade Nova de Lisboa, Portugal, 1996. [13] P.S. Dodd, C.V. Ravishankar. Monitoring and debugging distributed real-time programs. Software—Practice and Experience 22, 10 (1992). [14] G. D´ozsa, T. Fadgyas, P. Kacsuk GRAPNEL: A Graphical Programming Language for Parallel Programs in: Proc. uP’94: The Eight Symposium on Microcomputer and Microprocessor Applications (Budapest, Hungary, 1994). [15] G. Eisenhauer, W. Gu, K. Schwan, N. Mallavarupu. Falcon – Toward Interactive Parallel Programs: the Online Steering of a Molecular Dynamic Program. in: Proc. 3rd International Symp. on High-Performance Distributed Computing (1994). [16] A. Fagot, J, Chassin-de-Kergommeaux. Optimized execution replay mechanism for RPC-based parallel pr ogramming models. Technical Report, IMAG, Grenoble, France, 1995.
13
[17] C. Fidge. Partial orders for parallel debugging. in: ACM Workshop on Parallel and Distributed Debugging, ACM SIGPLAN Notices 24, 1 (1988). [18] P. Kacsuk, G. D´ozsa, T. Fadgyas. GRAPNEL: A Graphical Parallel Programming Language. Journal of Systems Architecture, Special Issue on Parallel Software Engineering, 1 (1996). [19] P. Kacsuk, G. D´ozsa, T. Fadgyas. Development of Graphical Parallel Programs in PVM Environments. in: Proc. Austrian-Hungarian Workshop on Distributed and Parallel Systems - DAPSYS’96 (Miskolc, Hungary, 1996). [20] P. Kacsuk, J.C. Cunha, G. D´ozsa, J. Lourenc¸o, T. Fadgyas, T. Ant˜ao. A Graphical Development and Debugging Environment for Parallel Programs. Parallel Computing (1997). [21] H. Krawczyk, B. Wiszniewski Structural Testing of Parallel Software in STEPS in: Proc. 1st SEIHPC Workshop, COPERNICUS Programme (Braga, Portugal, 1996). [22] T.J. LeBlanc, J-M. Mellor-Crummey. Debugging parallel programs with instant replay. IEEE Trans. on Computers C-36, 4 (1987). [23] J. Lourenc¸o, J.C. Cunha, Universidade Nova de Lisboa, and H. Krawczyk, P. Kuzora, M. Neyman, B. Wiszniewsk, Technical University of Gdansk. An Integrated Testing and Debugging Environment for Parallel and Distributed Programs. in: Proc. 23rd EUROMICRO Conference (Budapest, Hungary, 1997). [24] T. Ludwig, R. Wismuller, V. Sunderam, A. Bode. OMIS — on-line monitoring interface specification. LRR-TUM, Technical Univ. of Munich, Germany, and Emory Univ. USA, 1996. [25] M. Mackey. Program replay in PVM. Hewlett-Packard, Concurrent Computing Department, H.P. Laboratories, 1993. [26] Y. Manabe, M. Imase. Global conditions in debugging distributed programs. J. of Parallel and Distributed Computing 15 (1992). [27] D.C. Marinescu, J.E. Lumpp, Jr., T.L. Casavant, H.J. Spiegel. Models for monitoring and debugging tools for paralell and dis tributed software. J. of Parallel and Distributed Computing 9 (1990). [28] R. Marques, J.C. Cunha. PVM-Prolog: Parallel Logic Programming in the PVM System. in: Proc. 1995 PVM User’s Group Meeting (Pittsburgh, USA, 1995). [29] C.E. McDowell, D.P. Helmbold. Debugging concurrent programs. ACM Computing Surveys 21, 4 (1989). [30] M.L. Simmons, A.H. Hayes, D.A. Reed, J. Brown, editors. Debugging and Performance Tuning for Parallel Computing Systems. IEEE Computer Science Press (1995). [31] J. Tsai, K. Fang, H, Chen, Y. Bi. A noninterference monitor and replay mechanism for realtime software testing and debugging IEEE Trans. on Software Engineering 16, 8 (1990).
14
[32] J.J-P., Tsai, S.J.H. Yang, editors. Monitoring and debugging of distributed real-time systems. IEEE Computing Society Press (1995). [33] S. Winter,P. Kacsuk. Software Engineering for Parallel Processing. in: Proc. 8th Symp. on Microcomputer and Microprocessor Applications (Budapest, Hungary, 1994). [34] S. Winter, P. Kacsuk, editors. Software Engineering for Parallel Processing. Copernicus Programme, Contract CIPA-C193-0251, Progress Report no. 1, , University of Westminster, London, UK, 1994.
15