Hindawi Publishing Corporation Chinese Journal of Engineering Volume 2016, Article ID 9714381, 7 pages http://dx.doi.org/10.1155/2016/9714381
Research Article An Experimental and Numerical Study on Embedded Rebar Diameter in Concrete Using Ground Penetrating Radar Md Istiaque Hasan and Nur Yazdani Department of Civil Engineering, University of Texas at Arlington, P.O. Box 19308, Arlington, TX 76019, USA Correspondence should be addressed to Md Istiaque Hasan;
[email protected] Received 1 March 2016; Revised 23 June 2016; Accepted 21 July 2016 Academic Editor: Pierre-yves Manach Copyright © 2016 M. I. Hasan and N. Yazdani. This is an open access article distributed under the Creative Commons Attribution License, which permits unrestricted use, distribution, and reproduction in any medium, provided the original work is properly cited. High frequency ground penetrating radar (GPR) has been widely used to detect and locate rebars in concrete. In this paper, a method of estimating the diameter of steel rebars in concrete with GPR is investigated. The relationship between the maximum normalized positive GPR amplitude from embedded rebars and the rebar diameter was established. Concrete samples with rebars of different diameters were cast and the maximum normalized amplitudes were recorded using a 2.6 GHz GPR antenna. Numerical models using GPRMAX software were developed and verified with the experimental data. The numerical models were then used to investigate the effect of dielectric constant of concrete and concrete cover on the maximum normalized amplitude. The results showed that there is an approximate linear relationship between the rebar diameter and the maximum GPR normalized amplitude. The developed models can be conveniently used to estimate the embedded rebar diameters in existing concrete with GPR scanning; if the concrete is homogeneous, the cover depth is known and the concrete dielectric constant is also known. The models will be highly beneficial in forensic investigations of existing concrete structures with unknown rebar sizes and locations.
1. Introduction As a nondestructive evaluation tool, ground penetrating radar (GPR) has been used for subsurface imaging of soil, pavement, and concrete and in many other fields. Use of GPR in concrete evaluation was started in early 1990s. GPR has been used to find concrete cover and thickness of bridge decks [1, 2]. GPR has also been widely used for bridge deck deterioration mapping with high degree of success [3, 4]. The uses of GPR in evaluating the thickness of concrete and asphalt pavement and detection of voids in pavements are also reported [5–7]. Several past studies have explored the extraction of additional information about the rebar embedded in concrete, such as the diameter of the rebar. Normally GPR responses from any cylindrical target are hyperbolic in shape. Therefore, a GPR scan does not provide direct information about the diameter of the target. If quantitative information about the rebar, such as diameter, can be retrieved from a GPR scan, it will be an excellent addition to the existing usage of a GPR. Rebar diameter is an important parameter in determining the various strength, safety, and serviceability properties of concrete structures. In forensic evaluation of concrete
structures, the embedded rebar size may not be known because as-built drawings could be absent or nonreliable. In these situations, destructive techniques are normally used to determine the embedded rebar diameter. Determination of such diameters with nondestructive techniques such as GPR scan can be a very useful process. The ability of GPR to scan large distances in a short time period could be conveniently employed in rebar diameter estimation. The hyperbola that results from the GPR trace of a rebar embedded in concrete can be represented by mathematical models. A study on hyperbola curve fitting demonstrated a mathematical model that can predict the diameter from the equation of the hyperbola [8]. Another empirical study proposed a physical model of rebar scanning embedded in concrete with a GPR antenna [9]. A study on Radar Cross Section (RCS) of the cylindrical rebar in concrete showed that the ratio of RCS in copolar and cross polar direction was related to the rebar diameter [10]. Another study used the ratio of the amplitudes obtained from two different antenna orientations to predict the diameter of the rebar in concrete [11]. None of the aforementioned methods were simple or accurate enough to predict the diameter of the rebar. Another study used 2 GHz
2
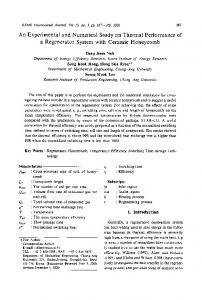
Chinese Journal of Engineering 1 in. 2 in. 15 in.
3 in. 15 in.
6 in.
54 in. Note: 1 in. = 25 mm
Figure 1: Schematic diagram of the concrete block sample.
(a) GPR and antenna
(b) Rebars
Figure 2: GPR equipment and rebars.
and 4 GHz GPR antennae and found the correlation between the rebar diameter and the maximum amplitude from rebar with two different antenna orientations [12]. It was shown that the maximum amplitude increased with the increase of rebar diameter for both numerical and experimental data. Although this method [12] was relatively simple and easy to follow, it did not address the effect of changing concrete properties and the numerical model was not verified with experimental work. The maximum amplitude of GPR signal from the rebar is a parameter that can be easily and quickly retrieved from the GPR scans. An approach to correlate the GPR maximum amplitude with rebar diameter in concrete will, therefore, be a very useful tool. In this study, the diameter of the embedded rebar in concrete was correlated with the maximum possible normalized amplitude from a GPR scan.
2. Experimental Setup Six experimental concrete blocks were constructed herein using normal weight concrete with a water cement ratio of 0.40 and a maximum aggregate size of 3/4 in. (19 mm) with a target 28-day compressive strength of 4000 psi (27.5 MPa). All beams were cast at the same time to ensure homogenous dielectric constant in all the six samples. Dielectric constant is an electromagnetic property of a material which controls the propagation of radar waves through the materials. The beam dimensions were 54 in. (1370 mm) long, 10 in. (250 mm) wide, and 6 in. (150 mm) deep. Three different concrete covers were used [1 in. (25 mm), 2 in. (50 mm), and 3 in. (75 mm)] in the blocks to see the variation of GPR response with the depth of rebar in concrete. A schematic diagram of the concrete block sample is shown in Figure 1.
Six different rebar sizes were used herein: #3, #4, #5, #6, #8, and #11, to cover a wide range of rebar sizes. The corresponding diameters were 0.375 in. (9.5 mm), 0.5 in. (12.6 mm), 0.625 in. (15.9 mm), 0.75 in. (19 mm), 1 in. (25.4 mm), and 1.375 in. (35 mm), respectively. A commer cially available GPR equipment item from a US manufacturer was utilized in this study. The GPR equipment consists of a mainframe radar wave generator, a hand cart with antenna mount and calibrated wheels, and a high frequency antenna. The GPR scan can be performed and the scan results can be seen in real time. The GPR antenna was a ground coupled 2.6 GHz type [13], which has one of the highest frequencies among the commercially available GPR antennas. The wavelength of the antenna in regular concrete (dielectric constant 6.5) at nominal frequency (2.6 GHz) is 1.8 in. (46 mm). The 2.6 GHz antenna can differentiate depths with an accuracy of ±0.25 in. (6.35 mm) and it can differentiate horizontal targets as long as they are at least 2 in. (50 mm) apart [14]. The depth resolution of this antenna is up to 12 in. (305 mm) according to manufacturer specifications. The GPR system with the antenna and the different rebar sizes used in the experiment are shown in Figure 2.
3. GPR Scan and Data Processing GPR scans were taken from each of the six concrete blocks using the 2.6 GHz antenna. Figure 3 shows a data collection run from a specimen. The antenna was ground coupled (antenna in contact with scan surface) with the surface of the concrete samples and the axis of the antenna perpendicular to the target rebar.
Chinese Journal of Engineering
Figure 3: GPR data collection.
The GPR B-Scan (two-dimensional GPR scan) from the six block specimens having six different rebar sizes is shown in Figure 4. From the two-dimensional B-Scans, it is apparent that the brightness of the hyperbola is increasing with the increasing in the rebar diameter. The location of the three different hyperbolas in a particular scan indicates three different concrete covers. The brightness of the hyperbolas is also increasing with the decreasing cover depth. But any change in the shape of the hyperbola is not detectable either with the change of cover depth or with the change of rebar diameter. Therefore, any direct estimation of rebar size is not possible from the shape of the hyperbola. The only visible change in the hyperbola is the brightness which is a function of the reflection amplitude from rebars. So, it is evident that the amplitude of the reflected signal has a relationship with the size of the target rebar. The tip of the hyperbola is the brightest and the amplitude of GPR signal is highest at this point. The brightness of the antenna diminishes along the tail of the hyperbola. The tip of the hyperbola is formed when the GPR antenna is located directly at the top of the rebar and the distance between the transmitter and receiver of the antenna and the rebar is smallest. The amplitude of this unique position of the antenna possesses information about the rebar. The amplitude of this position is a function of the rebar size. In this research, the maximum normalized amplitude when the rebar was directly under the GPR antenna was measured for each rebar. To perform these steps, the raw GPR data had to be smoothened by removing background noise. Application of background removal to a GPR scan removes any horizontal band of noise from the data.
4. Numerical Modeling The GPR scan data was transported into the GPR postprocessing software [15]. Background removal filter was applied to the raw data to get rid of the direct coupling part of the signals. Figure 5 shows a signal before and after the application of the background removal filter. After the filter application, the maximum positive amplitudes from the rebars were recorded using the postprocessor in absolute data units. Figure 6 shows the amplitude versus diameter plot for various rebar diameters at 2 in. (50 mm) concrete cover. In order to establish the type of relationship between GPR maximum amplitude and rebar diameter, a numerical model of the experimental setup was developed using GPRMAX [16]. This program uses finite difference time
3 domain (FDTD) method to solve electromagnetic numerical problems. The GPRMAX model gives the output signal as a one-dimensional A-Scan (amplitude versus time of a single GPR scan) in ASCI format. The output can be plotted in amplitude versus two-way travel time plot. Normally the amplitudes from the numerical models are higher than the experimental study because of the varieties of losses associated with an actual GPR scan. In the numerical simulation, the location of the antenna was adjusted in such a way that the normalized amplitudes from the numerical model were as close as possible to the experimental normalized amplitudes. The normalization process of the modeling output was done by dividing the output signal amplitudes with the maximum absolute amplitude of the same signal. The normalization process was necessary so that the experimental data and the numerical data could be compared. The absolute amplitudes from the GPR antenna and the absolute amplitudes from the numerical simulations have been presented in two different data units. The normalization process eliminated the effect of data units in the GPR scan. From the GPRMAX output, the amplitude and rebar diameter data are shown in Figure 7. It is clear that the maximum amplitude increases with the increase in rebar diameter, confirming the trend of the experimental results. Depending on the composition of the materials in concrete, the dielectric constant varies. The maximum normalized amplitude from rebars of the same diameter may show different values as the dielectric constant of the concrete changes. To investigate the effect of dielectric constant of concrete on the GPR amplitude response, three different numerical models were developed having three different dielectric properties [7, 10, 13] and the same rebar diameter of 0.5 in. (12.6 mm). The dielectric constant of mature concrete is around 3 to 12 [14] and it may increase or decrease based mainly on the amount of moisture present in concrete. The average dielectric constant of concrete in the experimental samples was 7. The travel time to the peak amplitude increased with dielectric constant, but the normalized amplitude did not change significantly with the change of dielectric constant, as shown in Figure 8. So, it can be concluded that the relation between maximum normalized GPR amplitudes and rebar diameters remains the same for different types of concrete.
5. Results The maximum normalized amplitudes from the numerical model and the experimental data are listed in Table 1. The maximum normalized amplitudes from the experimental models are larger by 2.96–12.32% of the numerical values except for larger diameters where amplitudes are greater by 2.96%. Figure 9 presents the maximum normalized amplitudes versus diameter plot for numerical and experimental models. The numerical model of the maximum normalized amplitudes showed a correlation coefficient of 0.99 which indicates that the relationship between the maximum amplitude and the diameter is linear. The trend line of both numerical and experimental data showed a maximum 5.81%
4
Chinese Journal of Engineering
5.0
(in.) 10.0 15.0 20.0 25.0 30.0 35.0 40.0 45.0
0.0
2.5
2.5
5.0
5.0 (in.)
(in.)
0.0
0.0
7.5
5.0
(in.) 10.0 15.0 20.0 25.0 30.0 35.0 40.0 45.0
7.5
10.0
10.0
12.5
12.5
15.0
0.0
15.0
Note: 1 in. = 25 mm
Note: 1 in. = 25 mm
(a) #3 (10 mm) rebar (in.) 5.0 10.0 15.0 20.0 25.0 30.0 35.0 40.0 45.0
0.0
0.0
2.5
2.5
5.0
5.0 (in.)
(in.)
0.0
(b) #4 (12 mm) rebar
7.5
5.0
10.0
12.5
12.5
10.0
15.0
30.0
35.0
0.0
40.0
0.0
0.0
2.5
2.5
5.0
5.0
7.5
35.0
40.0
10.0
12.5
12.5 Note: 1 in. = 25 mm
(e) #8 (25 mm) rebar
5.0
10.0
15.0
(in.) 20.0 25.0
30.0
35.0
40.0
7.5
10.0
15.0
30.0
(d) #6 (19 mm) rebar
(in.)
(in.)
5.0
(in.) 20.0 25.0
Note: 1 in. = 25 mm
(c) #5 (16 mm) rebar
0.0
15.0
15.0
Note: 1 in. = 25 mm
(in.) 20.0 25.0
10.0
7.5
10.0
15.0
0.0
15.0
Note: 1 in. = 25 mm
(f) #11 (35 mm) rebar
Figure 4: GPR B-Scans for various rebar diameters.
difference. So, it can be concluded that the numerical model is representative of the experimental setup. The regression line from the experimental data can be used as a tool for estimating the diameter of the rebar. The correlation coefficient for the experimental data is 0.93 which indicates linear relationship between normalized amplitude and rebar size as observed from the numerical data. If the
maximum normalized amplitude from a rebar is 𝑌 and the diameter of the rebar is 𝑋, then, for a known concrete cover (2 in. or 50 mm in this case), the diameter can be found from the following equation: 𝑋=
𝑌 − 0.0966 . 0.1602
(1)
Chinese Journal of Engineering
5 (ft) 1.9
2.0
0.00
−1.0
0.0
1.0
1.00
(ns)
2.00
Direct coupling
3.00
Rebar reflection
4.00 5.00 6.00 7.00 (a) Before background removal
(ft) 1.9
−1.0
0.0
1.0
0.0 2.5
(in.)
5.0 7.5 10.0 12.5 15.0 (b) After background removal
Amplitude
Figure 5: Background removal of raw data using postprocessing.
12000
factor that attenuates the signal. The findings of this study can be listed as follows:
8000
(i) The maximum normalized amplitude from the rebar is taken as the variable to determine the rebar diameter. The maximum normalized amplitude from the rebar increased with the size of the rebar.
4000
0 0
0.25
0.5
0.75
1
1.25
1.5
Diameter (in.) Note: 1 in. = 25 mm
Figure 6: Amplitude versus rebar diameter at 2 in. (50 mm) depth.
6. Conclusions In this study, a correlation between maximum normalized positive amplitude from the rebar and the diameter of the rebar embedded in concrete is established. The major assumption in this study is that the concrete is not very lossy or in good condition and the dielectric permittivity is the only
(ii) The diameters from real concrete sample and the numerical model were accurate within 12% error. Numerical model also suggested that the maximum normalized amplitudes do not change with the change of the dielectric constant of the medium. So, the correlation equation can be used for any type of concrete as long as the concrete is new and the effect of conductivity is very low or negligible. The accuracy of estimating diameter in this study depends on the homogeneity of concrete and on the accurate measurement of cover depth. Nonhomogenous concrete will create noise in the signal and any error in estimating cover depth would reflect on the accuracy of the proposed method. The spatial variability of concrete covers and concrete properties in a structure are the factors that need to be incorporated
6
Chinese Journal of Engineering Table 1: Maximum numerical and experimental normalized amplitudes.
Rebar size Diameter (in.) #3 #4 #5 #6 #8 # 11
0.375 0.5 0.625 0.75 1.0 1.375
GPRMAX normalized amplitude
GPRMAX normalized amplitude (decibel)
Experimental normalized amplitude
Experimental normalized amplitude (decibel)
% of decibel change
0.1335 0.15332 0.1714 0.19607 0.23741 0.30972
−17.4904 −16.2878 −15.3198 −14.1518 −12.49 −10.1808
0.149108 0.161808 0.201372 0.231473 0.277971 0.298882
−16.53 −15.82 −13.92 −12.71 −11.12 −10.49
5.81 2.96 10.06 11.34 12.32 2.95
Note: 1 in. = 25 mm.
−0.40
0.35
Normalized amplitudes
−0.20
Increasing amplitudes with increasing diameter
−0.10
2.0
2.5
Time (nS) 3.0
3.5
4.0
0.00
Normalized amplitude
0.3
−0.30
0.25 0.2 0.15 0.1 0.05
0.10
0 0
0.25
0.5
0.20 #3 rebar #4 rebar #5 rebar
1
1.25
1.5
Note: 1 in. = 25 mm GPRMAX data Experimental GPR data
#6 rebar #8 rebar #11 rebar
Figure 7: Normalized amplitude versus travel time from numerical model.
Figure 9: Best fit lines between numerical and experimental results.
in the model. Moreover, the attenuation of the GPR signal is not considered due to electrical conductivity of concrete and backscattering from aggregates and cracks. These issues need to be resolved in order to make the method, proposed herein, practice ready.
1
0.5 Normalized amplitude
0.75 Diameter (in.)
Competing Interests
0 0.0
1.0
2.0
3.0 4.0 Time (nS)
5.0
6.0
7.0
−0.5
−1
The authors of this work hereby declare that this work is originally performed by them and there is no conflict of interests with any other parties.
References
−1.5
Dielectric constant = 7 Dielectric constant = 10 Dielectric constant = 13
Figure 8: GPR A-Scan for three different concrete dielectric constants.
[1] I. Hasan and N. Yazdani, “Investigation of inadequate concrete covers in a new bridge deck using ground penetrating radar,” in Proceedings of the Transportation Research Board 93rd Annual Meeting, No. 14-4191, Transportation Research Board of the National Academies, Washington, DC, USA, January 2014. [2] J. Hugenschmidt, “Concrete bridge inspection with a mobile GPR system,” Construction and Building Materials, vol. 16, no. 3, pp. 147–154, 2002.
Chinese Journal of Engineering [3] N. Gacunski, C. Rascoe, R. Parrillo, and R. L. Roberts, “Complimentary condition assessment of bridge decks by high frequency ground penetrating radar and impact echo,” in Transportation Research Board 93rd Annual Meeting (No. 09-1282), Transportation Research Board of the National Academies, Washington, DC, USA, 2009. [4] R. Parrillo, R. L. Roberts, and A. Haggan, “Bridge deck condition assessment using ground penetrating radar,” in Proceedings of the International Bridge Conference, Pittsburgh, Pa, USA, June 2005. [5] R. Liu, J. Li, X. Chen, and H. Xing, “GPR system user guide and troubleshooting guide,” Tech. Rep. FHWA/TX-06/5-4414-01-1, FHWA, U.S. Department of Transportation, 2004. [6] R. Liu, J. Li, X. Chen, H. Xing, and R. Liang, “A nondestructive device for measuring the thickness of concrete pavement,” Tech. Rep. FHWA/TX-04/0-4414-2, US Department of Transportation, Washington, DC, USA, 2002. [7] J. M. Conner, D. G. Pollock, and B. Khaleghi, “Detection of simulated voids in grouted ducts using groundpenetrating radar,” in Proceedings of the HPC: Build Fast, Build to Last. The 2006 Concrete Bridge Conference, Reno, Nev, USA, May 2006. [8] S. Shihab and W. Al-Nuaimy, “Radius estimation for cylindrical objects detected by ground penetrating radar,” Subsurface Sensing Technologies and Applications, vol. 6, no. 2, pp. 151–166, 2005. [9] C. W. Chang, C. H. Lin, and H. S. Lien, “Measurement radius of reinforcing steel bar in concrete using digital image GPR,” Construction and Building Materials, vol. 23, no. 2, pp. 1057– 1063, 2009. [10] L. Zanzi and D. Arosio, “Sensitivity and accuracy in rebar diameter measurements from dual-polarized GPR data,” Construction and Building Materials, vol. 48, pp. 1293–1301, 2013. [11] G. Leucci, “Ground penetrating radar: an application to estimate volumetric water content and reinforced bar diameter in concrete structures,” Journal of Advanced Concrete Technology, vol. 10, no. 12, pp. 411–422, 2012. [12] V. Utsi and E. Utsi, “Measurement of reinforcement bar depths and diameters in concrete,” in Proceedings of the 10th International Conference on IEEE Ground Penetrating Radar (GPR ’04), pp. 659–662, Delft, The Netherlands, June 2004. [13] Geophysical Survey Systems Inc., Salem, NH, USA, 2011. [14] GSSI Concrete Handbook, Geophysical Survey Systems (GSSI), Salem, NH, USA, 2015. [15] RADAN 7 [Computer Software], Geophysical Survey Systems (GSSI), Salem, NH, USA, 2014. [16] A. Giannopoulos, “GprMax2D/3D,” http://www.gprmax.com.
7
International Journal of
Rotating Machinery
Engineering Journal of
Hindawi Publishing Corporation http://www.hindawi.com
Volume 2014
The Scientific World Journal Hindawi Publishing Corporation http://www.hindawi.com
Volume 2014
International Journal of
Distributed Sensor Networks
Journal of
Sensors Hindawi Publishing Corporation http://www.hindawi.com
Volume 2014
Hindawi Publishing Corporation http://www.hindawi.com
Volume 2014
Hindawi Publishing Corporation http://www.hindawi.com
Volume 2014
Journal of
Control Science and Engineering
Advances in
Civil Engineering Hindawi Publishing Corporation http://www.hindawi.com
Hindawi Publishing Corporation http://www.hindawi.com
Volume 2014
Volume 2014
Submit your manuscripts at http://www.hindawi.com Journal of
Journal of
Electrical and Computer Engineering
Robotics Hindawi Publishing Corporation http://www.hindawi.com
Hindawi Publishing Corporation http://www.hindawi.com
Volume 2014
Volume 2014
VLSI Design Advances in OptoElectronics
International Journal of
Navigation and Observation Hindawi Publishing Corporation http://www.hindawi.com
Volume 2014
Hindawi Publishing Corporation http://www.hindawi.com
Hindawi Publishing Corporation http://www.hindawi.com
Chemical Engineering Hindawi Publishing Corporation http://www.hindawi.com
Volume 2014
Volume 2014
Active and Passive Electronic Components
Antennas and Propagation Hindawi Publishing Corporation http://www.hindawi.com
Aerospace Engineering
Hindawi Publishing Corporation http://www.hindawi.com
Volume 2014
Hindawi Publishing Corporation http://www.hindawi.com
Volume 2014
Volume 2014
International Journal of
International Journal of
International Journal of
Modelling & Simulation in Engineering
Volume 2014
Hindawi Publishing Corporation http://www.hindawi.com
Volume 2014
Shock and Vibration Hindawi Publishing Corporation http://www.hindawi.com
Volume 2014
Advances in
Acoustics and Vibration Hindawi Publishing Corporation http://www.hindawi.com
Volume 2014