An experimental and theoretical comparison between static and dynamic torsional soil tests. M. D. BOLTON and J. M. R. WILSON (1988). Gkotechnique 39, No.
Bolton, M. D., & Wilson, J. M. R. (1990). GCoterhnique 40, No. 4.659-664
DISCUSSION
An experimental and theoretical comparison between static and dynamic torsional soil tests M. D. BOLTON
and J. M. R. WILSON
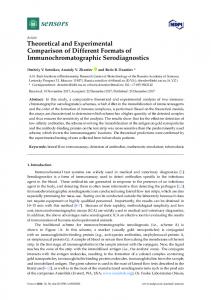
F. Tatsuoka, S. Shibuya, S. Teachavorasinskun and C.-S. Park, Institute of Industrial Science, University of Tokyo It has been shown in the Paper that, for a range of shear strains between 00J15% and 0.07% (1.5 x lo-’ and 7 x 10m4) a remarkable similarity in terms of stiffness and damping characteristics of dry Leighton Buzzard sand was observed when it was subjected to cyclic loadings in two sets of apparatus; i.e. a resonant-column apparatus and a torsional shear apparatus. As referred in the Paper, a similar result concerning the stiffness of sand has been obtained by Iwasaki et al. (1978). The results of their tests spanned a range of strain from 0X)04% to 0.04% (not from 0.04 to 0.4% as stated in the Paper), compared to 0.0015% to 0.07% in the Author’s tests (see Table 2). These test results suggest that dynamic tests on dry sands may be unnecessary and, at the same time, supported the status quo of current geotechnical engineering practice in Japan. Specifically dynamic analyses such as earthquake response analyses of ground or soil-structure systems require the evaluation of soil stiffness and damping for a range of strains from somewhere around 10e5 (0.001%) to around lo-’ (1%). In this range of strains the dynamic deformation properties of various types of soils (e.g. saturated soft clays, saturated or dry sands, gravels, cementtreated soils and so on) are usually evaluated by performing quasi-static cyclic loading tests with a frequency of the order of 0.1 Hz (e.g. Kokusho, 1980), which are termed ‘static’ tests in the Paper. As a result of this the resonant-column tests have been less popular in Japan even for evaluating the dynamic properties at strain levels below 10m4. Concerning maximum stiffness G,,, at extremely small strains, a new torsional shear apparatus has been developed at our laboratory (Tatsuoka, 1988; Pradhan, et al., 1988; Teachavorasinskun, 1989; Tatsuoka et al., 1989) in which the accuracy of measuring stresses and strains has been substantially improved. Some typical results for the stiffness of Toyoura sand measured at a mean principal stress p = ((ri + ffZ + g3)/3 of 98 kN/m* are shown in Fig. 13. These results have been obtained from a monotonic loading torsional simple shear (ML TSS) test for an initial
(1988). Gkotechnique 39, No. 4, 585-599 void ratio of 0.69 and a static cyclic loading torsional simple shear (SCLTSS) test for an initial void ratio of 0.66. Also shown in Fig. 13 are the average curves obtained from several resonantcolumn (RC) tests and static cyclic loading torsional shear (SCLTS) tests for void ratios of 0.70 (curve 3) and 0.66 (curve 4) (Iwasaki et al., 1978). It is clear from Fig. 13 that for strains below 10m4 the shear moduli from the RC tests (curves 3 and 4) and those from the SCLTS tests (curve 2) are very similar, now spanning a range of strain from around 0X)01% (10m5) to around 0.04% (4 x 10m4). The stress-strain relationship of another MLTSS test is shown in Fig. 14, in which data is plotted for maximum scales of shear strain of 10% (10-i) and 0.01% (10m4). It may be seen from curve B that the initial shear modulus G max could well be defined from the initial linear portion of shear strains below O+Ol% (lo- ‘). It may also be noted that the value of G,,, is similar to the secant modulus of a small unloading-reloading hysteresis loop with a single amplitude strain of the order of lo-‘. In Fig. 13 the value of G,,, from the MLTSS test (curve 1) is similar to those of the corresponding RC tests (curves 3 and 4) and of the SCLTS test (curve 2). The coincidence of G,,, between monotonic and cyclic loading tests has been observed for other types of sand, gravel and a cement-treated sandy soil as sheared in torsional shear, in plane strain compression and in triaxial compression (Shibuya et al., 1990). A practical implication of the coincidence of G,,, amongst these various testing methods is that G,,, under dynamic loading conditions can be evaluated even by monotonic loading tests. Some laboratory tests have been performed on silver Leighton Buzzard sand, as used by Wong and Arthur (1985), at the Institute of Industrial Science. Fig. 15 shows the results of the tests in which Leighton Buzzard sand was sheared in monotonic loading plane strain compression (MLPSC test). The specimens were 20cm high, 8 cm wide in the g3 direction and 16 cm long and were prepared by the air-pluviation method. The initial void ratio of the specimen measured at a confining pressure of 5 kN/m’ was around 0.56. The confining pressure applied was 78.4kN/mZ. The axial and lateral strains were measured
DISCUSSION
660 Table 2.
Testing conditions of RC and SCL TS tests Bolton
& Wilson (1989)
Iwasaki
Tatsuoka
et al. (1978)
et al.
Sand
Dry Leighton Buzzard sand, preparation method unknown
Air-dried and saturated Toyoura sand prepared by various methods including air pluviation
Saturated Toyoura sand prepared by air pluviation
Shape and dimensions of sample: mm*
RC and SCL: solid cylinder 38 D and 78 H
Hollow cylinder RC: 100 OD, 60 ID and 250 H SCL: 100 OD, 60 ID and 100 H
Hollow cylinder SCL: 100 OD, 60 ID and 200 H
Preshearing in RC for SCL
None
None
None
Prestressing (NC or 0C)t
No (normally consolidated)
No (normally consolidated)
Yes and no (no for the data presented here)
Consolidation stress
Isotropic
Anisotropic and isotropic (isotropic for the data presented here)
Anisotropic and isotropic (anisotropic for the data presented here)
Shearing
Pure shear at constant 6, and o,t
Pure shear at constant (ra and cr,t
Simple shear at a constant IJ, and constant areas and shapes of horizontal planes
Strain-controlled, at a constant shear stress amplitude f= O-001 Hz
Stress-controlled at a constant shear stress amplitude f= 0.1 Hz
Strain-controlled at a constant shear stress amplitude dy/dt = O.Ol%/min
04X4%444%
Only SCL, O+Ml->O.l%
Tenth cycle
Fifth cycle
mode
Cyclic loading method in SC test Strain range spanned No. of cycles for G.., in SC
Not specified, at the steady state
* D = diameter, OD = outside diameter, t Normally or overconsolidated. 1 Axial and radial pressures.
ID = inside diameter,
locally on the two lateral surfaces (us planes) of the specimen. The axial strain free from bedding error at the top and bottom ends of the specimen were measured by using a device called local deformation transducer (Tatsuoka, 1988; Tatsuoka et al., 1990). The lateral strain was measured by using four proximeters for each surface. With this instrumentation the lateral strain could be measured precisely until the formation of the shear band(s) (see Fig. 15(a)). The small strain behaviour is shown in Fig. 15(b). In these tests, the fixed angles 6, the direction of u1 relative to the bedding plane, were changed at values of O”, 25” and 90”. It can be seen from Fig. 15 that G,,, is independent of 6, while 4 = arcsin [(a1 - a#/ is strongly dependent on 6. (a1 + fJJlmax
H = height.
From the initial slope dT/dy of each relationship between the torque and the shear strain at the circumference as shown in Fig. 2, the value of G mBxcan be obtained from the Authors results; e.g. for dynamic test 2 (initial void 0.558 and confining pressure p = 93 kN/m’), a value of (dT/dy)initia, is approximately 2.27 x 10⁴Nm. By using
where r0 is the radius of the specimen (1.9 cm), the valued of G,,, is 2.1 x lo5 kN/mZ. This value for G max is then corrected to match the conditions of our PSC tests. By assuming that G maxcc ~‘.~(2.17 - e)‘/(l
+ e)
DISCUSSION
661
150 Dense Toyoura /J’ = 98 kN/m’
--
sand
D loo6 2 zl z 5 f E m
(1)-c-Monotone (2)---e = O-70 50-(3)--e =0.&j
NC spec~mens
Fig. 13. Shear modulus-shear strain relationships (see Table 2): 1 ML TSS test, 2 SCLTSS teat, 3 and 4 average from RC tests and SCLTS tests by lwasaki et al. (1978)
initial modulus of the Leighton Buzzard sand could also be evaluated from a static monotonic loading test. In Fig. 3 the stress-strain relation in the first loading is presented. While it is not clear whether or not this specimen had previously shown strain, it is interesting that when G,,, is determined from the initially linear portion of an ML test on a
the corrected value of G,,, is 1.97 x IO5 kN/m’, which is indicated in Figs 15(b) and 16. It may be seen that the value of G,,, from the Authors’ RC test practically coincides with that of our PSC test at 6 = 90”. The difference in 6 between these two tests (cf: 6 = k45” in RC test) is not significant since G,,, is hardly affected by 6. Accordingly, like Toyoura sand, it is suggested that the
I50
10
I
Curve Curve
00 00
A for the retailon 6 for the relallon
at large strain levels al small strain levels
6dhdA
1
&r#nA &,&*~b _A&‘=
00
Curve
I
0.002
A
Curve Shear
6.0
8.0
10.0
O-006
0.008
0.01
I
0.004
strain
1
B I’&
%
Fig. 14. Shear stressshear strain relationships for maximum scales of shear strain of (A) 10% (10-l) and (B) 091% (lo-‘) observed in a monotonic loading torsional simple shear test on Toyoura sand
662
DISCUSSION
OCR = I.0 ~1~= 7134 kN/m’
eoo5 0.555 0555 0.562
-----__
0 90 25” 0
5
0
1 25 o3 = 98.4 kN/m* 1 20
l n
0
5 1-l5-
max = 1.97 x IO5 kN/m2 from dynamic test 2
0 A
0
1
2
3
90 25”
4
5
Shearstraln~=r,-r3(x105) (b)
Fig. 15. Relationships (a) between the stress ratio and the axial strain to 10% (10-l) and (b) between the stress ratio and the shear strain to 0905% (5 x 10-s) observed in PSC tests on silver Leighton Buzzard sand
virgin specimen (or on a pre-sheared specimen), the value would be similar to that of G,,, of the corresponding RC test shown in Fig. 2.
Finally, with respect to stiffness at strains below 0.01% (10m4), it may be seen from Fig. 13 that the strain dependency is much greater for the MLTSS test (curve 1) than in the RC and SCL tests (curves 2, 3 and 4). This means that while G ma= can be evaluated from ML tests, the secant shear moduli G,,, as a function of shear strain level have to be evaluated separately for monotonic and cyclic loading conditions. It is stated in the Paper that ‘both the model and the experimental data show that the variation in the resonant frequency (i.e. the stiffness of specimen) is still significant at shear strain amplitudes below 0.01% (10e4)’ and ‘the variation of the resonant frequency is apparent even at small strains’. This tendency can also be seen in the relationships between curves 2, 3 and 4 (Fig. 13), but not to any great extent. Therefore, if the Authors’ data in Figs 2, 8, 9 and 10 are examined in a similar manner as shown in Fig. 13 (i.e. in the relationship between the secant shear modulus G,,, and the logarithm of single amplitude shear strain logy), and if they are compared with those of Toyoura sand, the dependency of the stiffness for strains below 10m4 may be better evaluated in a quantitative manner.
ACKNOWLEDGEMENT We are indebted to Professor J. R. F. Arthur University College, London, for providing with silver Leighton Buzzard sand.
Authors’
reply
It is valuable to have the corroboration from Tatsuoka et al. of the possibility of recovering dynamic soil stiffnesses from static soil tests, and most interesting to appreciate that this assump-
3 Silver Leighton Buzzard sand Plane strain compression test
Y
fy
2
= 1.97 x 1 O5 kN/m’ from dynamic lest 2 (Fig. 2)
_o_A___
8 G Y 2
n3
=
78.4 kN/m*
Continuous
data points
5 E
10-G
of us
10-a
Shear strain y = tI - Q: %
Fig. 16. Seeant shear modulns-shear strain relationship in a PSC test at 6 = 90” on silver Leighton Buzzard sand
663
DISCUSSION
tion underpins the Japanese approach to the analysis of earthquake response. Some of the particular advantages of performing slow, cyclic tests rather than resonant-column tests are brought out clearly in their discussion. Sample preparation may permit the simulation of various anisotropic conditions arising either from bedding planes or from the effects of consolidation history. Furthermore, the development of a progressively stiffer response, cycle by cycle, is effectively available only in slow cyclic tests such as those shown in Fig. 13 or in Fig. 3. Backanalysis of the initial data of increasing response over the first few tens of cycles in resonantcolumn tests, even where rates of sampling were sufficient, is impeded by the complex interaction between the applied excitation and the inertia of the top cap. We agree that the available data suggests that the small-strain modulus G,,, may be estimated equally from static or dynamic tests, but only when there has been strain reversal. Tests based on the propagation speed of waves, or on the achievement of steady resonance, clearly satisfy the reversal condition. Monotonic tests do not necessarily follow a reversal of the major principal strain direction however, and neither does soil in the field. Soil in the field will generally have been deposited, buried and partially unloaded. Its initial state, in terms of mobilized shear stress and strain, will be analagous to the soil at some point on the unload-reload loop in Fig. 14. An initial response at G,,, will be followed by a resumption of a modulus degrading not from the start of the latest episode of loading, but from the original shear strain origin. Whereas resilient response only requires data from a single unload-reload loop, the prediction of total response requires knowledge of the whole strain history. It must not be forgotten by those using data such as in Figs 13 or 16, that the strain origin is vital to their prediction. In this context, even previous one-dimensional compression must be recognized as causing shear strain (equal to the volumetric strain, in that case). In the general case, only that stress increment which causes a strain reversal can generate a stiff G,,, response. In our own torsion tests it was found to be difficult to exclude a small torsion cycle when fixing the top cap before testing, thus causing the initial modulus to take the value G,,,. We believe that the same effect can be seen in the first three data points in Fig. l&perhaps the true virgin stiffness is represented by the gradient of points four to six, which is only about O.SG,,,. We therefore believe that a distinction must be drawn between data of monotonic virgin loading and data of stress amplitude plotted against strain amplitude for the steady hysteretic response of soil which
has been subjected to a number of identical cycles-the backbone curve defined in the Paper. There seems to be no good reason to assume that the two curves share the same initial gradient. Regarding stiffness at strains below 10m4, we agree that the dependency of G on y is much reduced, compared to the reductions evident at y > 10m4. Apparently, however, the dependency at y = 10m4 is still sufficient to produce the asymmetrical frequency response curve which we now know is symptomatic of hysteretic materials. There is extreme sensitivity to frequency of excitation just below resonance. This fact may yet prove to be important to the design of foundations for extremely sensitive equipment. The extra accuracy provided by the new apparatus of Tatsuoka et al. and displayed in Figs 13 and 16 suggests that for shear strains smaller than 10e6 sands will behave as elastic materials with negligible material damping. If a client were to impose a
Pores:
o
2
D
dry
W
water
saturated
Cl Dyn 95 kPa
A
D Dyn 300 kPa
l
W Dyn
A
W Dyn 300 kPa
Shear
100 kPa
stram
(x
.
Ati
0.001)
Fig. 17. Dynamic torsion data
. 0
0
I
I
0.2
0.4
Shear
strain
1
0.6 (x
0.001)
Fig. 18. Dynamic damping data
0.8
664
DISCUSSION
rotation limitation of this order of magnitude as a performance criterion, the engineer would have even greater anxiety about the possibility of resonance. We hope that our association of material damping with the decline of shear modulus due to shear strain, using only a hysteresis loop on a stress-strain diagram, will encourage a more rational selection of damping ratio in dynamic analysis. The use of a hysteretic stress-strain relation for soil, with zero viscosity even when the soil is saturated, is supported by the data of stiffness and damping for dry and water-saturated sand shown in Figs 17 and 18. The presence of pore water has no effect on the soil parameters at a given effective stress level, although the possibility that effective stress might fall due to the creation of excess pore pressures must be addressed separately. Figs 17 and 18 support the Japanese working hypothesis that soil parameters for earthquake analysis can be derived from convenient static tests. We hope to conduct further work so that proper limits can be placed on the neglect of fluid viscosity and other effects of strain rate, relevant perhaps to very high frequency vibrations in water-saturated sands or to earthquakes in tar sands or clays.
REFERENCES Kokusho, T. (1980). Cyclic triaxial test on dynamic soil properties for wide strain range. Soils & Fndns 20,
No. 2,4560. Park, C. S. (1990). Anisotropy in deformation and strength properties of sands in plane strain compresthesis, University sion tests. Master of Engineering of Tokyo. Pradhan, T. B. S., Tatsuoka, F., & Horii, N. (1988). Simple shear testing in a torsional shear apparatus. Soils & Fndns 28, No. 2, 95-l 12. Shibuya, S., Tatsuoka, F., & Kong, X. J. (1990). Discussion: Recent developments in laboratory strength and deformation testing, Proc. 12th Int. Con& Soil Mech. & Fndn Engng, Rio de Janeiro, 4. Tatsuoka, F. (1988). Some recent developments in triaxial testing systems for cohesionless soils. Adoanced Triaxial Testing of Soils & Rocks, 977,1-61. Tatsuoka, F., Pradhan, T. B. S., & Yoshi-le, H. (1989). A cyclic undrained simple shear testing method for soils. Geotech. Testina Journal. 12. No. 4. 269-280. Totsuoka, F., Shibuya, S., Goto,.S., Sato, T., & Kong, X. J. (1990). Discussion on Paper by Clayton et al. Geotech. Testing Journal 12, No. 1,69976. Teachavorasinskun, S. (1989). Stress-strain and strength characteristics of granular materials in simple shear. Master of Engineering thesis, University of Tokyo. Wong, R. K. S., & Arthur, J. R. F. (1985). Induced and inherent anisotropy in sand. Gtotechnique 35, No. 4, 471481.