An Experimental Study on Detecting Semantic Defects in Object-Oriented Programs using Software Reading Techniques Alfaroq O. Mohammed
Ziad A. Abdelnabi
Faculty of Sciences Omar Al-Mukhtar University, Libya
[email protected]
Academy of Graduate Studies, Libya
[email protected]
Abdelsalam M. Maatuk Faculty of Information Technology Benghazi University, Libya
[email protected]
ABSTRACT Software defects are categorized into two main types: Syntax and Semantic defects. Syntax defects are easily to capture using compliers (or interpreters) that programming languages have. However, compliers are incapable to detect semantic defects, and this makes programmers re-read the source code a number of times to figure out where the defects locations are. Semantic defects are unable to be detected by compilers, as they are logical errors, and need the code file to be inspected carefully to catch them. This paper presents an approach to help programmers in discovering semantic defects in object oriented programming. As software code reading techniques play the most important role in capturing semantic defects, we have conducted a number of controlled experiments using three reading techniques, in order to test their efficiency and effectiveness.
Keywords Semantic defects, software reading techniques, object oriented programming.
1. INTRODUCTION Software companies and stand alone programmers always look forward to produce high quality software that are flexible, updateable, efficient and most importantly free of defects. Generally speaking, quality is the software reputation described by the user, a good quality must satisfy the user’s needs and provide more additional services to guarantee longer age for the software in markets [12]. Nowadays, most software companies make an effort to avoid to create poor quality products by consulting software experts, developing new techniques, etc. Poor products always lead to repeated execution, never-ending maintenance, and the need for more experts, which lead to heavyload cost [25]. Permission to make digital or hard copies of all or part of this work for personal or classroom use is granted without fee provided that copies are not made or distributed for profit or commercial advantage and that copies bear this notice and the full citation on the first page. Copyrights for components of this work owned by others than ACM must be honored. Abstracting with credit is permitted. To copy otherwise, or republish, to post on servers or to redistribute to lists, requires prior specific permission and/or a fee. Request permissions from
[email protected]. ICEMIS '15, September 24-26, 2015, Istanbul, Turkey © 2015 ACM. ISBN 978-1-4503-3418-1/15/09…$15.00 DOI: http://dx.doi.org/10.1145/2832987.2833025
Abdalmunam S. Abdalla Faculty of Sciences Omar Al-Mukhtar University, Libya
[email protected] As software quality has become an important issue, many organizations, e.g., IEEE, British Computer Society and American Society for Quality, concern about software testing to produce high quality products. Therefore, the purpose of software testing from the developer perspective is to make sure that the software meets requirement specifications or developed free of bug [20]. Software reading is the merely technique in hand towards achieving high quality software. It is the only analysis technique used throughout the entire life cycle of development and maintenance process [1]. Because of software reading plays an important role towards creating high quality software, several experiments conducted to develop and create reading techniques. A reading technique is a set of steps for the individual analysis of a textual software product to reach the understanding needed for a particular task [3]. Reading techniques vary from each other in use, purpose and family, hence we can rely on each reading technique in a specific phase, in which it is more effective in [2]. Several empirical studies have been conducted aiming to answer questions related to software reading techniques [18, 19, 1]. This paper presents an experimental study to determine which reading techniques are effective and efficient, in order to produce the required results. The main idea behind this research is to understand software quality by investigating different defect detection techniques once applied for object oriented software. Defect detection methods may take a static approach (no execution) or a dynamic approach (test execution) [24]. This study can be considered as an extension to the work that is described in the ESERNET project [9, 17]. This project emphasizes on the importance of empirical software engineering as one mean to understand and measure software quality. However, we focus on white-box testing through software reading by conducting a family of controlled experiments in the context of laboratory environment from a researcher point of view. Three static testing techniques have been used, which are: Checklist Based Reading (CBR), Functional Based Reading (FBR) and Systematic Based Reading (SBR). Based on these techniques, we have conducted two experiments: Basic Experiment (BE) and its Replications Experiment (RE). We replicated the experiment to double-check its results and increase the confidence. The results of these experiments are discussed, where their nominated subjects are undergraduate and postgraduate students. The rest of the paper is organized as follows: Section 2 summarizes the related work. Section 3 presents the experimental study. The reading techniques productivity is described in Section
4, whereas their efficiency is discussed in Section 5. Finally, Section 6 summarizes the main conclusion of the paper.
2. RELATED WORK Software defects have always been the main obstacle that most software companies and software engineers face, towards making excellent products, which satisfy the needs of the user. Therefore, several researches and experiments, which are vary from whitebox to black-box testing experiments, are conducted to find an ideal solution for the software defects problem. Software inspection is as old as programming itself, since it was introduced in the 1970s at IBM, which pioneered its early adoption and later evolution [5]. It is a way of detecting faults in software requirements document, design or codes. Existing empirical studies have demonstrated that the defects detection process is more individual than a group activity as assumed by many inspection methods [6]. Inspection results depend on inspection participants themselves and their strategies for understanding the inspected artifacts [7]. Gilb and Grahams’ manuscript on software inspection states that Checklist questions interpret specified rules within a project or an organization [20]. It was found that the systematic approach offered a number of benefits: a rigorous reading strategy, potential to help address delocalization through abstract specifications, potential to encourage deeper understanding, and to discover different defects from an ad-hoc approach [10]. Weakness in SBR is that, it does not address adequately the highly dynamic nature of object-oriented software. Reading by stepwise abstraction is a technique that requires more rigorous examination of the software artifact than either ad-hoc or Checklists do [12, 13]. Scenariobased reading techniques [1] extends the work in [14] and allocate specific responsibilities to inspectors. Some experiments with students as subjects found that subjects using the defect-based reading technique detect more defects in requirement documents than subjects applying either ad-hoc or CBR [8, 15], and similarly with professional subjects [16]. In CBR technique, the reader is responsible for all the inspection processes and finding all possible defects [20]. A perspectivebased reading scenario consists of activities an inspector is to perform to extract information from the inspected document and questions to analyze the extracted information. In the context of a controlled experiment at NASA [4], the researchers have compared the PBR approach to a specific NASA reading approach, which is evolved over several years. For some requirements documents, it is found that the individual subjects using the PBR technique have been more effective at defect detection in the requirement documents than subjects using the NASA reading approach.
3. EXPERIMENTAL STUDY This section describes how the research experiments have been conducted, executed and eventually replicated for several replications, regardless of the changes made to the experiment planning. We have conducted, the Basic Experiment, BE, with the participation of undergraduate students in two Libyan Universities. The first experiment has been conducted in the department of computer science at Omar Al-Mukhtar University, whereas the second one conducted in the department of software engineering at Benghazi University. Table 1 shows the number of students employed in each university and the assigned reading techniques.
Table 1. Number of subjects assigned to reading techniques SBR CBR FBR Oma El-Mukhtar University 3 4 5 Benghazi University 5 4 4 Merged (BE) 8 8 9 The BE experiment has been also replicated with postgraduate students in the department of computer science at the Academy of Graduate Studies, Libya. We replicated the experiment to doublecheck its results and increase the confidence, with respect to the factors shown in Table 2. Cartwright refers to replications as repeating an experiment, closely following the experimental procedures of the original ones, and refers to reproductions when re-examining the results from previous experiment, using a different experimental protocol [22]. Basically, replication produces an additional set of results and it is a mechanism for building knowledge [23]. More details on the experiments that we have conducted can be found in [21]. Table 2. Replicated experiment factors Factor Object Oriented Time Level of experience Programming language Type of defect Technique
Description The use of object oriented concepts Experiments are restricted to a specific duration of time It depends on the experiment’s subjects (juniors or masters) The programming language that supports OO The seeded defects are taken from IBM table The technique used to capture the defect
The resulted Replicated Experiment, RE, passed the same common settings compared to the BE experiment. Other new variables were taking place during the experiment planning and execution. In the RE, it is expected that the change of subjects’ experience and the usage of technology during the experiment execution would effect on the number of detected defects and their types. Table 3 shows the number of students at the Academy of Graduate Studies arranged by the reading technique. Table 3. Number of subjects at Academy of Graduate Studies arranged by reading techniques
Academy of Graduate Studies
SBR 11
CBR 11
FBR 12
We consider the planning and execution phases of one BE and one replicated RE with subjects in different levels of experience having almost the same environmental settings. For each experiment, subjects have been assigned to a certain reading technique as shown in Table 4. Table 4. Number of subjects assigned to techniques in BE and RE
Basic Experiment (BE) Replicated Experiment (RE)
SBR 8 11
CBR 8 11
FBR 9 12
In this research, the aim of using reading techniques is to navigate through software document and capture seeded defects. Each captured defect should be classified into a specific category according to the IBM table of categorizations for object oriented defects [11]. A description of each type of defects is included in the table of defects as shown in Table 5.
3.1 Basic Experiment (BE) 3.1.1 BE Experiment Planning The BE experiment is performed on students from the computer science and software engineering departments. The students participating in this experiment were given an introductory lecture to software quality, software testing, and the targeted software reading techniques. Eventually the students are participated to an offline homework that consists of different software documents (code file in Java programming language seeded with semantic defects, some basic class diagrams and guidelines). The students had sufficient time to work on the given homework and they have been in contact with the research team via E-mails. During two weeks period of time, the students started their training on the homework and continued to ask more questions about the techniques, the experiment structure, and how to take advantage of using the supported documents associated (attached guidelines, which clarify the nature of the software and explain the code file). Table 5. IBM table of categorizations for object oriented defects [11]
Table 6. Details of seeded defects in source code documents
Category Total number of defects Category A Category B Category C Category D Category F Lines of code (LOC)
Number 30 8 6 7 2 7 749
Percentage 0.04 0.01 0.008 0.009 0.002 0.009 1
We have calculated the percentage through dividing the number of defects by the lines of code. For subjects, the aim of using reading techniques is to navigate through software documents and capture seeded defects. Then each captured defect have be classified into a specific category according to the IBM table. Besides, a description of each defect includes the faulted line of code, time when the defect is captured in hours and minutes, name of the class where the captured defect is located, starting time, ending time, technique used, and some notes about the defect the inspector may desire to write. Table 7 shows an example of the student’s answer form, which contains the information given in Table 6 and needs to be filled by the participant. Table 7. Student's answer form
Starting Time: Ending Time: Technique: Class Line Type of Time Notes Number Defect Bank 44 A 10:10 Bank 60 A 10:27 Account 22 C 10:33 Transaction 32 B 10:41 Transaction 37 B 10:53
3.1.2 BE Experiment Execution The experiment was performed in offline environment, and students have been divided into groups of one subject. Each group has been assigned randomly to a specific reading technique. The specifically designed guidelines for each technique were given to each group. Guidelines have been distributed to the groups with lines of code seeded with defects, and asked to begin inspecting the documents on a certain time. At the end of the experiment, students submitted the answer forms filled with the defects they detected. In order to make object oriented software easy to understand for the students, we have used the UML basic diagrams. By using UML diagrams, the students would not have hard time in trying to read the code file looking for the seeded defects directly. However, comments were included to facilitate the process of reading the code file, precise description for each line explaining the new programming methods (functions) that students may face, and the meaning and the purpose of each variable or function. The selected software we planned to use during RE has been made in Java, an object oriented software of banking system is chosen for the class experiment. We have seeded semantic defects in the software code to compare the three reading techniques. These defects are categorized, seeded and then tested before the class experiment begins. Our seeded defects are based on the IBM table of categorization mentioned in Table 4. Once the defects have been injected, we have tested the program and run it to make sure that those seeded defects do not affect on the syntax expression causing a syntax error. Table 6 shows some seeded defects details in the source code documents.
3.2 The Replicated Experiment (RE) 3.2.1 RE Experiment Planning The RE experiment is performed with postgraduate students. We believe that doing the experiment with master students would allow us to get better results and have more defects captured, as they might have more experience in programming, especially object oriented than the sophomore. We have accomplished the same preparations in RE as used in BE, including the introductory lecture, software documents, homework, code files, etc. This experiment is different from the previous one as the required data (i.e., students’ answers) is collected electronically. We have designed a website and a database to store the data in SQL Server system. We have been able to have a free hosting (from www.aspspider.com) for three months, which was enough to accomplish the experiment and collect the results. The website was enhanced to provide complete guidelines for subjects, from initial authentication up to defect submission through web forms. Every student had his own unique identity (i.e., username and password) to login, view the pages and fill in the answer
electronic form. The answer form has the same design as in BE, so that there was no difficulty in filling the form electronically. Then, we collected the data directly organized and ordered from the database system. Before that, we have arranged with a lab supervisor to reserve the computer laboratory (provided with internet connection) at the Academy of Graduate Studies for time duration of two hours a day, before the experiment time.
3.2.2 BE Experiment Execution The BE experiment has been conducted in a computer laboratory at the Academy of Graduate Studies, and students are divided into groups. Each group contains of one student assigned randomly to a specific reading technique. After the student logs into the website by displaying a text forcing him to use that technique, and the guidelines for each technique have been given to the student assigned to use that technique. Guidelines differ from each other according to the technique, e.g., the student uses FBR technique needs the table describes each method (function) in the code. Before the experiment starts, students are given some helping documents about the experiment code file giving them an idea in advance about the software nature of the class experiment. At the beginning of the experiments, students were given the website link and a username and password for each one of them. Once students log in, they can navigate through webpage, e.g., student can see a welcome statement, the technique that have be used, links with names of code classes, and display each class code once the link is clicked. Moreover, the page contains the electronic submission form, so that the student can switch between different classes and can use the electronic form to send his defect detection results to the website database, The data stored in database includes class name, username who performs the inspection process and the time (in minutes and seconds) when each defect is captured. A message appears after clicking the submit button telling the subject that saving the result done successfully.
4. TECHNIQUES PRODUCTIVITY In this section, collected data from BE and RE experiments are statistically analyzed and some observational graphs are drawn to facilitate the meaning of data in terms of techniques productivity, using the following equation: 𝑁𝑢𝑚𝑏𝑒𝑟𝑂𝑓𝐷𝑒𝑡𝑒𝑐𝑡𝑒𝑑𝐷𝑒𝑓𝑒𝑐𝑡𝑠 𝑃𝑟𝑜𝑑𝑢𝑐𝑡𝑖𝑣𝑖𝑡𝑦 = 𝑇𝑜𝑡𝑎𝑙𝑁𝑢𝑚𝑏𝑒𝑟𝑂𝑓𝑆𝑒𝑒𝑑𝑒𝑑𝐷𝑒𝑓𝑒𝑐𝑡𝑠 We have also developed a model to calculate the productivity for each type of defect as well as the overall productivity for all defects in both BE and RE, as given in Table 8. Table 8. Model of productivity used in BE and RE experiments
C *
True Defect & True Categorization CTT *TT *T*
CTT:
CTF:
CFF:
True Defect & False Categorization CTF *TF
False Defect & False Categorization CFF *FF
C is a specific category of defect, T is a true defect, T is a true classification. C is a specific category of defect, T is a true defect, F is a false classification. C for specific category of defect, F for false defect, F for false classification.
*TT:
* for overall average of CTT and CTF for a specific defect category. *T*: * for overall average of CTT and CTF for all defects categories. *TF: * for overall average of CTF for a specific defect category. *FF: * for overall average CTT and CTF for a specific defect category. For a lack of space, we describe here the CTT results using the three techniques for capturing semantic defects in BE and RE experiments. Further details on the results of the other categories can be found in [21]. Because we have a case of failure in SBR test of normality results, we have investigated on groups submissions and we found that one of the groups have submitted a huge amount of false defects. Thus, this group has been reduced from SBR in BE experiment, and our subjects groups would be as in Table 9. Table 9. Experiment groups after data reduction
SBR 7 11
Basic Experiment (BE) Replicated Experiment (RE)
CBR 8 11
FBR 9 12
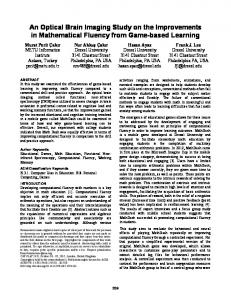
4.1 Productivity in CBR Technique The CTT results using CBR technique for capturing semantic defects and the classification of the defects as well in BE and RE are shown in Figure 1. At glance, we have noticed that the data obtained from both experiments are proximate, the highest values are in class C, 36% in RE and 32% in BE, while the least values are in type F, 8% in RE and 9% in BE, respectively. Clearly, there is an equality in type B where BE and RE have the same value 23%. In type A, RE has 16%, which is higher than 13% in BE, while in type D, the value of 19% in BE is higher than 14% in RE. Generally, BE has higher values in types D and F, while RE has higher values in types A and C, while there is equality in type B. CTT Productivity BE
60%
CTT Productivity RE
50% 36% 32%
40% 30% 20%
23% 23%
19% 14%
16% 13%
10%
9%
8%
0% -10%
A
B
C
D
F
Figure 1. CBR productivity of CTT in BE and RE
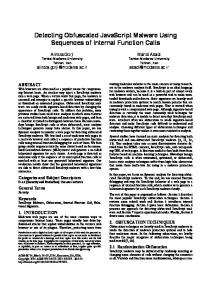
4.2 Productivity in SBR Technique The CTT results using SBR technique for capturing semantic defects and the classification of the defects in BE and RE are shown in Figure 2. There is a sharp increase in the values for both BE and RE in type A to type C. We can clearly notice that the highest value in the graph 40% for RE in type C, while BE has 27% in type C either. We can also see that BE and RE have the same value, but in different types, RE has 5% in type D, but BE has 5% in type A. In type A, RE has 20% while in type D, BE has 36%. Values in type F are proximate, 8% for BE and 10% for RE,
where the values in type B are not proximate, as BE has 14% and RE has 29%. CTT Productivity BE
60% 40%
40% 20%
29% 20%
CTT Productivity RE 36%
27%
14%
10% 5% 8%
5%
0% -20%
A
B
C
D
F
and then the numbers increased to 13 defects between 20-40 for all of the techniques, except of 12% in SBR. A steady increment of two defects in the values for SBR from 20-40 to 40-60, before it has got to 15 defects in 60-80, a sharply decrement in 80-100 to 9 defects followed by another decrease in 100-120 to 2 defects. A strong increment in the period 40-60 of 11 points for FBR from 13 defects to 24 defects, then the numbers are sharply decreased to 15 defects in 60-80 and continued to decrease to 7 defects, and finally decreased to 4 defects. A dramatic increase in 40-60 for CBR to 19 defects and continued to increase to 21 defects in 60-80, quickly decreased to 9 defects in 80-100 period, and to 4 defects in 100-120 either.
Figure 2. SBR productivity of CTT in BE and RE
4.3 Productivity in FBR Technique The CTT results using FBR technique for capturing semantic defects and the classification of the defects in BE and RE are described in Figure 3. Obviously, the two highest values are 47% in type B and 48% in type C for RE, while the BE value in type B 22% and 14% in type C. On the other hand, the type D has values of 17% for BE and 8% for RE, where in type F, there is a difference of three points between BE value 16% and RE value 13%. Finally, in type A, RE value is 26% where BE value is 15%. CTT Productivity BE
60% 47%
50%
48%
CTT Productivity RE
5.2 Efficiency in RE
40% 30% 20%
Figure 4. Line chart of techniques’ efficiency in detecting true defects in BE
26%
The correct detected defects for every technique in every 20 minutes are presented in Figure 5.
22%
15%
14%
17% 8%
10%
16% 13%
0% -10%
A
B
C
D
F
Figure 3. FBR productivity of CTT in BE and RE
5. TECHNIQUES EFFICIENCY The efficiency in this research determines the efforts made by the three reading techniques, when the time is limited. This section is concerned with the analysis and the description of techniques’ efforts in both BE and RE experiments. Both experiments had a period of time of two hours. In order to test their efficiency, we have divided the two hours into six periods of minutes. We have collected the data in every 20 minutes and classified them into TT, TF and FF as performed in testing the productivity. The efficiency is calculated according to the following equation:
𝐷𝑒𝑓𝑒𝑐𝑡𝐷𝑒𝑡𝑒𝑐𝑡𝑒𝑑𝑅𝑎𝑡𝑒 =
𝑁𝑢𝑚𝑏𝑒𝑟𝑂𝑓𝐷𝑒𝑡𝑒𝑐𝑡𝑒𝑑𝐷𝑒𝑓𝑒𝑐𝑡𝑠 𝑇𝑜𝑡𝑎𝑙𝑂𝑓𝐴𝑣𝑎𝑖𝑙𝑎𝑏𝑙𝑒𝑇𝑖𝑚𝑒𝑠
5.1 Efficiency in BE The correct detected defects for every technique in the six periods of 20 minutes of two hours are given in Figure 4. The first 20 minutes begins with fewer values for all techniques respectively,
Figure 5. Line chart of techniques’ efficiency in detecting true defects in RE It is obvious that, all techniques have zero defects in the period 020, a dramatic increase in the period after to 9 defects for CBR, 8 defects for SBR and 15 defects for FBR. Regarding the technique FBR, in the period of 40-60, numbers have raised up to 27 defects and continued to increase up to 61 defects in 60-80, before they are sharply decreased to 36 defects in 80-100, and yet again to 2 defects in 100-120 period. For the SBR, a sharp increment starts from 8 defects in 20-40 period and increased to 24 defects in 4060 and continued to increase up to 31 defects in 60-0. The defect numbers are started to increase from 9 defects in 20-40 to 20 defects in 40-60. Besides, there is a slight increment to 24 defects in 60-80 followed by a slight decrement of one point to 23 defects
in 80-100, and finally decreased to 9 defects in the last 20 minutes.
6. CONCLUSION This paper presents an experimental study to evaluate software reading techniques used in detecting semantic defects in object oriented programming. A number of controlled experiments have been conducted using three reading techniques, in order to test their efficiency and effectiveness. The techniques, which have been considered, are CBR, FBR and SBR. A basic experiment and its replications are accomplished and their results discussed, where their study subjects have been undergraduate and postgraduate students. The study recommends to use the FBR technique because of its appropriation with human nature. Human understanding is an important factor in software production. The FBR technique is promising, productive and effective technique. The SBR and CBR are designed independently from human factor. The performance of SBR and CBR is in a lack of defining a method for navigation through programming codes. The efficiency varies among the three reading techniques. The 120 minutes in detecting software defects is insufficient period to expose most of software defects. According to the numbers of defects detected in the 120 minutes period of time, the FBR is more efficient than the SBR and CBR. With the given period of time, the number of detected defects increases up to 40%. In addition, based on their categories, defects of type C are the most detected, whereas defects of type A and B come next, and defects of types D and F are the minimum detections.
7. REFERENCES [1] V. Basili. Evolving and Packaging Reading Technologies. 1997. University of Maryland at College Park, USA. [2] F. Shull, F. Lanubile and V. Basili. 2000. Investigating Reading Techniques for Object-Oriented Framework Learning. In IEEE Trans. Soft. Eng. vol 26(11), pp. 11011118. DOI=http://dx.doi.org/10.1109/32.881720 [3] F. Shull. 2002. Software Reading Techniques. John Wiley & Sons, Inc. [4] V. Basili, S. Green, O. Laitenberger, F. Shull, S. Sørumgård, and M. Zelkowitz. 1995. The Empirical Investigation of Perspective-Based Reading. In Empirical Soft. Eng. vol 1(2), pp. 133-164. [5] M. Fagan. 2002. A History of Software Inspections. In Software Pioneers. M. Broy and E. Denert (Eds.). SpringerVerlag, New York, Inc., New York, NY, USA, pp. 562-573. [6] O. Akinola and A. Osofisan. 2009. An Empirical Comparative Study of Checklist-based and Ad-Hoc Code Reading Techniques in a Distributed Groupware Environment. In Int. Journal of Computer Science and Info. Security, IJCSIS. vol 5, pp. 11. [7] O. Laitenberger. 2002. A survey of software inspection technologies. In Handbook Soft. Eng. Knowl. Eng. vol. 2, pp. 517–555. [8] A. Porter, L. Votta, and V. Basili. 1995. Comparing detection methods for software requirements inspections: A replicated experiment. In IEEE Trans. on Soft. Eng. vol. 21. pp. 563575. [9] Z. Abdelnabi. 2006. From Statistical Analysis to Clusterimpact Approach for Manipulating Experimental Data Using Fuzzy Sets. PhD Thesis. University of Rome Tor Vergata, Roma, Italy. [10] A. Dunsmore, M. Roper and M. Wood. 2003. The development and evaluation of three diverse techniques for
object-oriented code inspection. In Software Eng., IEEE Transactions on. vol. 29(8), pp. 677-686. [11] IBM Corp. 2003. S/390 Orthogonal Defect Classification Education [Online]. Available: www.1.ibm.com/servers/eserver/zseries/odc/nonshock/odc8s.html.
[12] M. Dyer. 1992. The Cleanroom Approach to Quality Software Development. John Wiley & Sons, Inc., New York, NY, USA. [13] R. Linger, H. Mills, and B. Witt. 1979. Structured Programming: Theory and Practice. Addison-Wesley Longman Publishing Co., Inc., Boston, MA, USA. [14] D. Parnas and D. Weiss. 1987. Active Design Reviews: Principles and Practice. In Journal of Syst. and Soft. vol. 7, pp. 259–265. [15] J. Miller, M. Wood and M. Roper. 1998. Further Experiences with Scenarios and Checklists. In Empirical Soft. Engineering. vol. 3(1), pp. 37–64. [16] A. Porter and L. Votta. 1998. Comparing Detection Methods for Software Requirements Inspections: A Replication Using Professional Subjects. In Empirical Soft. Engineering. vol. 3, pp. 355-370. [17] ESERNET EC Project. 2003. Empirical Methods and Studies in Software Engineering: Experiences from ESERNET. R. Conradi and A. Wang (Eds), LNCS 2765, Springer. [18] P. ReidarConradi, A. Tayyaba, L. Hegde, G. Bunde and A. Pedersen. 2003. Object Oriented Reading Techniques for Inspection of UML Models – An Industrial Experiment. In Proceedings of the ECOOP'03, 13 p. [19] G. Cantone1, L. Colasanti1, Z. Abdulnabi1, A. Lomartire and G. Calavaro. 2003. Evaluating Checklist-Based and UseCase-Driven Reading Techniques as Applied to Software Analysis and Design UML Artifacts. R. Conradi and A. Wang (Eds.). In ESERNET 2001-03, LNCS 2765, pp. 142– 165. Springer-Verlag, Berlin. [20] A. Alshazly, A. Elfatatry and M. Abougabal. 2014. Detecting defects in software requirements specification. Institute of Graduate Studies & Research, Alexandria University, Egypt. [21] A. Fannush. 2012. Defect Detection and Identification in Object Oriented Software: An experimental study. MSc Thesis. Academy of Graduate Studies, Libya. [22] N. Juristo and O. Gomez. 2012. Replication of Software Engineering Experiments. In Empirical Soft. Engineering and Verification. B. Meyer and M. Nordio (Eds.). SpringerVerlag, Berlin. vol. 7007, pp. 60-88. [23] J. Krein. 2014. Replication and Knowledge Production in EmpiricalSoftware Engineering Research. PhD Thesis. Brigham Young University, USA. [24] R. Per, A. Stefik and A. Andrews. 2014. Variation factors in the design and analysis of replicated controlled experiments. In Empirical Soft. Engineering. vol. 19(6), pp. 1781-1808. [25] S. Dehaghani, N. Hajrahimi. 2013. Which Factors Affect Software Projects Maintenance Cost More? In Acta Informatica Medica. vol. 21(1), pp. 63-66.