We examined the IO optimization techniques and the distinct features of the flash SSD. The IOs applied with optimization
DEIM Forum 2010 E8-2
An Experimental Study on IO Optimization Techniques for Flash-based Transaction Processing Systems Yongkun WANG† , Kazuo GODA† , Miyuki NAKANO† , and Masaru KITSUREGAWA† † Institute of Industrial Science, the University of Tokyo 4–6–1 Komaba, Meguro–ku, Tokyo 153–8505 Japan E-mail: †{yongkun,kgoda,miyuki,kitsure}@tkl.iis.u-tokyo.ac.jp Abstract Flash SSDs are being considered and partially starting to be utilized for enterprise storage. In order to maximize the performance benefit, different IO optimization techniques can be applied to the existing storage system. We examined the IO optimization techniques and the distinct features of the flash SSD. The IOs applied with optimization techniques are analyzed through the IO path with the trace generated from the transaction processing system which is usually hosted on the enterprise storage platforms. Key words NAND Flash Memory, SSD, LFS, Transaction Processing
1. Introduction
For flash SSD, these IO optimization techniques should be reconsidered. For example, for log-structured file system, al-
Flash SSDs (Solid State Drive) are being considered and
though the sequential reads may be converted into random
partially starting to be utilized for enterprise storage. Many
reads, the performance may not be harmed since the perfor-
enterprise storage platforms, such as EMC Symmetrix V-
mance of sequential read is close to that of random read on
Max [2], Oracle EXADATA V2 [11], have incorporated flash
flash SSD since there is no mechanical moving parts.
SSDs to boost the IO performance of the whole system. How-
Therefore, we studied the IO optimization techniques and
ever, the flash SSD is a brand new storage media, with spe-
the distinct features of the flash SSD. IOs applied with opti-
cial IO characteristics which is far away from the traditional
mization techniques are analyzed through the IO path with
hard disk, such as the fast read performance, “erase-before-
the trace generated from the transaction processing system
write”, and wear-leveling. Therefore, the conventional IO
which is usually hosted on the enterprise storage platforms.
optimization techniques should be reconsidered based on the
The rest of this paper will organize as follow: Section 2 will
characteristics of flash SSD.
describe the experiment setup. In Section 3, we will present
IO optimization techniques are important to the overall
the transaction throughput. The trace-based analysis will be
performance of the storage system, especially the transac-
provided in Section 4. Section 5 will summarize the related
tion processing system. The IO optimization techniques are
work. Finally, our conclusion and the future work will be
usually designed by the characteristics of the workload and
provided in Section 6.
storage media. In the case of the transaction processing systems, the workload is mainly composed of the random writes
2. Experiment Setup
to the storage media. For the widely used storage media,
Our experiments focus on the transaction processing sys-
hard disk, the random writes are very slow due to the me-
tem, which is one of the most important applications hosted
chanical moving parts. Hence lots of IO optimization tech-
on enterprise storage platform. We used the popular TPC-
niques are applied to try to convert the random writes to se-
C [15] as the benchmark for the performance of transaction
quential writes in order to maximize the overall performance.
processing systems. A database server to run the TPC-C
For example, at file system level, the log-structured file sys-
benchmark was built with the Linux operating system. High-
tem is proposed to convert the random writes to sequential
end SLC flash SSDs are connected to the computer system
writes, with the side-effect that sequential reads may also be
with SATA 3.0Gbps hard drive controller. These SSDs are
converted into random reads. At the block IO level, the IO
different in random access time or throughput. Fig. 1 gives
scheduler plays a vital role to group, merge and re-order the
the view of our experimental system.
requests to utilize the sequential performance of the storage media.
We chose a commercial DBMS, as well as popular open source DBMS MySQL, as the database system for the TPC-
K �� L �� , ��� D4M C5++ . 1!* 6$5N .:;: 6$+' 6"'/
K �� L �� �� �� R "5� Q . 1!* "$5N .:;: 6$+' &0 '/
. ��?�� :;: 6'
K �� L �� M!O PQ4; QR QR . 1!* "$5N .:;: 6$+' #"+ '/
\TTT [TTT Q 2���� #++ ,
; ��7?��� D!
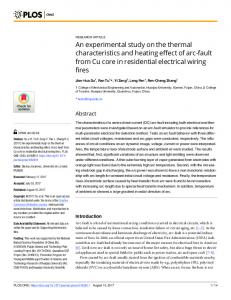
��� ���� ������ � ��� � �� ��� � ������ � ����� ���� �� �� !��� " ��� #$%&'()* + # &&,() -. /* 0 ,/ 1" ���2� '/ 3 ��4 " " 566 ���� �2����� ,�7��8 �� �9�� �3.:;: 6$+ ' (��3 ��?@ � !�� ������A? 2 > �==�� B �� 4: ��+* #* 5 ��3 #+ . ��9� � C"++ 4D, 5++'/ (��3 ��?@ � E� �� F� I J����� "GH $&$#%
Fig. 1 System Configuration
vwxV
ZTTT ut rs
ybqzoV
YTTT XTTT WTTT VTTT UTTT T
]^ _` a
ba^cd
efg
]^_` a
f` hhc _ijk d lm
ba^cd
efg
]nop q
Fig. 2 Transaction Throughput with “Anticipatory” scheduler with 30 users and 30 warehouses
C benchmark. In the commercial database system, the buffer cache was
to simulate virtual users, the number varying from 10 to 30,
set to 8MB, redo log buffer was 5MB, and the block size was
with 10 to 30 warehouses accordingly. The “Key and Think-
4KB. For logging, we set the behavior to immediately do
ing” time was set to zero in order to get a hot workload.
flushing of the redo log buffer with wait when committing
The mix of the transaction types followed the standards
the transaction. The data file was fixed to a large size in
in [15], that is, “New-Order”: 43.48%, “Payment”: 43.48%,
order to have a better sequential IO performance. All the
“Order-Status”: 4.35%, “Delivery”: 4.35%, “Stock-Level”:
IOs were set to be synchronous IO, but not direct IO since
4.35%. Only the “New-Order” transaction was counted in
we use file system.
the transaction throughput since it is the backbone of the
For MySQL, we installed the InnoDB storage engine. The data buffer pool size was 4MB, log buffer was 2MB, and the block size was 16KB. The block size of MySQL was different from that of the commercial DBMS, because MySQL does not allow us to configure the block size, although 16KB might not be optimal. We also fixed the size of data file instead of “autoextend”. Synchronous IO behavior was chosen. For the flushing method of log, we set it to flush the log at transaction commit; for the flushing of data, we used the synchronous IO. Different file systems have different optimizations on the
workload [15]. Some SSDs do not allow us to disable the cache, so the write-back cache was enabled on each SSD by default.
3. Transaction Throughput We present the transaction throughput by special IO optimization technique. We will examine the following cases: •
Case 1: Data files are hosted on SSD formated with
traditional in-place update file system •
Case 2: Data files are hosted on SSD formated with
log-structured file system
IO. We evaluated two file systems on flash SSD, the con-
We compare the performance in Case 1 and Case 2. The
ventional EXT2 file system and a log-structured file system,
transaction throughput is shown in Fig. 2. We find that the
NILFS2 [7]. For EXT2, we set it with the default block size and group size, that was 4KB blocks and 32K blocks per group. For NILFS2, we set the block size to 4KB too, with 2KB blocks per segments. The segment size is influential to the garbage collection (GC, a.k.a segment cleaning) policy. By default we disabled it for the simplicity of analysis. The “Anticipatory” was chosen as the default IO schedul-
log-structured file system is superior to traditional file system on Mtron SSD, but not outstanding on other SSDs. We think it is due to the different character of each SSD. Section 4. 2 will discuss this point.
4. Performance Analysis In this section, we will analyze the effect of the IO optimization techniques, combined with the prominent perfor-
ing algorithm. The IO scheduling is important for the tra-
mance character of flash SSD.
ditional file system. For the log-structured file system, we
4. 1 IO Optimizations
think it is not necessary to do IO scheduling since the log-
We placed trace points at VFS layer, generic block IO
structured file system has already organized all the writes to
(BIO) layer and IO scheduler layer, as shown in Fig. 3.
sequential writes, while the read, both sequential and ran-
Firstly, we examined the difference by the difference IO opti-
dom, is fast and minor part of IO.
mizations at file system level, that is, the different processing
For the TPC-C benchmark, we started a number of threads
results between the traditional file system and log-structured
25
Database Application
Write
VFS
Read
20
Trace
EXT2 NILFS2 File System File System Address Mapping Layer
15 �
�
��
�
�
10 ��
Generic Block Layer IO Scheduler Layer Device Driver
Device Driver
Hard Disk
Flash SSD
�
Trace 5
Trace
Mtron
Fig. 3 IO path in the Linux kernel of our experiment system
Intel
OCZ
file system. The amount of IOs at the VFS layer is almost identical for the two file system. A comparison between the
EXT2
Intel
NILFS2
EXT2
Mtron
MySQL
NILFS2
EXT2
NILFS2
EXT2
NILFS2
EXT2
NILFS2
EXT2
NILFS2
0
OCZ
Commercial DB
Fig. 4 Ratio between the VFS and generic block layer about the number of requests per transaction
VFS layer and generic block IO layer will tell us the changes
4
after processed by different file systems. Fig. 4 shows the dif-
EXT2
NILFS2
3.5
ference by the number of requests per transaction. Clearly,
3
the number of read requests decreased a lot, due to the hit �
2.5 ��
by file system buffer. A close view about the difference of �
�
�
2 ��
�
writes is shown in Fig. 5, which shows that the number of �
�
�
�
�
1.5
write requests does not change on EXT2, while the num-
1
ber of requests reduces at 2x to 3.5x for NILFS2 in the case
0.5
of MySQL, but it does not vary in the case of Commercial
0
database system. We conjecture that it is due to the differ-
Mtron
ent buffer policy of different storage engine by the database applications. Fig. 6 shows the changes in bytes, which confirms that not only the number of requests, but the total
Intel
OCZ
Mtron
MySQL
Intel
OCZ
Commercial DB
Fig. 5 Ratio between the generic block layer and VFS layer about the number of write request per transaction
amount of reads in bytes are absorbed by the buffer. A close view on writes shown in Fig. 7 tells us that the write amount
18
in bytes are still not changed on EXT2, but it is increased
16
Write Read
14
on NILFS2, especially in the case of commercial database.
12 )
(
Combined with the number changes of the write requests
10
%
&'
#$
!
"
8 ��
�
�
in bytes for commercial database on NILFS2, although the
6
number of write requests is not changed. This shows that
4
We also analyzed the changes processed by the IO scheduler. As for the changes about the number of requests and the amount of bytes, Fig. 8 and Fig. 9 show that none of them has experienced a big change after processed by IO
Mtron
Intel
OCZ
MySQL
Mtron
Intel
EXT2
NILFS2
EXT2
NILFS2
EXT2
NILFS2
EXT2
NILFS2
EXT2
0 NILFS2
More IOs than EXT2 will put the NILFS2 at a disadvantage.
2
EXT2
more writes are added on NILFS2 compared to the EXT2.
NILFS2
shown in Fig. 5, it is clear that each request is enlarged
OCZ
Commercial DB
Fig. 6 Ratio between the VFS and generic block layer about the amount of IOs in bytes per transaction
scheduler, which shows that the requests of transaction processing system are dominated by random requests which cannot be merged significantly. Another function of the IO scheduling is the re-ordering. Fig. 10 shows the address distribution after processed by the IO scheduler. At this time, the sectors are ready for transfer via the device driver. Fig. 10(a) shows that the writes are organized to approximately sequential write on each run for commercial DB on EXT2, noticed that the sequential log
writes are shown both at the top and bottom as a line. The reads are in burst between each run of writes. As comparison, Fig. 10(b) shows the access pattern of commercial DB on NILFS2: the writes are completely linear for all the data, and reads are in burst as well. The address distribution in Figure 10 shows that the writes in the conventional file system are well ordered by the IO
3.5 EXT2
NILFS2
read
12000000
3 ���
write
�� �
2.5 �
10000000
�
�
2 � �
� ��
N
1.5 ��
� �
GF HIJ GG D EF D C
1
� �� �
E
0.5
8000000
L MK
6000000
4000000
0 Mtron
Intel
OCZ
Mtron
MySQL
Intel
OCZ
2000000
Commercial DB 0
Fig. 7 Ratio between the generic block layer and VFS layer about
0
2
4
OPQR STU
6
8
10
the amount of writes in bytes per transaction (a) Commercial DB on EXT2 3 -
Write
,� +�
Read
2.5
*� ' &( )
rstu
ZVVVVVVV
vrwxs
2
# $% �
YWVVVVVV " �" �
1.5 �!
� �
�� �
1 �
�� �
YVVVVVVV j
�� �
a
h ig
cb def cc
0.5
��
XWVVVVVV
` ab
Mtron
Intel
OCZ
Mtron
MySQL
EXT2
Intel
`_
NILFS2
EXT2
NILFS2
EXT2
NILFS2
EXT2
NILFS2
EXT2
NILFS2
EXT2
NILFS2
0
OCZ
XVVVVVVV
WVVVVVV
Commercial DB V
Fig. 8 Ratio between the generic block layer and IO scheduler
V
layer about the number of requests per transaction 3
= 7; ?B @