Utah State University
DigitalCommons@USU All Graduate Theses and Dissertations
Graduate Studies
Spring 2017
An Explanatory Sequential Mixed Methods Study of the School Leaders’ Role in Students’ Mathematics Achievement Through the Lens of Complexity Theory Emma P. Bullock Utah State University
Follow this and additional works at: http://digitalcommons.usu.edu/etd Part of the Curriculum and Instruction Commons, and the Teacher Education and Professional Development Commons Recommended Citation Bullock, Emma P., "An Explanatory Sequential Mixed Methods Study of the School Leaders’ Role in Students’ Mathematics Achievement Through the Lens of Complexity Theory" (2017). All Graduate Theses and Dissertations. 6096. http://digitalcommons.usu.edu/etd/6096
This Dissertation is brought to you for free and open access by the Graduate Studies at DigitalCommons@USU. It has been accepted for inclusion in All Graduate Theses and Dissertations by an authorized administrator of DigitalCommons@USU. For more information, please contact
[email protected].
AN EXPLANATORY SEQUENTIAL MIXED METHODS STUDY OF THE SCHOOL LEADERS’ ROLE IN STUDENTS’ MATHEMATICS ACHIEVEMENT THROUGH THE LENS OF COMPLEXITY THEORY by Emma P. Bullock A dissertation submitted in partial fulfillment of the requirements for the degree of DOCTOR OF PHILOSOPHY in Curriculum and Instruction (Mathematics Education and Leadership) Approved:
Patricia Moyer-Packenham, Ph.D. Major Professor
Beth MacDonald, Ph.D. Committee Member
Susan Turner, Ph.D. Committee Member
Jessica Shumway, Ph.D. Committee Member
Brynja Kohler, Ph.D. Committee Member
Mark R. McLellan, Ph.D. Vice President for Research and Dean of the School of Graduate Studies UTAH STATE UNIVERSITY Logan, Utah 2017
ii
Copyright © Emma P. Bullock 2017 All Right Reserved
iii ABSTRACT An Explanatory Sequential Mixed Methods Study of the School Leaders’ Role in Students’ Mathematics Achievement Through the Lens of Complexity Theory by Emma P. Bullock, Doctor of Philosophy Utah State University, 2017 Major Professor: Patricia Moyer-Packenham, Ph.D. Department: Teacher Education and Leadership School leaders are expected to make decisions that will improve student mathematics achievement. School leaders make decisions in complex adaptive systems (CAS). The purpose of this study was to explore the role the school leader plays in students’ mathematics achievement through the lens of complexity theory. This study employed an explanatory sequential mixed methods design to answer the research questions. The over-arching research question was: What is the school leaders’ role in students’ mathematics achievement? Subquestions included: (1) What characteristics of the school leader are most important in predicting students’ mathematics achievement? (2) What is the relationship between students’ mathematics achievement and characteristics of the school leader? (3) What relationships with stakeholders within each school influences school leaders’ decisions? (4) What decisions and actions are being made by school leaders? and (5) How are school leaders’ decisions and actions associated
iv with students’ mathematics achievement? The researcher collected quantitative survey data from 158 K-12 school leaders to assess the relationship between students’ mathematics achievement and characteristics of the school leader. The researcher further explored the school leaders’ role qualitatively through three focus groups. The focus groups included five school leaders from schools performing higher than their demographics suggest, six school leaders from schools performing about where their demographics suggest, and six school leaders from schools performing lower than their demographics suggest. In the mixed analysis phase, the researcher utilized a complex array of quantitative and qualitative data analysis procedures to draw meta-inferences. The researcher found a significant regression equation predicting the school-wide average SAGE mathematics proficiency scores based on several characteristics of the school leader and student demographics. Distinctive patterns emerged in the decisions and actions made by school leaders based on school-wide SAGE mathematics proficiency. Results suggest that the school leaders’ first role in promoting higher student mathematics achievement is to directly and indirectly facilitate a shared vision of mathematics education between stakeholders in the CAS. The school leader’s second role is to actively work to recruit and retain the highest quality teachers possible. (496 pages)
v PUBLIC ABSTRACT An Explanatory Sequential Mixed Methods Study of the School Leaders’ Role in Students’ Mathematics Achievement Through the Lens of Complexity Theory Emma P. Bullock School leaders are expected to make decisions that improve student mathematics achievement. However, one difficulty for school leaders has been the limited amount of research concerning content-specific (e.g., mathematics) school leadership and its effects on student achievement. School leaders do not make decisions in isolation; rather, they make decisions as part of a complex adaptive system (CAS), as proposed by complexity theory. The purpose of this study was to explore the role the school leader plays in students’ mathematics achievement through the lens of complexity theory. The researcher collected survey data from K-12 school leaders and conducted focus group interviews to answer the research questions. The researcher found a significant regression equation predicting the school-wide average SAGE mathematics proficiency scores based on several characteristics of the school leader and student demographics. Distinctive patterns emerged in the decisions and actions made by school leaders based on school-wide SAGE mathematics proficiency. Results suggest that the school leaders’ first role in promoting higher student mathematics achievement is to directly and indirectly facilitate a shared vision of mathematics education between stakeholders in the CAS. The school leader’s second role is to actively work to recruit and retain the highest quality teachers possible.
vi ACKNOWLEDGMENTS I would like to thank Dr. Patricia Moyer-Packenham for her incredible support throughout my doctoral journey. Without her kind, wise, and rigorous mentorship, I would never have been able to complete this project. I will always strive to model my own mentorship of others after hers. I would also like to especially thank my committee members, Drs. Beth MacDonald, Susan Turner, Jessica Shumway, and Brynja Kohler, for their support and assistance throughout the entire process. I give loving thanks to my husband, Brad Bullock, and children, Kathleen, Lindsay, Hyrum, Mckay, and Rebecca. They are my reason why. Without their patience, encouragement, and moral support, I could never have achieved my dream of a doctoral degree. Also, I give special thanks to my best friend in the whole world, Judy Day, for always being there as a shoulder to cry on and celebrate with. You can do now wrong in my eyes. I give thanks to my Heavenly Father and Jesus Christ. They have always expanded my capacity and carried me when the burden became too heavy. Finally, I thank my extended family, friends, and colleagues. I could not have done it without you. Emma P. Bullock
vii CONTENTS Page ABSTRACT ...................................................................................................................
iii
PUBLIC ABSTRACT ...................................................................................................
v
ACKNOWLEDGMENTS .............................................................................................
vi
LIST OF TABLES .........................................................................................................
ix
LIST OF FIGURES ....................................................................................................... xiii CHAPTER I.
II.
III.
INTRODUCTION .......................................................................................
1
Background of the Problem ......................................................................... Problem Statement ....................................................................................... Significance of the Study ............................................................................. Research Questions ...................................................................................... Summary of Research Design ...................................................................... Assumptions and Scope of Study ................................................................ Definition of Terms......................................................................................
2 4 5 5 6 7 8
LITERATURE REVIEW ............................................................................
10
Complexity Theory ...................................................................................... Influence of Leadership ............................................................................... Role School Leaders Play in Promoting and Influencing Student Mathematics Achievement............................................................... Conceptual Framework ................................................................................ Unique Contributions of the Current Study .................................................
10 18 23 26 28
METHODS ..................................................................................................
30
Research Questions ...................................................................................... Participants and Settings .............................................................................. Procedures .................................................................................................... Data Sources and Instruments ...................................................................... Data Analysis ...............................................................................................
31 32 35 40 42
viii Page IV.
RESULTS ....................................................................................................
51
Quantitative Results ..................................................................................... 51 Qualitative Results ....................................................................................... 84 Mixed Results .............................................................................................. 126 V.
DISCUSSION .............................................................................................. 138 Role the School Leader Plays in Students’ Mathematics Achievement ...... Limitations ................................................................................................... Suggestions for Future Research ................................................................. Conclusion ...................................................................................................
138 156 157 157
REFERENCES .............................................................................................................. 160 APPENDICES ............................................................................................................... 174 Appendix A: Appendix B: Appendix C: Appendix D: Appendix E: Appendix F: Appendix G: Appendix H: Appendix I:
IRB Approval ....................................................................... Survey Informed Consent .................................................... Focus Group Informed Consent ........................................... Revised Principal’s Mathematics Questionnaire ................. Survey Recruitment Email ................................................... Focus Group Recruitment Dialogue .................................... Focus Group Confidentiality Agreement ............................. Focus Group Interview Protocol .......................................... Cronbach Alphas for Revised Principal’s Mathematics Questionnaire ....................................................................... Appendix J: Normality Tests for 30 Most Important Variables ............... Appendix K: Correlations .......................................................................... Appendix L: Descriptive Statistics ............................................................ Appendix M: Multicollinearity Diagnostics...............................................
175 177 181 185 200 202 205 207 210 222 433 437 440
CURRICULUM VITAE ................................................................................................ 443
ix LIST OF TABLES Table
Page
1. School Demographics Represented by Survey Participants ..............................
33
2. School Demographics Represented by Focus Group Participants .....................
35
3. Description of Top 30 Most Important Characteristics of School Leader Variables in Order of Importance in Predicting a School-Wide Average SAGE Mathematics Proficiency Score ..............................................................
54
4. Normality Tests for the Independent Variable ISAM18....................................
57
5. Results of the Correlation Analysis Showing Strong Correlations Between Variables ............................................................................................................
58
6. Results of the Correlation Analysis Showing Moderate Correlations Between Measures .............................................................................................
59
7. Final Multiple Regression Results Showing Predictive Model Based on School Leader Characteristics and Student Demographics ...............................
80
8. Shared Vision of Mathematics Education..........................................................
88
9. Disparate Vision of Mathematics Education (Trying to Move Towards a Shared Vision) ...................................................................................................
93
10. Disparate Vision of Mathematics Education (Minimal Attempts to Move Towards a Shared Vision)..................................................................................
97
11. Types of Common Decisions and Actions Made by School Leaders Across All Groups..........................................................................................................
98
12. Descriptive Statistics of Final Model Variables for Schools Performing Higher Than Their Demographics Suggest........................................................ 128 13. Descriptive Statistics of Final Model Variables for Schools Performing About Where Their Demographics Suggest ...................................................... 129 14. Descriptive Statistics of Final Model Variables for Schools Performing Lower Than Their Demographics Suggest ........................................................ 130
x Table
Page
15. Differences in Decisions and Actions Based On School Performance by School Leaders ................................................................................................... 149 I-1.
Cronbach’s Alpha for Influence on Mathematics Curriculum and Instruction Portion ............................................................................................. 211
I-2.
Corrected Item-Total Correlation and the Effect of Deletion on Cronbach’s Alpha for Influence on Content ......................................................................... 211
I-3.
Corrected Item-Total Correlation and the Effect of Deletion on Cronbach’s Alpha for Influence on Implementation ............................................................. 212
I-4.
Corrected Item-Total Correlation and the Effect of Deletion on Cronbach’s Alpha for Influence on Instructional Methods ................................................... 212
I-5.
Cronbach’s Alpha for Mathematics Curriculum Portion ................................... 213
I-6.
Cronbach’s Alpha for Grades K-4 for Mathematics Teaching and Learning Portion ................................................................................................................ 213
I-7.
Cronbach’s Alpha for Grades 5-9 for Mathematics Teaching and Learning Portion ................................................................................................................ 213
I-8.
Cronbach’s Alpha for Grades 10-12 for Mathematics Teaching and Learning Portion ................................................................................................ 214
I-9.
Cronbach’s Alpha Across Grade Spans with Accompanying Means and Standard Deviations ........................................................................................... 215
I-10.
Cronbach’s Alpha for Supports of Increasing Student Achievement Portion ... 218
I-11.
Corrected-Item Total Correlation, Cronbach’s Alpha if Deleted with Accompanying Means and Standard Deviations for Increasing Student Achievement Portion ......................................................................................... 219
I-12.
Cronbach’s Alpha for Revised 14 Items Across Grades Question for Mathematics Teaching and Learning Portion .................................................... 221
I-13.
Cronbach’s Alpha for Revised 25 Items K-9 Question for Mathematics Teaching and Learning Portion.......................................................................... 221
xi Table
Page
I-14.
Cronbach’s Alpha for Revised 31 Items 10-12 Question for Mathematics Teaching and Learning Portion.......................................................................... 221
I-15.
Cronbach’s Alpha for Revised 21 Items Supports of Increasing Student Achievement Portion ......................................................................................... 221
J-1.
ISAM18: Tests of Normality ............................................................................. 223
J-2.
ISAM12: Tests of Normality ............................................................................. 229
J-3.
Yrs_Last_Teach_Pos: Tests of Normality ......................................................... 235
J-4.
MTL64: Tests of Normality ............................................................................... 258
J-5.
Tot_Yrs_Teach: Tests of Normality .................................................................. 264
J-6.
Inf_Teach3: Tests of Normality ......................................................................... 288
J-7.
Math_Ed: Tests of Normality ............................................................................ 292
J-8.
MTL12: Tests for Normality ............................................................................. 296
J-9.
ISAM3: Tests for Normality .............................................................................. 302
J-10.
MTL35: Tests for Normality ............................................................................. 308
J-11.
Inf_Nat_Org2: Tests for Normality ................................................................... 314
J-12.
ISAM16: Tests for Normality ............................................................................ 321
J-13.
ISAM17: Tests for Normality ............................................................................ 327
J-14.
Fam_PD_CI_Doc: Tests for Normality ............................................................. 333
J-15.
Sec_Ed: Tests for Normality.............................................................................. 340
J-16.
ISAM13: Tests for Normality ............................................................................ 344
J-17.
MTL62: Tests for Normality ............................................................................. 348
J-18.
Age: Tests for Normality ................................................................................... 353
xii Table
Page
J-19.
MTL55: Tests for Normality ............................................................................. 386
J-20.
Gr_T_2: Tests for Normality ............................................................................. 391
J-21.
Sub_T_Elec: Tests for Normality ...................................................................... 394
J-22.
Other_Math: Tests for Normality ...................................................................... 397
J-23.
Inf_State_Leg2: Tests for Normality ................................................................. 400
J-24.
Sub_T_H_SS: Tests for Normality .................................................................... 407
J-25.
Saxon_Math: Tests for Normality ..................................................................... 410
J-26.
Gr_T_K: Tests for Normality ............................................................................ 413
J-27.
MTL36: Tests for Normality ............................................................................. 416
J-28.
MTL44: Tests for Normality ............................................................................. 420
J-29.
Coll_Alg: Tests for Normality ........................................................................... 426
J-30.
MTL39: Tests for Normality ............................................................................. 429
K-1.
Correlations Among the 30 Most Important Variables and the Independent Variable to Be Used in the Network Analysis ................................................... 436
K-2.
Key to Table K-1 ............................................................................................... 437
L-1.
Descriptive Statistics of Top 30 Most Important Characteristics of School Leader Variables in Order of Importance in Predicting a School-Wide Average 2015 SAGE Mathematics Proficiency Score ...................................... 440
M-1.
Coefficients ........................................................................................................ 443
M-2.
Eigenvalues ........................................................................................................ 444
xiii LIST OF FIGURES Figure
Page
1. Conceptual framework of school leadership in a complex adaptive system (SL-CAS) ........................................................................................................
27
2. Explanatory sequential mixed methods design ...............................................
31
3. Example of %IncMSE variable importance plot ............................................
45
4. %IncMSE variable importance plot ................................................................
52
5. Network analysis.............................................................................................
67
6. Post-hoc regression analysis of collinearity diagnostics................................. 70 7. Correlation analysis without involvement of dependent variable...................
72
8. Standardized residual plot against interaction variable (Inf_State_Leg2*MTL39)...............................................................................
74
9. Standardized residual plot against interaction variable (Math_Ed*MTL62) .
75
10. Normal P-P plot ..............................................................................................
76
11. Histogram showing the standardized residuals to the 2015 SAGE schoolwide average mathematics proficiency scores ................................................
77
12. Spread of residuals over the range of interaction for Inf_State_Leg2_MTL39 .................................................................................
78
13. Spread of residuals over the range of interaction for Math_Ed_MTL62........
79
14. Interaction effects of school leaders’ perceptions of the influence of the state legislature on the mathematics curriculum and the school leaders’ belief in the value of cooperative work on school-wide average sage mathematics proficiency scores ......................................................................
81
15. Comparison of school-wide average SAGE mathematics proficiency scores between school leaders with or without a mathematics education degree to agreement with beliefs about geometry and measurement as foundations for algebra in grades 10-12 .............................................................................
82
xiv Figure
Page
16. Relationships with stakeholders and school leaders in schools performing higher than their demographics suggest ..........................................................
85
17. Relationships with stakeholders and school leaders in schools who are performing about where their demographics suggest .....................................
89
18. Relationships with stakeholders and school leaders in schools who are performing lower than what their demographics suggest ...............................
94
19. Conceptual framework of school leadership in a complex adaptive system .. 139 J-1. Frequency by 2015 SAGE % Mathematics Proficiency for ISAM18 = 1 ...... 223 J-2. Frequency by 2015 SAGE % Mathematics Proficiency for ISAM18 = 2 ...... 224 J-3. Frequency by 2015 SAGE % Mathematics Proficiency for ISAM18 = 3 ...... 224 J-4. Frequency by 2015 SAGE % Mathematics Proficiency for ISAM18 = 4 ...... 225 J-5. Frequency by 2015 SAGE % Mathematics Proficiency for ISAM18 = 5 ...... 225 J-6. Normal Q-Q Plot of 2015 SAGE % Mathematics Proficiency for ISAM18 = 1 .................................................................................................... 226 J-7. Normal Q-Q Plot of 2015 SAGE % Mathematics Proficiency for ISAM18 = 2 .................................................................................................... 226 J-8. Normal Q-Q Plot of 2015 SAGE % Mathematics Proficiency for ISAM18 = 3 .................................................................................................... 227 J-9. Normal Q-Q Plot of 2015 SAGE % Mathematics Proficiency for ISAM18 = 4 .................................................................................................... 227 J-10. Normal Q-Q Plot of 2015 SAGE % Mathematics Proficiency for ISAM18 = 5 .................................................................................................... 228 J-11. Boxplot of 2015 SAGE % Mathematics Proficiency for ISAM18 ................. 228 J-12. Frequency by 2015 SAGE % Mathematics Proficiency for ISAM12 = 1 ...... 229 J-13. Frequency by 2015 SAGE % Mathematics Proficiency for ISAM12 = 2 ...... 230
xv Figure
Page
J-14. Frequency by 2015 SAGE % Mathematics Proficiency for ISAM12 = 3 ...... 230 J-15. Frequency by 2015 SAGE % Mathematics Proficiency for ISAM12 = 4 ...... 231 J-16. Frequency by 2015 SAGE % Mathematics Proficiency for ISAM12 = 5 ...... 231 J-17. Normal Q-Q Plot of 2015 SAGE % Mathematics Proficiency for ISAM12 = 1 .................................................................................................... 232 J-18. Normal Q-Q Plot of 2015 SAGE % Mathematics Proficiency for ISAM12 = 2 .................................................................................................... 232 J-19. Normal Q-Q Plot of 2015 SAGE % Mathematics Proficiency for ISAM12 = 3 .................................................................................................... 233 J-20. Normal Q-Q Plot of 2015 SAGE % Mathematics Proficiency for ISAM12 = 4 .................................................................................................... 233 J-21. Normal Q-Q Plot of 2015 SAGE % Mathematics Proficiency for ISAM12 = 5 .................................................................................................... 234 J-22. Boxplot of 2015 SAGE % Mathematics Proficiency for ISAM12 ................. 234 J-23. Frequency by 2015 SAGE % Mathematics Proficiency for Yrs_Last_Teach_Pos = 0 ................................................................................ 236 J-24. Frequency by 2015 SAGE % Mathematics Proficiency for Yrs_Last_Teach_Pos = 2 ................................................................................ 236 J-25. Frequency by 2015 SAGE % Mathematics Proficiency for Yrs_Last_Teach_Pos = 3 ................................................................................ 237 J-26. Frequency by 2015 SAGE % Mathematics Proficiency for Yrs_Last_Teach_Pos = 4 ................................................................................ 237 J-27. Frequency by 2015 SAGE % Mathematics Proficiency for Yrs_Last_Teach_Pos = 5 ................................................................................ 238 J-28. Frequency by 2015 SAGE % Mathematics Proficiency for Yrs_Last_Teach_Pos = 6 ................................................................................ 238
xvi Figure
Page
J-29. Frequency by 2015 SAGE % Mathematics Proficiency for Yrs_Last_Teach_Pos = 7 ................................................................................ 239 J-30. Frequency by 2015 SAGE % Mathematics Proficiency for Yrs_Last_Teach_Pos = 8 ................................................................................ 239 J-31. Frequency by 2015 SAGE % Mathematics Proficiency for Yrs_Last_Teach_Pos = 9 ................................................................................ 240 J-32. Frequency by 2015 SAGE % Mathematics Proficiency for Yrs_Last_Teach_Pos = 10 .............................................................................. 240 J-33. Frequency by 2015 SAGE % Mathematics Proficiency for Yrs_Last_Teach_Pos = 11 .............................................................................. 241 J-34. Frequency by 2015 SAGE % Mathematics Proficiency for Yrs_Last_Teach_Pos = 12 .............................................................................. 241 J-35. Frequency by 2015 SAGE % Mathematics Proficiency for Yrs_Last_Teach_Pos = 13 .............................................................................. 242 J-36. Frequency by 2015 SAGE % Mathematics Proficiency for Yrs_Last_Teach_Pos = 15 .............................................................................. 242 J-37. Frequency by 2015 SAGE % Mathematics Proficiency for Yrs_Last_Teach_Pos = 17 .............................................................................. 243 J-38. Frequency by 2015 SAGE % Mathematics Proficiency for Yrs_Last_Teach_Pos = 18 .............................................................................. 243 J-39. Frequency by 2015 SAGE % Mathematics Proficiency for Yrs_Last_Teach_Pos = 19 .............................................................................. 244 J-40. Frequency by 2015 SAGE % Mathematics Proficiency for Yrs_Last_Teach_Pos = 20 .............................................................................. 244 J-41. Frequency by 2015 SAGE % Mathematics Proficiency for Yrs_Last_Teach_Pos = 21 .............................................................................. 245 J-42. Frequency by 2015 SAGE % Mathematics Proficiency for Yrs_Last_Teach_Pos = 22 .............................................................................. 245
xvii Figure
Page
J-43. Frequency by 2015 SAGE % Mathematics Proficiency for Yrs_Last_Teach_Pos = 24 .............................................................................. 246 J-44. Normal Q-Q Plot of 2015 SAGE % Mathematics Proficiency for Yrs_Last_Teach_Pos = 0 ................................................................................ 246 J-45. Normal Q-Q Plot of 2015 SAGE % Mathematics Proficiency for Yrs_Last_Teach_Pos = 2 ................................................................................ 247 J-46. Normal Q-Q Plot of 2015 SAGE % Mathematics Proficiency for Yrs_Last_Teach_Pos = 3 ................................................................................ 247 J-47. Normal Q-Q Plot of 2015 SAGE % Mathematics Proficiency for Yrs_Last_Teach_Pos = 4 ................................................................................ 248 J-48. Normal Q-Q Plot of 2015 SAGE % Mathematics Proficiency for Yrs_Last_Teach_Pos = 5 ................................................................................ 248 J-49. Normal Q-Q Plot of 2015 SAGE % Mathematics Proficiency for Yrs_Last_Teach_Pos = 6 ................................................................................ 249 J-50. Normal Q-Q Plot of 2015 SAGE % Mathematics Proficiency for Yrs_Last_Teach_Pos = 7 ................................................................................ 249 J-51. Normal Q-Q Plot of 2015 SAGE % Mathematics Proficiency for Yrs_Last_Teach_Pos = 8 ................................................................................ 250 J-52. Normal Q-Q Plot of 2015 SAGE % Mathematics Proficiency for Yrs_Last_Teach_Pos = 9 ................................................................................ 250 J-53. Normal Q-Q Plot of 2015 SAGE % Mathematics Proficiency for Yrs_Last_Teach_Pos = 10 .............................................................................. 251 J-54. Normal Q-Q Plot of 2015 SAGE % Mathematics Proficiency for Yrs_Last_Teach_Pos = 11 .............................................................................. 251 J-55. Normal Q-Q Plot of 2015 SAGE % Mathematics Proficiency for Yrs_Last_Teach_Pos = 12 .............................................................................. 252 J-56. Normal Q-Q Plot of 2015 SAGE % Mathematics Proficiency for Yrs_Last_Teach_Pos = 13 .............................................................................. 253
xviii Figure
Page
J-57. Normal Q-Q Plot of 2015 SAGE % Mathematics Proficiency for Yrs_Last_Teach_Pos = 15 .............................................................................. 253 J-58. Normal Q-Q Plot of 2015 SAGE % Mathematics Proficiency for Yrs_Last_Teach_Pos = 17 .............................................................................. 254 J-59. Normal Q-Q Plot of 2015 SAGE % Mathematics Proficiency for Yrs_Last_Teach_Pos = 18 .............................................................................. 254 J-60. Normal Q-Q Plot of 2015 SAGE % Mathematics Proficiency for Yrs_Last_Teach_Pos = 19 .............................................................................. 255 J-61. Normal Q-Q Plot of 2015 SAGE % Mathematics Proficiency for Yrs_Last_Teach_Pos = 20 .............................................................................. 255 J-62. Normal Q-Q Plot of 2015 SAGE % Mathematics Proficiency for Yrs_Last_Teach_Pos = 21 .............................................................................. 256 J-63. Normal Q-Q Plot of 2015 SAGE % Mathematics Proficiency for Yrs_Last_Teach_Pos = 22 .............................................................................. 256 J-64. Normal Q-Q Plot of 2015 SAGE % Mathematics Proficiency for Yrs_Last_Teach_Pos = 24 .............................................................................. 257 J-65. Boxplot of 2015 SAGE % Mathematics Proficiency for Yrs_Last_Teach_Pos ...................................................................................... 257 J-66. Frequency by 2015 SAGE % Mathematics Proficiency for MTL64 = 1 ....... 258 J-67. Frequency by 2015 SAGE % Mathematics Proficiency for MTL64 = 2 ....... 259 J-68. Frequency by 2015 SAGE % Mathematics Proficiency for MTL64 = 3 ....... 259 J-69. Frequency by 2015 SAGE % Mathematics Proficiency for MTL64 = 4 ....... 260 J-70. Frequency by 2015 SAGE % Mathematics Proficiency for MTL64 = 5 ....... 260 J-71. Normal Q-Q Plot of 2015 SAGE % Mathematics Proficiency for MTL64 = 1 ...................................................................................................... 261 J-72. Normal Q-Q Plot of 2015 SAGE % Mathematics Proficiency for MTL64 = 2 ...................................................................................................... 261
xix Figure
Page
J-73. Normal Q-Q Plot of 2015 SAGE % Mathematics Proficiency for MTL64 = 3 ...................................................................................................... 262 J-74. Normal Q-Q Plot of 2015 SAGE % Mathematics Proficiency for MTL64 = 4 ...................................................................................................... 262 J-75. Normal Q-Q Plot of 2015 SAGE % Mathematics Proficiency for MTL64 = 5 ...................................................................................................... 263 J-76. Boxplot of 2015 SAGE % Mathematics Proficiency for MTL64 .................. 263 J-77. Frequency by 2015 SAGE % Mathematics Proficiency for Tot_Yrs_Teach = 0 ......................................................................................... 265 J-78. Frequency by 2015 SAGE % Mathematics Proficiency for Tot_Yrs_Teach = 3 ......................................................................................... 265 J-79. Frequency by 2015 SAGE % Mathematics Proficiency for Tot_Yrs_Teach = 4 ......................................................................................... 266 J-80. Frequency by 2015 SAGE % Mathematics Proficiency for Tot_Yrs_Teach = 5 ......................................................................................... 266 J-81. Frequency by 2015 SAGE % Mathematics Proficiency for Tot_Yrs_Teach = 6 ......................................................................................... 267 J-82. Frequency by 2015 SAGE % Mathematics Proficiency for Tot_Yrs_Teach = 7 ......................................................................................... 267 J-83. Frequency by 2015 SAGE % Mathematics Proficiency for Tot_Yrs_Teach = 8 ......................................................................................... 268 J-84. Frequency by 2015 SAGE % Mathematics Proficiency for Tot_Yrs_Teach = 9 ......................................................................................... 268 J-85. Frequency by 2015 SAGE % Mathematics Proficiency for Tot_Yrs_Teach = 10 ....................................................................................... 269 J-86. Frequency by 2015 SAGE % Mathematics Proficiency for Tot_Yrs_Teach = 11 ....................................................................................... 269
xx Figure
Page
J-87. Frequency by 2015 SAGE % Mathematics Proficiency for Tot_Yrs_Teach = 12 ....................................................................................... 270 J-88. Frequency by 2015 SAGE % Mathematics Proficiency for Tot_Yrs_Teach = 13 ....................................................................................... 270 J-89. Frequency by 2015 SAGE % Mathematics Proficiency for Tot_Yrs_Teach = 14 ....................................................................................... 271 J-90. Frequency by 2015 SAGE % Mathematics Proficiency for Tot_Yrs_Teach = 15 ....................................................................................... 271 J-91. Frequency by 2015 SAGE % Mathematics Proficiency for Tot_Yrs_Teach = 16 ....................................................................................... 272 J-92. Frequency by 2015 SAGE % Mathematics Proficiency for Tot_Yrs_Teach = 17 ....................................................................................... 272 J-93. Frequency by 2015 SAGE % Mathematics Proficiency for Tot_Yrs_Teach = 18 ....................................................................................... 273 J-94. Frequency by 2015 SAGE % Mathematics Proficiency for Tot_Yrs_Teach = 19 ....................................................................................... 273 J-95. Frequency by 2015 SAGE % Mathematics Proficiency for Tot_Yrs_Teach = 20 ....................................................................................... 274 J-96. Frequency by 2015 SAGE % Mathematics Proficiency for Tot_Yrs_Teach = 22 ....................................................................................... 274 J-97. Frequency by 2015 SAGE % Mathematics Proficiency for Tot_Yrs_Teach =24 ........................................................................................ 275 J-98. Frequency by 2015 SAGE % Mathematics Proficiency for Tot_Yrs_Teach = 29 ....................................................................................... 275 J-99. Normal Q-Q Plot of 2015 SAGE % Mathematics Proficiency for Tot_Yrs_Teach = 0 ......................................................................................... 276 J-100. Normal Q-Q Plot of 2015 SAGE % Mathematics Proficiency for Tot_Yrs_Teach = 3 ......................................................................................... 276
xxi Figure
Page
J-101. Normal Q-Q Plot of 2015 SAGE % Mathematics Proficiency for Tot_Yrs_Teach = 4 ......................................................................................... 277 J-102. Normal Q-Q Plot of 2015 SAGE % Mathematics Proficiency for Tot_Yrs_Teach = 5 ......................................................................................... 277 J-103. Normal Q-Q Plot of 2015 SAGE % Mathematics Proficiency for Tot_Yrs_Teach = 6 ......................................................................................... 278 J-104. Normal Q-Q Plot of 2015 SAGE % Mathematics Proficiency for Tot_Yrs_Teach = 7 ......................................................................................... 278 J-105. Normal Q-Q Plot of 2015 SAGE % Mathematics Proficiency for Tot_Yrs_Teach = 8 ......................................................................................... 279 J-106. Normal Q-Q Plot of 2015 SAGE % Mathematics Proficiency for Tot_Yrs_Teach = 9 ......................................................................................... 279 J-107. Normal Q-Q Plot of 2015 SAGE % Mathematics Proficiency for Tot_Yrs_Teach = 10 ....................................................................................... 280 J-108. Normal Q-Q Plot of 2015 SAGE % Mathematics Proficiency for Tot_Yrs_Teach = 11 ....................................................................................... 280 J-109. Normal Q-Q Plot of 2015 SAGE % Mathematics Proficiency for Tot_Yrs_Teach = 12 ....................................................................................... 281 J-110. Normal Q-Q Plot of 2015 SAGE % Mathematics Proficiency for Tot_Yrs_Teach = 13 ....................................................................................... 281 J-111. Normal Q-Q Plot of 2015 SAGE % Mathematics Proficiency for Tot_Yrs_Teach = 14 ....................................................................................... 282 J-112. Normal Q-Q Plot of 2015 SAGE % Mathematics Proficiency for Tot_Yrs_Teach = 15 ....................................................................................... 282 J-113. Normal Q-Q Plot of 2015 SAGE % Mathematics Proficiency for Tot_Yrs_Teach = 16 ....................................................................................... 283 J-114. Normal Q-Q Plot of 2015 SAGE % Mathematics Proficiency for Tot_Yrs_Teach = 17 ....................................................................................... 283
xxii Figure
Page
J-115. Normal Q-Q Plot of 2015 SAGE % Mathematics Proficiency for Tot_Yrs_Teach = 18 ....................................................................................... 284 J-116. Normal Q-Q Plot of 2015 SAGE % Mathematics Proficiency for Tot_Yrs_Teach = 19 ....................................................................................... 284 J-117. Normal Q-Q Plot of 2015 SAGE % Mathematics Proficiency for Tot_Yrs_Teach = 20 ....................................................................................... 285 J-118. Normal Q-Q Plot of 2015 SAGE % Mathematics Proficiency for Tot_Yrs_Teach = 22 ....................................................................................... 285 J-119. Normal Q-Q Plot of 2015 SAGE % Mathematics Proficiency for Tot_Yrs_Teach = 24 ....................................................................................... 286 J-120. Normal Q-Q Plot of 2015 SAGE % Mathematics Proficiency for Tot_Yrs_Teach = 29 ....................................................................................... 286 J-121. Boxplot of 2015 SAGE % Mathematics Proficiency for Tot_Yrs_Teach ...... 287 J-122. Frequency by 2015 SAGE % Mathematics Proficiency for Inf_Teach3 = 3 . 288 J-123. Frequency by 2015 SAGE % Mathematics Proficiency for Inf_Teach3 = 5 . 289 J-124. Frequency by 2015 SAGE % Mathematics Proficiency for Inf_Teach3 = 6 . 289 J-125. Normal Q-Q Plot of 2015 SAGE % Mathematics Proficiency for Inf_Teach3 = 3 ................................................................................................ 290 J-126. Normal Q-Q Plot of 2015 SAGE % Mathematics Proficiency for Inf_Teach3 = 5 ................................................................................................ 290 J-127. Normal Q-Q Plot of 2015 SAGE % Mathematics Proficiency for Inf_Teach3 = 6 ................................................................................................ 291 J-128. Boxplot of 2015 SAGE % Mathematics Proficiency for Inf_Teach3 ............ 291 J-129. Frequency by 2015 SAGE % Mathematics Proficiency for Math_Ed = No .. 292 J-130. Frequency by 2015 SAGE % Mathematics Proficiency for Math_Ed = Yes, Minor/Sp.Emphasis ............................................................. 293
xxiii Figure
Page
J-131. Frequency by 2015 SAGE % Mathematics Proficiency for Math_Ed = Yes, Major ................................................................................... 293 J-132. Normal Q-Q Plot of 2015 SAGE % Mathematics Proficiency for Math_Ed = No ................................................................................................ 294 J-133. Normal Q-Q Plot of 2015 SAGE % Mathematics Proficiency for Math_Ed = Yes, Minor/Sp.Emphasis ............................................................. 294 J-134. Normal Q-Q Plot of 2015 SAGE % Mathematics Proficiency for Math_Ed = Yes, Major ................................................................................... 295 J-135. Boxplot of 2015 SAGE % Mathematics Proficiency for Math_Ed ................ 295 J-136. Frequency by 2015 SAGE % Mathematics Proficiency for MTL12 = 1 ....... 296 J-137. Frequency by 2015 SAGE % Mathematics Proficiency for MTL12 = 2 ....... 297 J-138. Frequency by 2015 SAGE % Mathematics Proficiency for MTL12 = 3 ....... 297 J-139. Frequency by 2015 SAGE % Mathematics Proficiency for MTL12 = 4 ....... 298 J-140. Frequency by 2015 SAGE % Mathematics Proficiency for MTL12 = 5 ....... 298 J-141. Normal Q-Q Plot of 2015 SAGE % Mathematics Proficiency for MTL12 = 1 ...................................................................................................... 299 J-142. Normal Q-Q Plot of 2015 SAGE % Mathematics Proficiency for MTL12 = 2 ...................................................................................................... 299 J-143. Normal Q-Q Plot of 2015 SAGE % Mathematics Proficiency for MTL12 = 3 ...................................................................................................... 300 J-144. Normal Q-Q Plot of 2015 SAGE % Mathematics Proficiency for MTL12 = 4 ...................................................................................................... 300 J-145. Normal Q-Q Plot of 2015 SAGE % Mathematics Proficiency for MTL12 = 5 ...................................................................................................... 301 J-146. Boxplot of 2015 SAGE % Mathematics Proficiency for MTL12 .................. 301 J-147. Frequency by 2015 SAGE % Mathematics Proficiency for ISAM3 = 1 ........ 302
xxiv Figure
Page
J-148. Frequency by 2015 SAGE % Mathematics Proficiency for ISAM3 = 2 ........ 303 J-149. Frequency by 2015 SAGE % Mathematics Proficiency for ISAM3 = 3 ........ 303 J-150. Frequency by 2015 SAGE % Mathematics Proficiency for ISAM3 = 4 ........ 304 J-151. Frequency by 2015 SAGE % Mathematics Proficiency for ISAM3 = 5 ........ 304 J-152. Normal Q-Q Plot of 2015 SAGE % Mathematics Proficiency for ISAM3 = 1 ...................................................................................................... 305 J-153. Normal Q-Q Plot of 2015 SAGE % Mathematics Proficiency for ISAM3 = 2 ...................................................................................................... 305 J-154. Normal Q-Q Plot of 2015 SAGE % Mathematics Proficiency for ISAM3 = 3 ...................................................................................................... 306 J-155. Normal Q-Q Plot of 2015 SAGE % Mathematics Proficiency for ISAM3 = 4 ...................................................................................................... 306 J-156. Normal Q-Q Plot of 2015 SAGE % Mathematics Proficiency for ISAM3 = 5 ...................................................................................................... 307 J-157. Boxplot of 2015 SAGE % Mathematics Proficiency for ISAM3 ................... 307 J-158. Frequency by 2015 SAGE % Mathematics Proficiency for MTL35 = 1 ....... 308 J-159. Frequency by 2015 SAGE % Mathematics Proficiency for MTL35 = 2 ....... 309 J-160. Frequency by 2015 SAGE % Mathematics Proficiency for MTL35 = 3 ....... 309 J-161. Frequency by 2015 SAGE % Mathematics Proficiency for MTL35 = 4 ....... 310 J-162. Frequency by 2015 SAGE % Mathematics Proficiency for MTL35 = 5 ....... 310 J-163. Normal Q-Q Plot of 2015 SAGE % Mathematics Proficiency for MTL35 = 1 ...................................................................................................... 311 J-164. Normal Q-Q Plot of 2015 SAGE % Mathematics Proficiency for MTL35 = 2 ...................................................................................................... 311
xxv Figure
Page
J-165. Normal Q-Q Plot of 2015 SAGE % Mathematics Proficiency for MTL35 = 3 ...................................................................................................... 312 J-166. Normal Q-Q Plot of 2015 SAGE % Mathematics Proficiency for MTL35 = 4 ...................................................................................................... 312 J-167. Normal Q-Q Plot of 2015 SAGE % Mathematics Proficiency for MTL35 = 5 ...................................................................................................... 313 J-168. Boxplot of 2015 SAGE % Mathematics Proficiency for MTL35 .................. 313 J-169. Frequency by 2015 SAGE % Mathematics Proficiency for Inf_Nat_Org2= 1............................................................................................. 314 J-170. Frequency by 2015 SAGE % Mathematics Proficiency for Inf_Nat_Org2= 2............................................................................................. 315 J-171. Frequency by 2015 SAGE % Mathematics Proficiency for Inf_Nat_Org2= 3............................................................................................. 315 J-172. Frequency by 2015 SAGE % Mathematics Proficiency for Inf_Nat_Org2= 4............................................................................................. 316 J-173. Frequency by 2015 SAGE % Mathematics Proficiency for Inf_Nat_Org2= 5............................................................................................. 316 J-174. Frequency by 2015 SAGE % Mathematics Proficiency for I nf_Nat_Org2= 6 .............................................................................................. 317 J-175. Normal Q-Q Plot of 2015 SAGE % Mathematics Proficiency for Inf_Nat_Org2 = 1............................................................................................ 317 J-176. Normal Q-Q Plot of 2015 SAGE % Mathematics Proficiency for Inf_Nat_Org2 = 2............................................................................................ 318 J-177. Normal Q-Q Plot of 2015 SAGE % Mathematics Proficiency for Inf_Nat_Org2 = 3............................................................................................ 318 J-178. Normal Q-Q Plot of 2015 SAGE % Mathematics Proficiency for Inf_Nat_Org2 = 4............................................................................................ 319
xxvi Figure
Page
J-179. Normal Q-Q Plot of 2015 SAGE % Mathematics Proficiency for Inf_Nat_Org2 = 5............................................................................................ 319 J-180. Normal Q-Q Plot of 2015 SAGE % Mathematics Proficiency for Inf_Nat_Org2 = 6............................................................................................ 320 J-181. Boxplot of 2015 SAGE % Mathematics Proficiency for Inf_Nat_Org2 ........ 320 J-182. Frequency by 2015 SAGE % Mathematics Proficiency for ISAM16= 1 ....... 321 J-183. Frequency by 2015 SAGE % Mathematics Proficiency for ISAM16= 2 ....... 322 J-184. Frequency by 2015 SAGE % Mathematics Proficiency for ISAM16= 3 ....... 322 J-185. Frequency by 2015 SAGE % Mathematics Proficiency for ISAM16= 4 ....... 323 J-186. Frequency by 2015 SAGE % Mathematics Proficiency for ISAM16= 5 ....... 323 J-187. Normal Q-Q Plot of 2015 SAGE % Mathematics Proficiency for ISAM16 = 1 .................................................................................................... 324 J-188. Normal Q-Q Plot of 2015 SAGE % Mathematics Proficiency for ISAM16 = 2 .................................................................................................... 324 J-189. Normal Q-Q Plot of 2015 SAGE % Mathematics Proficiency for ISAM16 = 3 .................................................................................................... 325 J-190. Normal Q-Q Plot of 2015 SAGE % Mathematics Proficiency for ISAM16 = 4 .................................................................................................... 325 J-191. Normal Q-Q Plot of 2015 SAGE % Mathematics Proficiency for ISAM16 = 5 .................................................................................................... 326 J-192. Boxplot of 2015 SAGE % Mathematics Proficiency for ISAM16 ................. 326 J-193. Frequency by 2015 SAGE % Mathematics Proficiency for ISAM17= 1 ....... 327 J-194. Frequency by 2015 SAGE % Mathematics Proficiency for ISAM17= 2 ....... 328 J-195. Frequency by 2015 SAGE % Mathematics Proficiency for ISAM17= 3 ....... 328 J-196. Frequency by 2015 SAGE % Mathematics Proficiency for ISAM17= 4 ....... 329
xxvii Figure
Page
J-197. Frequency by 2015 SAGE % Mathematics Proficiency for ISAM17= 5 ....... 329 J-198. Normal Q-Q Plot of 2015 SAGE % Mathematics Proficiency for ISAM17 = 1 .................................................................................................... 330 J-199. Normal Q-Q Plot of 2015 SAGE % Mathematics Proficiency for ISAM17 = 2 .................................................................................................... 330 J-200. Normal Q-Q Plot of 2015 SAGE % Mathematics Proficiency for ISAM17 = 3 .................................................................................................... 331 J-201. Normal Q-Q Plot of 2015 SAGE % Mathematics Proficiency for ISAM17 = 4 .................................................................................................... 331 J-202. Normal Q-Q Plot of 2015 SAGE % Mathematics Proficiency for ISAM17 = 5 .................................................................................................... 332 J-203. Boxplot of 2015 SAGE % Mathematics Proficiency for ISAM17 ................. 332 J-204. Frequency by 2015 SAGE % Mathematics Proficiency for Fam_PD_CI_Doc = 1 ..................................................................................... 333 J-205. Frequency by 2015 SAGE % Mathematics Proficiency for Fam_PD_CI_Doc = 2 ..................................................................................... 334 J-206. Frequency by 2015 SAGE % Mathematics Proficiency for Fam_PD_CI_Doc = 3 ..................................................................................... 334 J-207. Frequency by 2015 SAGE % Mathematics Proficiency for Fam_PD_CI_Doc = 4 ..................................................................................... 335 J-208. Frequency by 2015 SAGE % Mathematics Proficiency for Fam_PD_CI_Doc = 5 ..................................................................................... 335 J-209. Frequency by 2015 SAGE % Mathematics Proficiency for Fam_PD_CI_Doc = 6 ..................................................................................... 336 J-210. Normal Q-Q Plot of 2015 SAGE % Mathematics Proficiency for Fam_PD_CI_Doc = 1 ..................................................................................... 336 J-211. Normal Q-Q Plot of 2015 SAGE % Mathematics Proficiency for Fam_PD_CI_Doc = 2 ..................................................................................... 337
xxviii Figure
Page
J-212. Normal Q-Q Plot of 2015 SAGE % Mathematics Proficiency for Fam_PD_CI_Doc = 3 ..................................................................................... 337 J-213. Normal Q-Q Plot of 2015 SAGE % Mathematics Proficiency for Fam_PD_CI_Doc = 4 ..................................................................................... 338 J-214. Normal Q-Q Plot of 2015 SAGE % Mathematics Proficiency for Fam_PD_CI_Doc = 5 ..................................................................................... 338 J-215. Normal Q-Q Plot of 2015 SAGE % Mathematics Proficiency for Fam_PD_CI_Doc = 6 ..................................................................................... 339 J-216. Boxplot of 2015 SAGE % Mathematics Proficiency for Fam_PD_CI_Doc .. 339 J-217. Frequency by 2015 SAGE % Mathematics Proficiency for Sec_Ed= No ...... 340 J-218. Frequency by 2015 SAGE % Mathematics Proficiency for Sec_Ed = Yes, Minor/Sp.Emphasis ................................................................ 341 J-219. Frequency by 2015 SAGE % Mathematics Proficiency for Sec_Ed = Yes, Major ...................................................................................... 341 J-220. Normal Q-Q Plot of 2015 SAGE % Mathematics Proficiency for Sec_Ed = No ................................................................................................... 342 J-221. Normal Q-Q Plot of 2015 SAGE % Mathematics Proficiency for Sec_Ed = Yes, Minor/Sp.Emphasis ................................................................ 342 J-222. Normal Q-Q Plot of 2015 SAGE % Mathematics Proficiency for Sec_Ed = Yes, Major ...................................................................................... 343 J-223. Boxplot of 2015 SAGE % Mathematics Proficiency for Sec_Ed................... 343 J-224. Frequency by 2015 SAGE % Mathematics Proficiency for ISAM13= 3 ....... 344 J-225. Frequency by 2015 SAGE % Mathematics Proficiency for ISAM13= 4 ....... 345 J-226. Frequency by 2015 SAGE % Mathematics Proficiency for ISAM13= 5 ....... 345 J-227. Normal Q-Q Plot of 2015 SAGE % Mathematics Proficiency for ISAM13 = 3 .................................................................................................... 346
xxix Figure
Page
J-228. Normal Q-Q Plot of 2015 SAGE % Mathematics Proficiency for ISAM13 = 4 .................................................................................................... 346 J-229. Normal Q-Q Plot of 2015 SAGE % Mathematics Proficiency for ISAM13 = 5 .................................................................................................... 347 J-230. Boxplot of 2015 SAGE % Mathematics Proficiency for ISAM13 ................. 347 J-231. Frequency by 2015 SAGE % Mathematics Proficiency for MTL62= 2 ........ 348 J-232. Frequency by 2015 SAGE % Mathematics Proficiency for MTL62= 3 ........ 349 J-233. Frequency by 2015 SAGE % Mathematics Proficiency for MTL62= 4 ........ 349 J-234. Frequency by 2015 SAGE % Mathematics Proficiency for MTL62= 5 ........ 350 J-235. Normal Q-Q Plot of 2015 SAGE % Mathematics Proficiency for MTL62 = 2 ...................................................................................................... 350 J-236. Normal Q-Q Plot of 2015 SAGE % Mathematics Proficiency for MTL62 = 3 ...................................................................................................... 351 J-237. Normal Q-Q Plot of 2015 SAGE % Mathematics Proficiency for MTL62 = 4 ...................................................................................................... 351 J-238. Normal Q-Q Plot of 2015 SAGE % Mathematics Proficiency for MTL62 = 5 ...................................................................................................... 352 J-239. Boxplot of 2015 SAGE % Mathematics Proficiency for MTL62 .................. 352 J-240. Frequency by 2015 SAGE % Mathematics Proficiency for Age= 34 ............ 354 J-241. Frequency by 2015 SAGE % Mathematics Proficiency for Age = 36 ........... 354 J-242. Frequency by 2015 SAGE % Mathematics Proficiency for Age = 37 ........... 355 J-243. Frequency by 2015 SAGE % Mathematics Proficiency for Age = 38 ........... 355 J-244. Frequency by 2015 SAGE % Mathematics Proficiency for Age = 39 ........... 356 J-245. Frequency by 2015 SAGE % Mathematics Proficiency for Age = 40 ........... 356
xxx Figure
Page
J-246. Frequency by 2015 SAGE % Mathematics Proficiency for Age = 41 ........... 357 J-247. Frequency by 2015 SAGE % Mathematics Proficiency for Age = 42 ........... 357 J-248. Frequency by 2015 SAGE % Mathematics Proficiency for Age = 43 ........... 358 J-249. Frequency by 2015 SAGE % Mathematics Proficiency for Age = 44 ........... 358 J-250. Frequency by 2015 SAGE % Mathematics Proficiency for Age = 45 ........... 359 J-251. Frequency by 2015 SAGE % Mathematics Proficiency for Age = 46 ........... 359 J-252. Frequency by 2015 SAGE % Mathematics Proficiency for Age = 47 ........... 360 J-253. Frequency by 2015 SAGE % Mathematics Proficiency for Age = 48 ........... 360 J-254. Frequency by 2015 SAGE % Mathematics Proficiency for Age = 49 ........... 361 J-255. Frequency by 2015 SAGE % Mathematics Proficiency for Age = 50 ........... 361 J-256. Frequency by 2015 SAGE % Mathematics Proficiency for Age = 51 ........... 362 J-257. Frequency by 2015 SAGE % Mathematics Proficiency for Age = 52 ........... 362 J-258. Frequency by 2015 SAGE % Mathematics Proficiency for Age = 53 ........... 363 J-259. Frequency by 2015 SAGE % Mathematics Proficiency for Age = 54 ........... 363 J-260. Frequency by 2015 SAGE % Mathematics Proficiency for Age = 55 ........... 364 J-261. Frequency by 2015 SAGE % Mathematics Proficiency for Age = 56 ........... 364 J-262. Frequency by 2015 SAGE % Mathematics Proficiency for Age = 57 ........... 365 J-263. Frequency by 2015 SAGE % Mathematics Proficiency for Age = 58 ........... 365 J-264. Frequency by 2015 SAGE % Mathematics Proficiency for Age = 59 ........... 366 J-265. Frequency by 2015 SAGE % Mathematics Proficiency for Age = 60 ........... 366 J-266. Frequency by 2015 SAGE % Mathematics Proficiency for Age = 61 ........... 367
xxxi Figure
Page
J-267. Frequency by 2015 SAGE % Mathematics Proficiency for Age = 62 ........... 367 J-268. Frequency by 2015 SAGE % Mathematics Proficiency for Age = 63 ........... 368 J-269. Frequency by 2015 SAGE % Mathematics Proficiency for Age = 64 ........... 368 J-270.
Frequency by 2015 SAGE % Mathematics Proficiency for Age = 65 ........... 369
J-271. Normal Q-Q Plot of 2015 SAGE % Mathematics Proficiency for Age = 34.......................................................................................................... 369 J-272. Normal Q-Q Plot of 2015 SAGE % Mathematics Proficiency for Age = 36.......................................................................................................... 370 J-273. Normal Q-Q Plot of 2015 SAGE % Mathematics Proficiency for Age = 37.......................................................................................................... 370 J-274. Normal Q-Q Plot of 2015 SAGE % Mathematics Proficiency for Age = 38.......................................................................................................... 371 J-275. Normal Q-Q Plot of 2015 SAGE % Mathematics Proficiency for Age = 39.......................................................................................................... 371 J-276. Normal Q-Q Plot of 2015 SAGE % Mathematics Proficiency for Age = 40.......................................................................................................... 372 J-277. Normal Q-Q Plot of 2015 SAGE % Mathematics Proficiency for Age = 41.......................................................................................................... 372 J-278. Normal Q-Q Plot of 2015 SAGE % Mathematics Proficiency for Age = 42.......................................................................................................... 373 J-279. Normal Q-Q Plot of 2015 SAGE % Mathematics Proficiency for Age = 43.......................................................................................................... 373 J-280. Normal Q-Q Plot of 2015 SAGE % Mathematics Proficiency for Age = 44.......................................................................................................... 374 J-281. Normal Q-Q Plot of 2015 SAGE % Mathematics Proficiency for Age = 45.......................................................................................................... 374
xxxii Figure
Page
J-282. Normal Q-Q Plot of 2015 SAGE % Mathematics Proficiency for Age = 46.......................................................................................................... 375 J-283. Normal Q-Q Plot of 2015 SAGE % Mathematics Proficiency for Age = 47.......................................................................................................... 375 J-284. Normal Q-Q Plot of 2015 SAGE % Mathematics Proficiency for Age = 48.......................................................................................................... 376 J-285. Normal Q-Q Plot of 2015 SAGE % Mathematics Proficiency for Age = 49.......................................................................................................... 376 J-286. Normal Q-Q Plot of 2015 SAGE % Mathematics Proficiency for Age = 50.......................................................................................................... 377 J-287. Normal Q-Q Plot of 2015 SAGE % Mathematics Proficiency for Age = 51.......................................................................................................... 377 J-288. Normal Q-Q Plot of 2015 SAGE % Mathematics Proficiency for Age = 52.......................................................................................................... 378 J-289. Normal Q-Q Plot of 2015 SAGE % Mathematics Proficiency for Age = 53.......................................................................................................... 378 J-290. Normal Q-Q Plot of 2015 SAGE % Mathematics Proficiency for Age = 54.......................................................................................................... 379 J-291. Normal Q-Q Plot of 2015 SAGE % Mathematics Proficiency for Age = 55.......................................................................................................... 379 J-292. Normal Q-Q Plot of 2015 SAGE % Mathematics Proficiency for Age = 56.......................................................................................................... 380 J-293. Normal Q-Q Plot of 2015 SAGE % Mathematics Proficiency for Age = 57.......................................................................................................... 380 J-294. Normal Q-Q Plot of 2015 SAGE % Mathematics Proficiency for Age = 58.......................................................................................................... 381 J-295. Normal Q-Q Plot of 2015 SAGE % Mathematics Proficiency for Age = 59.......................................................................................................... 381
xxxiii Figure
Page
J-296. Normal Q-Q Plot of 2015 SAGE % Mathematics Proficiency for Age = 60.......................................................................................................... 382 J-297. Normal Q-Q Plot of 2015 SAGE % Mathematics Proficiency for Age = 61.......................................................................................................... 282 J-298. Normal Q-Q Plot of 2015 SAGE % Mathematics Proficiency for Age = 62.......................................................................................................... 383 J-299. Normal Q-Q Plot of 2015 SAGE % Mathematics Proficiency for Age = 63.......................................................................................................... 383 J-300. Normal Q-Q Plot of 2015 SAGE % Mathematics Proficiency for Age = 64.......................................................................................................... 384 J-301. Normal Q-Q Plot of 2015 SAGE % Mathematics Proficiency for Age = 65.......................................................................................................... 384 J-302. Boxplot of 2015 SAGE % Mathematics Proficiency for Age ........................ 385 J-303. Frequency by 2015 SAGE % Mathematics Proficiency for MTL55= 2 ........ 386 J-304. Frequency by 2015 SAGE % Mathematics Proficiency for MTL55= 3 ........ 387 J-305. Frequency by 2015 SAGE % Mathematics Proficiency for MTL55= 4 ........ 387 J-306. Frequency by 2015 SAGE % Mathematics Proficiency for MTL55= 5 ........ 388 J-307. Normal Q-Q Plot of 2015 SAGE % Mathematics Proficiency for MTL55 = 2 ...................................................................................................... 388 J-308. Normal Q-Q Plot of 2015 SAGE % Mathematics Proficiency for MTL55 = 3 ...................................................................................................... 389 J-309. Normal Q-Q Plot of 2015 SAGE % Mathematics Proficiency for MTL55 = 4 ...................................................................................................... 389 J-310. Normal Q-Q Plot of 2015 SAGE % Mathematics Proficiency for MTL55 = 5 ...................................................................................................... 390
xxxiv Figure
Page
J-311. Boxplot of 2015 SAGE % Mathematics Proficiency for MTL55 .................. 390 J-312. Frequency by 2015 SAGE % Mathematics Proficiency for Gr_T_2= Yes .... 391 J-313. Frequency by 2015 SAGE % Mathematics Proficiency for Gr_T_2= No ..... 392 J-314. Normal Q-Q Plot of 2015 SAGE % Mathematics Proficiency for Gr_T_2 = Yes ................................................................................................. 392 J-315. Normal Q-Q Plot of 2015 SAGE % Mathematics Proficiency for Gr_T_2 = No ................................................................................................... 393 J-316. Boxplot of 2015 SAGE % Mathematics Proficiency for Gr_T_2 .................. 393 J-317. Frequency by 2015 SAGE % Mathematics Proficiency for Sub_T_Elec = Yes .......................................................................................... 394 J-318. Frequency by 2015 SAGE % Mathematics Proficiency for Sub_T_Elec = No............................................................................................ 395 J-319. Normal Q-Q Plot of 2015 SAGE % Mathematics Proficiency for Sub_T_Elec = Yes .......................................................................................... 395 J-320. Normal Q-Q Plot of 2015 SAGE % Mathematics Proficiency for Sub_T_Elec = No............................................................................................ 396 J-321. Boxplot of 2015 SAGE % Mathematics Proficiency for Sub_T_Elec ........... 396 J-322. Frequency by 2015 SAGE % Mathematics Proficiency for Other_Math = No ............................................................................................ 397 J-323. Frequency by 2015 SAGE % Mathematics Proficiency for Other_Math = Yes, Minor/Sp.Emphasis......................................................... 398 J-324. Normal Q-Q Plot of 2015 SAGE % Mathematics Proficiency for Other_Math = No ............................................................................................ 398 J-325. Normal Q-Q Plot of 2015 SAGE % Mathematics Proficiency for Other_Math = Yes, Minor/Sp.Emphasis......................................................... 399 J-326. Boxplot of 2015 SAGE % Mathematics Proficiency for Other_Math ........... 399
xxxv Figure
Page
J-327. Frequency by 2015 SAGE % Mathematics Proficiency for Inf_State_Leg2 = 1 ......................................................................................... 400 J-328. Frequency by 2015 SAGE % Mathematics Proficiency for Inf_State_Leg2 = 2 ......................................................................................... 401 J-329. Frequency by 2015 SAGE % Mathematics Proficiency for Inf_State_Leg2 = 3 ......................................................................................... 401 J-330. Frequency by 2015 SAGE % Mathematics Proficiency for Inf_State_Leg2 = 4 ......................................................................................... 402 J-331. Frequency by 2015 SAGE % Mathematics Proficiency for Inf_State_Leg2 = 5 ......................................................................................... 402 J-332. Frequency by 2015 SAGE % Mathematics Proficiency for Inf_State_Leg2 = 6 ......................................................................................... 403 J-333. Normal Q-Q Plot of 2015 SAGE % Mathematics Proficiency for Inf_State_Leg2 = 1 ......................................................................................... 403 J-334. Normal Q-Q Plot of 2015 SAGE % Mathematics Proficiency for Inf_State_Leg2 = 2 ......................................................................................... 404 J-335. Normal Q-Q Plot of 2015 SAGE % Mathematics Proficiency for Inf_State_Leg2 = 3 ......................................................................................... 404 J-336. Normal Q-Q Plot of 2015 SAGE % Mathematics Proficiency for Inf_State_Leg2 = 4 ......................................................................................... 405 J-337. Normal Q-Q Plot of 2015 SAGE % Mathematics Proficiency for Inf_State_Leg2 = 5 ......................................................................................... 405 J-338. Normal Q-Q Plot of 2015 SAGE % Mathematics Proficiency for Inf_State_Leg2 = 6 ......................................................................................... 406 J-339. Boxplot of 2015 SAGE % Mathematics Proficiency for Inf_State_Leg2 ...... 406 J-340. Frequency by 2015 SAGE % Mathematics Proficiency for Sub_T_H_SS = Yes ........................................................................................ 407
xxxvi Figure
Page
J-341. Frequency by 2015 SAGE % Mathematics Proficiency for Sub_T_H_SS = No ......................................................................................... 408 J-342. Normal Q-Q Plot of 2015 SAGE % Mathematics Proficiency for Sub_T_H_SS = Yes ........................................................................................ 408 J-343. Normal Q-Q Plot of 2015 SAGE % Mathematics Proficiency for Sub_T_H_SS = No ......................................................................................... 409 J-344. Boxplot of 2015 SAGE % Mathematics Proficiency for Sub_T_H_SS ......... 409 J-345. Frequency by 2015 SAGE % Mathematics Proficiency for Saxon_Math = Yes.......................................................................................... 410 J-346. Frequency by 2015 SAGE % Mathematics Proficiency for Saxon_Math = No ........................................................................................... 411 J-347. Normal Q-Q Plot of 2015 SAGE % Mathematics Proficiency for Saxon_Math = Yes.......................................................................................... 411 J-348. Normal Q-Q Plot of 2015 SAGE % Mathematics Proficiency for Saxon_Math = No ........................................................................................... 412 J-349. Boxplot of 2015 SAGE % Mathematics Proficiency for Saxon_Math .......... 412 J-350. Frequency by 2015 SAGE % Mathematics Proficiency for Gr_T_K = Yes ................................................................................................ 413 J-351. Frequency by 2015 SAGE % Mathematics Proficiency for Gr_T_K = No .................................................................................................. 414 J-352. Normal Q-Q Plot of 2015 SAGE % Mathematics Proficiency for Gr_T_K = Yes ................................................................................................ 414 J-353. Normal Q-Q Plot of 2015 SAGE % Mathematics Proficiency for Gr_T_K = No .................................................................................................. 415 J-354. Boxplot of 2015 SAGE % Mathematics Proficiency for Gr_T_K ................. 415 J-355. Frequency by 2015 SAGE % Mathematics Proficiency for MTL36= 3 ........ 416
xxxvii Figure
Page
J-356. Frequency by 2015 SAGE % Mathematics Proficiency for MTL36= 4 ........ 417 J-357. Frequency by 2015 SAGE % Mathematics Proficiency for MTL36= 5 ........ 417 J-358. Normal Q-Q Plot of 2015 SAGE % Mathematics Proficiency for MTL36 = 3 ...................................................................................................... 418 J-359. Normal Q-Q Plot of 2015 SAGE % Mathematics Proficiency for MTL36 = 4 ...................................................................................................... 418 J-360. Normal Q-Q Plot of 2015 SAGE % Mathematics Proficiency for MTL36 = 4 ...................................................................................................... 419 J-361. Boxplot of 2015 SAGE % Mathematics Proficiency for MTL36 .................. 419 J-362. Frequency by 2015 SAGE % Mathematics Proficiency for MTL44= 1 ........ 420 J-363. Frequency by 2015 SAGE % Mathematics Proficiency for MTL44= 2 ........ 421 J-364. Frequency by 2015 SAGE % Mathematics Proficiency for MTL44= 3 ........ 421 J-365. Frequency by 2015 SAGE % Mathematics Proficiency for MTL44= 4 ........ 422 J-366. Frequency by 2015 SAGE % Mathematics Proficiency for MTL44= 5 ........ 422 J-367. Normal Q-Q Plot of 2015 SAGE % Mathematics Proficiency for MTL44 = 1 ...................................................................................................... 423 J-368. Normal Q-Q Plot of 2015 SAGE % Mathematics Proficiency for MTL44 = 2 ...................................................................................................... 423 J-369. Normal Q-Q Plot of 2015 SAGE % Mathematics Proficiency for MTL44 = 3 ...................................................................................................... 424 J-370. Normal Q-Q Plot of 2015 SAGE % Mathematics Proficiency for MTL44 = 4 ...................................................................................................... 424 J-371. Normal Q-Q Plot of 2015 SAGE % Mathematics Proficiency for MTL44 = 5 ...................................................................................................... 425 J-372. Boxplot of 2015 SAGE % Mathematics Proficiency for MTL44 .................. 425
xxxviii Figure
Page
J-373. Frequency by 2015 SAGE % Mathematics Proficiency for Coll_Alg = Yes ............................................................................................... 426 J-374. Frequency by 2015 SAGE % Mathematics Proficiency for Coll_Alg = No ................................................................................................ 427 J-375. Normal Q-Q Plot of 2015 SAGE % Mathematics Proficiency for Coll_Alg = Yes ............................................................................................... 427 J-376. Normal Q-Q Plot of 2015 SAGE % Mathematics Proficiency for Coll_Alg = No ................................................................................................ 428 J-377. Boxplot of 2015 SAGE % Mathematics Proficiency for Coll_Alg ................ 428 J-378. Frequency by 2015 SAGE % Mathematics Proficiency for MTL39= 1 ........ 429 J-379. Frequency by 2015 SAGE % Mathematics Proficiency for MTL39= 2 ........ 430 J-380. Frequency by 2015 SAGE % Mathematics Proficiency for MTL39= 3 ........ 430 J-381. Frequency by 2015 SAGE % Mathematics Proficiency for MTL39= 4 ........ 431 J-382. Frequency by 2015 SAGE % Mathematics Proficiency for MTL39= 5 ........ 431 J-383. Normal Q-Q Plot of 2015 SAGE % Mathematics Proficiency for MTL39 = 1 ...................................................................................................... 432 J-384. Normal Q-Q Plot of 2015 SAGE % Mathematics Proficiency for MTL39 = 2 ...................................................................................................... 432 J-385. Normal Q-Q Plot of 2015 SAGE % Mathematics Proficiency for MTL39 = 3 ...................................................................................................... 433 J-386. Normal Q-Q Plot of 2015 SAGE % Mathematics Proficiency for MTL39 = 4 ...................................................................................................... 433 J-387. Normal Q-Q Plot of 2015 SAGE % Mathematics Proficiency for MTL39 = 5 ...................................................................................................... 434 J-388. Boxplot of 2015 SAGE % Mathematics Proficiency for MTL39 .................. 434
CHAPTER I INTRODUCTION In human relations, this is obvious: I never react to you but to you-plus-me; or to be more accurate, it is I-plus-you reacting to you-plus-me. ‘I’ can never influence ‘you’ because you have already influenced me; that is, in the very process of meeting, by the very process of meeting, we BOTH become something different. It is I plus the-interweaving-between-you-and-me meeting you plus the-interweaving-between-you-and-me, etc., etc. If we were doing it mathematically we would work it out to the nth power. (Follett, 1924, pp. 62-63; Graham, 1995, p. 42; Jörg, 2016, p. 72) School leaders/principal’s (hereafter just school leader) are expected to make decisions that will measurably and, in some cases dramatically, improve student achievement in mathematics. However, one of the difficulties for school leaders has been the limited amount of research concerning content-specific (e.g., mathematics) school leadership and its effects on student achievement. School leaders do not make decisions in isolation; rather, they make decisions as part of a complex adaptive system (CAS). Educational institutions, such as schools, represent CASs made up of individual stakeholders whose everyday decisions influence all other stakeholders in meaningful ways. As such, a school leader will be influenced by the agency, or interactions, among different stakeholders and, in turn, the school leader will directly and indirectly influence others. This study focuses on three aspects of the school leader: (1) the relationships between students’ mathematics achievement and the characteristics of school leaders and their students’ demographics, (2) the influences affecting the decisions and actions being made by school leaders, and (3) how school leaders’ decisions and actions are associated with students’ mathematics achievement. By viewing the school as a CAS, the purpose of
2 this study is to pragmatically examine the school leaders’ role in students’ mathematics achievement in the context of complexity theory.
Background of the Problem The study of leadership dates back to ancient times (Bass, 1981) and theories of leadership continue to multiply (Northouse, 2016). When considering school leadership, Marzano (2003) found that whether or not a school operated effectively impacted students’ chances of academic success such that students in effective schools had a 44% difference in their expected passing rates on standardized exams. Thus, school leaders have an interest in understanding how to help a school operate effectively towards specific goals. However, most research examining the influence of the school leader has sought to isolate the school leader as a variable using traditional linear and/or multiple regression techniques that do not take into consideration the dynamic influences felt by a school leader (Bartholomew-Mabry, 2005; Batchelder & Christian, 2000; Shin & Slater, 2010; Uswatte, 2013). School leaders do not work in isolation, so by considering them in isolation to other stakeholders, prior research presents an incomplete picture. A situated, pragmatic research approach is called for in which a school is considered as a complete organism; and, of which the school leader is but one part, such as that proposed by complexity theory. In complexity theory, a CAS is “an assemblage or combination of things or parts forming a complex or unitary whole” (“System [Def. 1],” 2015) that demonstrates an additional distinctive property called emergence. Emergence is a form of collaboration in
3 which the collective actions of the complex system in its entirety are more than the sum of the actions of its parts (Holland, 2014). An example of an emergent property would be the “school culture” associated with an aggregate of stakeholders (i.e., students, parents, teachers, school leaders, etc.) in an educational institution (hereafter referred to as a school). It is difficult and unreasonable to assign “school culture” to an individual stakeholder. It is only when the stakeholders work in aggregate that school culture emerges as a property of a school. This nonlinearity of emergent properties leads to the necessity of hierarchical levels of organization to define the properties themselves. Thus, complexity theory addresses the challenges associated with understanding complex systems, their emergent properties, and hierarchical levels of organization with the purpose to guide the complex system towards some desired end, or goal (Davis & Sumara, 2008; Uhl-Bien & McKelvey, 2007). By considering a school as a CAS, and higher student mathematics achievement as a result of an emergent property, a more complete picture of the problem can be generated that provides a pragmatic analysis of what it takes to improve students’ mathematics achievement. As school leaders seek to promote students’ mathematics achievement, understanding how to move a complex organization, such as a school, towards a goal through a shared vision of mathematics education, becomes imperative to success. In this way, complexity theory allows researchers to answer questions that would otherwise remain unapproachable. Therefore, in this study, due to the emergent properties of the hierarchical system that is a school, the researcher was able to pragmatically explore how school leaders’ actions towards various stakeholders may be associated with students’ mathematics achievement.
4 Problem Statement The purpose of this study was to explore the role the school leader plays in students’ mathematics achievement through the lens of complexity theory. By so doing, the researcher developed a conceptual framework that can be used to guide future content-specific leadership research in schools and provided pragmatic suggestions to school leaders as to how they may most effectively lead their respective schools towards higher student mathematics achievement. A large corpus of research exists on the general influence of leadership in schools (Kliebard, 2004; Marzano, Waters, & McNulty, 2005). Generally, this large corpus of research shows that school leadership has a substantial effect on student achievement. There is also a growing body of quantitative research into the role school leaders play into specifically promoting and influencing student mathematics achievement (Heck & Hallinger, 2009; Shin & Slater, 2010). Generally, this growing body of research shows that school leaders directly influence aspects such as teacher efficacy and satisfaction, school culture, teacher professional development, and teacher collaboration practices and that these indirectly influence student mathematics achievement. However, very little research has focused on examining the problem of understanding the reasoning behind the relationships found in recent quantitative studies; particularly through the lens of complexity theory, in which a school is viewed as a CAS (Bower, 2006). Additionally, the relatively new research based on the role of school leaders on students’ mathematics achievement is primarily quantitative, with few qualitative and mixed methods studies (Lemons, 2012; Schoen, 2010). This shows that more research, particularly research using qualitative and mixed methods, is needed to
5 understand the role school leaders play in students’ mathematics achievement; such as, understanding the reasons decisions are made by school leaders that influence the allocation of resources within a CAS.
Significance of the Study This study serves to inform future research on aspects of school leadership and mathematics education, including the use of the School Leadership in a Complex Adaptive System (SL-CAS) Framework, to understand the role school leaders play in students’ mathematics achievement. This study is significant because school systems are being held increasingly accountable for students’ mathematics achievement. School leaders and researchers need to understand how to make decisions that promote the most effective use of resources within the complex realities that exist in schools to achieve higher mathematics achievement for all students. The knowledge gained from this study will give direction to researchers and school leaders on the nature of complex adaptive school systems and address pragmatically the understanding of the school leaders’ actions to effectively move a CAS toward a shared vision of mathematics education which promotes higher student mathematics achievement.
Research Questions This mixed methods study included the collection of quantitative and qualitative data to answer the research questions.
6 Over-Arching Research Question What is the school leaders’ role in students’ mathematics achievement in the context of Complexity Theory?
Sub Questions 1. What characteristics of the school leader are most important in predicting students’ mathematics achievement? 2. What is the relationship between students’ mathematics achievement and characteristics of the school leader? 3. What relationships with stakeholders in the schools influence school leaders’ decisions? 4. What decisions and actions are being made by school leaders? 5. How are school leaders’ decisions and actions associated with students’ mathematics achievement?
Summary of Research Design This research study employed an explanatory sequential mixed methods design (Creswell & Plano Clark, 2011) and it involved collecting quantitative data first. In the quantitative data collection phase of the study, the researcher collected survey data over the course of two months from 158 K-12 traditional public and charter school leaders in Utah to assess the relationship between students’ mathematics achievement and characteristics of the school leader. The qualitative data collection phase also took two months. In this phase, the researcher explored the school leaders’ role through three focus groups consisting of 5-6 school leaders each. The focus groups included 15 school leaders from schools
7 performing higher than their demographics would suggest, school leaders from schools performing about where their demographics would suggest, and school leaders from schools performing lower than their demographics would suggest. In the mixed methods analysis phase, the researcher iteratively analyzed the quantitative and qualitative data to help explain the results. In this phase, the researcher utilized a complex array of data analysis procedures including Random Forests and variable importance plots (Breiman, 2001; Ho, 1995, 2002; Liaw & Wiener, 2002), model assumption and preliminary correlation analysis (Cramer, 1998; Cramer & Howitt, 2004; Doane & Seward, 2011; Razali & Wah, 2011; Shapiro & Wilk, 1965), network analysis (Wasserman & Faust, 1994), initial regression model development and post-hoc regression analysis, as proposed by Gilstrap (2013), constant comparative analysis (Creswell, 2013) and connected data analysis (Creswell & Plano Clark, 2011). The researcher used these methods to draw meta-inferences through the comparison of traditional quantitative and qualitative analytic methods combined with the more complexity-theory-aligned network and post-hoc regression methods (Tashakkori & Teddlie, 2008).
Assumptions and Scope of Study The researcher made several assumptions at the onset of this study. First, this study was limited to the K-12 public schools in Utah and the school leaders who responded to the invitation to complete the Principals Mathematics Questionnaire during the timeframe allowed. The scope of the study was limited by the characteristics of
8 school leaders employed in the state of Utah. Traditional public school districts and public charter schools, for a variety of reasons, hire school leaders with differing characteristics. It was also assumed that the focus-group participants would talk candidly with each other about promoting students’ mathematics achievement.
Definition of Terms Agents: Individual stakeholders that can learn and adapt in response to interactions with other stakeholders of a complex adaptive school system. Agency: The interactions between individual stakeholders. Chaotic behavior: A specific kind of process from which a level of organization and order emerges that is difficult to discern and impossible to measure precisely for long-term prediction (E. S. Johnson, 2008) Chaos theory: A mathematical theory that deals with seemingly minor details that sometimes have major impacts on larger complex systems. Complexity theory: A scientific theory that deals with complex systems that all have the following properties: (1) they self-organize into patterns, (2) they engage in chaotic behavior, (3) they demonstrate ‘fat-tailed’ behavior, where occasional events occur much more often than would be predicted by a normal bell-curve distribution, and (4) they display adaptive interactions. Complex system: “An assemblage or combination of things or parts forming a complex or unitary whole” (“System [Def. 1],” 2015) that demonstrates an additional distinctive property called emergence.
9 Complex adaptive system: A complex system in which individual agents of the system are not fixed. In other words, these individual agents can learn and adapt in response to interactions with other agents of the complex system. Emergence: A form of collaboration in which the collective actions of the complex system in its entirety is more than the sum of the actions of its parts (Holland, 2014). Internal units of operating chaotic systems: Groups of stakeholder specialists from which a level of organization and order emerges. Lever points: Small causes, or actions, made by stakeholders that have disproportionate, yet predictable effects on aggregate behavior. Shared vision: A process of facilitating, through effective communication, a compelling perspective that inspires and guides stakeholder’s behavior by helping other stakeholders visualize positive outcomes (J. Johnson, 2013; Vale et al., 2010).
10 CHAPTER II LITERATURE REVIEW Three areas of literature influenced the design and implementation of this study: complexity theory, the general influence of leadership, and the role school leaders’ play in promoting and influencing student mathematics achievement. Presented in this literature review is salient research in each area.
Complexity Theory
What is Complexity and How Does It Relate to This Study? The word complexity originally was a noun meaning objects with many interconnected parts (Holland, 2014). Today complexity designates a diverse scientific field that studies complex systems (Holland, 2014). There are many ways to think about systems. One definition of a system is “an assemblage or combination of things or parts forming a complex or unitary whole” (“System [Def. 1],” 2015). A complex system demonstrates an additional distinctive property called emergence. Emergence is a form of collaboration in which the collective actions of the complex system in its entirety is more than the sum of the actions of its parts. Because of this, an emergent property is nonlinear and can be difficult to define operationally. An example of an emergent property would be the ‘school culture’ associated with an aggregate of stakeholders (i.e., students, parents, teachers, school leaders, etc.) in an educational institution, (hereafter referred to as a school). It is difficult and unreasonable to assign school culture to an individual
11 stakeholder. It is only when the stakeholders work in aggregate that school culture is emerges and is perceived as a property of a school. This non-linearity of emergent properties leads to the necessity of hierarchical levels of organization in order to define the properties themselves. For example, without the lower level of the stakeholders in aggregate, it becomes futile to define ‘school culture’. It is only at the higher hierarchical level of organization, found when stakeholders combine to become a school, that the property of school culture emerges. Thus, complexity theory attempts to describe the challenges associated with understanding complex systems, their emergent properties, and hierarchical levels of organization with the purpose to attain some ability to guide the complex system toward some desired end. In this way, complexity theory allows researchers to answer questions that would otherwise remain unapproachable. The idea of complexity was important to this study because school leaders work within a complex school system. In trying to lead schools towards any desired goal, such as greater student mathematics achievement, school leaders must understand the role they play as one part of the whole so they can most effectively focus their time and efforts.
Behaviors of Complex Systems Due to the emergent properties of complex systems, all complex systems exhibit common behaviors (Davis, Phelps, & Wells, 2004; Davis & Sumara, 2008; Holland, 2014). First, complex systems self-organize into patterns, as occurs with groups of students, same grade level teachers, or parent organizations in school environments. Second, complex systems engage in chaotic behavior in which small decisions by
12 individuals (e.g. implementation of an instructional strategy to meet the needs of an individual student) produce measurable later changes (e.g., implementation of the same strategy school-wide after positive results). Third, complex systems demonstrate ‘fattailed’ behavior, where occasional events (e.g., adoption of new mathematics standards) occur much more often than would be predicted by a normal bell-curve distribution. Fourth, complex systems display adaptive interactions, where interacting stakeholders adjust their strategies in different ways as they gain experience. Behaviors of complex systems play an integral role in this study because schools demonstrate all the common elements of a complex system. Thus, to understand pragmatically how school leaders can best guide a school towards a goal, such as higher student mathematics achievement, researchers must consider a school as a complex system.
Two Types of Complex Systems There are two types of complex systems found in the literature: complex physical systems (CPS) and complex adaptive systems (CAS). The main difference is that CPS have individual elements of the system which are unchangeable, or fixed (such as Von Neumann’s (1956) self-reproducing machines), while CAS have individual elements of the system that are not fixed. In other words, these individual elements can learn and adapt in response to interactions with other elements of the complex system. The literature usually refers to these elements as agents (Holland, 2014; Jӓppinen, 2014; Mason, 2008; Stanley, 2006). Schools would fit under the CAS classification due to the regular change in the individual agents of the complex system. This idea of elements of the complex system as agents contributes to the concept of agency (Davis et al., 2004). It
13 is through the interactions of the individual agents, or agency, that complex emergence occurs. For the purposes of this study, I will use the term stakeholders as a replacement for elements, or agents, since the CAS in question is a school. The advantage of considering a school as a CAS is that this allows researchers to explore pragmatically a deep understanding of the agency, or interactions, between individual stakeholders. Because individual stakeholders of a CAS, such as a school, are in a constant state of change (i.e., student mobility, faculty and staff movement, parental involvement, etc.), it is impossible to expect every stakeholder to converge upon a single ‘optimal’ strategy for almost any decision-making process. As stakeholders interact with each other, adapt, and correspondingly change (e.g. utilize agency), new ideas about decision-making processes will usually emerge. This type of complex feedback loop, in which the agency among stakeholders influences each other’s decisions make CAS difficult to analyze, or even describe (Gilstrap, 2005; Holland, 2014; Stanley, 2006). CAS are important to this study because to treat a school as anything other than a CAS fails to recognize the contextual realities in which school leaders are placed (Koopmans & Stamovlasis, 2016). Researchers have a better, pragmatic understanding of the school leaders’ role in students’ mathematics achievement when considering schools as CAS.
Analysis of Complex Adaptive Systems Despite the diversity that results from stakeholders continually adapting within the CAS that is a school, all well-studied CAS display what is referred to as lever points in the literature (Holland, 1995a, 1995b, 2002, 2006; Page, 2009; Resnicow & Page, 2008; Rosenau, 1997). Lever points are small causes, or actions, made by stakeholders
14 that have disproportionate, yet predictable effects on aggregate behavior. This generated behavior on the hierarchal levels of the CAS involve a tangled network of agency between stakeholders with many loops providing feedback and the recirculation of resources both physical (e.g., curriculum materials or time appropriation for different activities) and mental (e.g., ideas presented in professional development; Alhadeff-Jones, 2013; Davis & Sumara, 2008; Holland, 2006, 2014; Jӓppinen, 2014). It then becomes a matter for network analysis to identify the possible IF-THEN conditions that characterize the influence among the stakeholders on each other (Holland, 2014; Koopmans, 2014). In addition, because society-based organization extends both downward (i.e., grade-specific or subject-specific teaching teams) and upward (i.e., the district office and/or local school board) from the level of school organization, analysis can examine the diversity, or specialization, found at different levels of hierarchy and their influences on each other. In other words, groups of stakeholder specialists at different levels of hierarchy can be can be thought of as lever points. As such, another way to think of these groups of stakeholder specialists is as internal or external units of operating chaotic systems (Gilstrap, 2005; Holland, 2006, 2014). Chaos theory and operating chaotic systems. Chaos represents a specific kind of process from which a level of organization and order emerges that is difficult to discern and impossible to measure precisely for long-term prediction (E. S. Johnson, 2008). In other words, chaos deals with seemingly minor details that sometimes have major impacts on larger complex systems. Three properties are found in chaotic systems: nonlinearity (as discussed before, this means the sum of the whole may be more than the
15 sum of the parts), they are deterministic (i.e., given the exact same initial conditions, they are predictable), and they display sensitivity to initial conditions (e.g., student demographics at a particular school; Gilstrap, 2005; Smith, 2007). In CAS, chaotic systems can exist simultaneously and pluralistically (Gilstrap, 2005). Thus, in considering a school as a CAS, it is possible to model groups of stakeholder specialists as internal and external units of operating chaotic systems. Identifying the initial conditions that are most important. In modeling a CAS, there are hundreds, if not thousands, or millions, of independent variables to consider. Within this understanding, it becomes necessary to identify which initial conditions are salient to understanding the problem at hand. Quantitative data mining techniques utilizing decision trees can allow researchers to filter through the complex landscape of influences and focus on what is most important (Breiman, 2001; Ho, 1995, 2002; Liaw & Wiener, 2002). Network analysis, multiple regression analysis, and post-hoc regression analysis. Using network analysis (Marion & Schreiber, 2016; Wasserman & Faust, 1994), multiple regression analysis, and post-hoc regression analysis (Gilstrap, 2013), it becomes possible to make predictions about a CAS. This then allows stakeholders to consider the effect of the movement (i.e., changes made by various stakeholders) towards a collective goal, such as student mathematics achievement (Jordan, 2010; Mowat & Davis, 2010), or trajectory, described by Dewey as events with meaning (Osberg, Biesta, & Cilliers, 2008). Dewey (1998) discussed the importance of educators looking far into the future with respect to viewing every present experience of the child with an eye
16 towards future experiences. Applying this concept to a CAS, it becomes the object for stakeholders (such as a school leader) to influence the movement of the CAS (i.e., school) through the agency, or complex emergence (i.e., interactions), of the stakeholders the trajectory (i.e., higher student mathematics achievement).
Empirical Research using Complexity Theory as a Theoretical Framework There is very little empirical research applying complexity theory to school leadership at the level of the school as an organization. Empirical studies utilizing complexity theory in educational settings have only been found in recent publications. In the past few years, complexity theory has been used to investigate daily high school attendance data (Koopmans, 2016), identify nonlinear dynamical interaction patterns in collaborative groups (Stamovlasis, 2016), investigate teacher-student interactions (Pennings & Mainhard, 2016), and study the effectiveness of a science and technology educational intervention (van Vondel, Steenbeck, van Dijk, & van Geert, 2016). Bower (2006) conducted a qualitative phenomenological study that examined the experiences of the faculty of one middle school through the lens of complexity theory. The purpose of the study was to better understand the phenomena of self-organization and its role in sustaining school improvement. Bower used complexity theory to frame the study by classifying sustained school improvement as an emergent property from within a school. He made this distinction due to the recognition that the core processes of principles, philosophy, and values (i.e., a shared vision) influenced processes like feedback, communication, dialogue, sense making, and relationships leading to the emergent
17 ownerships, renewal, creativity, safe and trusting atmosphere, engagement, and selforganization needed to make sustained improvement possible. Researcher found indirect influences of the school leader on individuals and collective groups of teachers to be important to sustaining reform efforts and improvement. Researchers reported a continual feedback loop between the school leader’s actions with staff, the concept of shared leadership, the collective actions of the faculty, and sustained results. Further results suggested the dynamics of self-organization needed collective leadership that focused on collective ownership to sustain improvements over time. While not addressing complexity theory explicitly, Higgins and Bonne (2011), in their two-year case study, examined how and why four leadership functions were enacted in an elementary school with a particular focus on hierarchical and heterarchical configurations of leadership. They found the influences felt between hierarchical and heterarchical levels strengthened the school’s work towards sustaining reform efforts in promoting the teaching and achievement of mathematics. This investigation into the influences between different stakeholders acknowledged the complexities of school leadership and thus has application to this literature. In two recent books, while Davis and Sumara (2008) and Uhl-Bien and Marion (2008) discuss the theoretical applications to, and suggest methodological approaches for, the use of complexity to school leadership and education research, the actual research implementation of the ideas discussed is negligible to nonexistent. Thus, additional research is warranted on complexity theory in educational settings using mixed methods, and with regards to school leadership specifically.
18 Influence of Leadership “After decades of dissonance, leadership scholars agree on one thing: They can’t come up with a common definition for leadership” Peter G. Northouse (2016, p. 5). Despite the quote just stated, several components are found in the literature as essential to the phenomena of leadership: (a) leadership is a process, (b) leadership involves influence, (c) leadership occurs in groups, and (d) leadership involves common goals (Northouse, 2016). It is beyond the scope of this study to review all the literature on leadership. Rather, this section of the literature review will focus on leadership theories and empirical research that conforms with the ideas and principles found in Complexity Theory. As such, this section presents salient research on the following areas: the historical influence of the school leader, adaptive leadership, and shared vision.
The Historical Influence of the School Leader Leadership is vital to the effectiveness of a school and recent research has shown that school leadership affects student achievement. Leithwood, Louis, Anderson and Wahlstom (2004) concluded that the school leader was second only to the classroom teacher among school-related factors affecting school achievement with a quarter of the school effects on student achievement attributed to the direct and indirect effects of the school leader. Likewise, Marzano et al. (2005) in their meta-analysis of 35 years of research indicated that school leadership has a substantial effect on student achievement.
Leadership Theories and Ideologies Many leadership theories such as transformational and transactional leadership
19 (Burns, 1978), service leadership (Greenleaf, 1970, 1977), situational leadership (Blanchard & Hersey, 1996), and instructional leadership (W. F. Smith & Andrews, 1989) emerged with respect to schools starting in the 1970s. Historically, we see that school leaders have only recently been valued as foundational for school improvement. During the nearly century long dominance of the social efficiency school paradigm, school leaders were seen more as managers of the factory model than as facilitators of educational achievement (Kliebard, 2004). However, Marzano et al. (2005) concluded that school leader knowledge of curriculum, instruction, and assessment was the most important factor in enacting reform measures in schools. The historical influence of the school leader informs this research study by allowing the researcher to focus through the lens of the school leader as a way to improve student mathematics achievement. While many stakeholders play significant roles in student mathematics achievement, by focusing the lens on the school leader, other stakeholders may be more effectively supported in their efforts, thus allowing the CAS to move more efficiently towards the desired goal.
Adaptive Leadership One of the most recent leadership theories to emerge in the literature is adaptive leadership. Adaptive leadership focuses on how leaders encourage people to adapt in the face of real-world problems, challenges, and changes. In his influential book, Leadership Without Easy Answers, Heifetz (1994) explained how leaders inspire effective change across multiple hierarchical levels, including self, organizational, community, and societal. The development of the adaptive leadership framework conceptualizes the
20 leader as one who facilitates and mobilizes people to face difficult real-world challenges by providing them with the time and resources necessary to adapt and learn new ways of dealing with change (Heifetz, 1994; Heifetz, Grashow, & Linsky, 2009; Heifetz & Laurie, 1997; Heifetz & Linsky, 2002; Heifetz & Sinder, 1988). This theory of leadership is more follower centered and focuses primarily on the behaviors of leaders (i.e., agency) rather than the characteristics of leaders. Furthermore, adaptive leadership theory concerns itself with how leaders help others explore and change their values to address and resolve changes that are central to their lives. Conceptually, adaptive leadership theory incorporates ideas from four different viewpoints: the systems, biological, service orientation, and psychotherapy perspectives (Heifetz, 1994). The systems perspective assumes many problems are embedded in complicated interactive systems that can evolve and change over time. The biological perspective recognizes that people develop and evolve as they adapt to changes in internal and external environments. The service orientation has the leader using his or her expertise, or authority, to serve others in diagnosing and prescribing possible solutions to emerging problems. The psychotherapy perspective asserts that leaders understand people need supportive environments in which to adapt more successfully when faced with difficult problems. Furthermore, adaptive leadership is conceptualized as a subset of complexity leadership theory (Uhl-Bien & McKelvey, 2007). Within this framework, Uhl-Bien and McKelvey describe adaptive leadership as a dynamic process that originates in the tensions inherent when people struggle over conflicting needs, ideas and preferences. Therefore, leadership is not conceptualized as a specific person or a specific act but as a
21 process of influences (i.e., agency) between many people (i.e., stakeholders in a school). Thus, the theory of adaptive leadership informs this study by allowing the researcher to consider the dynamic influences of stakeholders on each other as they work towards increases in student mathematics achievement in a more pragmatic, contextual manner than would otherwise be possible with other theories of leadership. Northouse (2016) summarizes several strengths of adaptive leadership identified in the literature. First, this type of leadership takes a process approach to the study of leadership, in that it recognizes leadership as a series of complex interactional events between stakeholders. Second, it is follower centered, meaning leadership is directed at stakeholder involvement and growth. Third, adaptive leadership is unique in directing attention to the use of leadership in helping stakeholders deal with conflicting values that emerge in social contexts. Fourth, it provides a practical and useful prescriptive approach to leadership by suggesting stakeholders should learn to adapt and leaders should provide an environment in which that is most likely to occur. Finally, it identifies the importance of a leader in creating an atmosphere (physically, virtually, or relationally) were stakeholders feel safe to tackle difficult issues. The main weakness of adaptive leadership is the absence of almost any empirical research conducted to test its claims. While Heifetz (1994) originally conceptualized adaptive leadership over 20 years ago, without evidence-based support for the theory, the ideas and principles must be viewed as tentative, at best. Thus, empirical research is greatly needed to test the claims made by adaptive leadership theory. Hence, this study tested the claims made by adaptive leadership theory, through the broader lens of
22 Complexity Theory, while considering a school as a CAS and offer original research to address the lack of empirical evidence.
Shared Vision The concept of a shared vision has its roots in transformational leadership theory and research. Kouzes and Posner (1987, 2002) identified the concept of a shared vision as one of the five fundamental practices that empower leaders to achieve their goals. A shared vision occurs when leaders create a compelling perspective that inspires and guides stakeholder’s behavior. This is done through a process of visualizing positive outcomes and communicating them effectively to other stakeholders (J. Johnson, 2013; Vale et al., 2010). In a similar vein, the concepts of shared, or distributed leadership, emerge from the complexities of adaptive leadership and the creation of a shared vision. In the context of Complexity Theory, shared leadership occurs when stakeholders in a CAS take on leadership behaviors (agency) to influence and maximize the effectiveness of the whole (i.e., school; Northouse, 2016). Thus, stakeholders share influence in the creation of the shared vision. Eriksen and Cunliffe (2010) argued that leading is a relational activity, embedded within leaders’ everyday interactions (agency) and conversations. This idea of relational leadership, while not connected explicitly in the literature to the concept of shared vision, creates a way in which to envision how a leader may use their agency to effectively communicate a shared vision in such a way that it becomes an emergent property of the CAS. Through a process of positive feedback loops (Svyantek & Brown, 2000), a leader
23 can capitalize on the relationships in a CAS (such as school) to guide stakeholders towards that shared vision. This in turn allows a revolutionary reconstruction (McClellan, 2010) of the school towards a common goal (e.g. improved student mathematics achievement). As such, shared vision was an integral part of this study in modelling a school as a CAS.
Role School Leaders Play in Promoting and Influencing Student Mathematics Achievement Researchers have long looked at the effects of teacher beliefs, implementation, content knowledge, curricular knowledge, etc. on student achievement in mathematics (Hiebert & Grouws, 2007; Hill, Sleep, Lewis, & Ball, 2007; Philipp, 2007; Presmeg, 2007; Stein, Remillard, & Smith, 2007). Only recently have researchers begun to look at school leaders and the direct or indirect influence they may have on student mathematics achievement (Kythreotis, Pashiardis, & Kyriakides, 2010; Williams, 2010). In particular, most of the research conducted has been primarily quantitative in nature.
Quantitative Research Copious quantitative empirical research has been conducted on the effect of school leaders on teachers directly (i.e., teacher efficacy, teacher satisfaction, school culture, principal support, teacher collaboration, etc.; Bartholomew-Mabry, 2005; Batchelder & Christian, 2000; Shin & Slater, 2010; Uswatte, 2013) and thus student achievement indirectly (D’Agostino, 2000; Dumay, Boonen, & Van Damme, 2013; Forster, 1983). Additionally, recent quantitative studies evaluated the relationship
24 between teacher and school leader professional development and student mathematics achievement (Amsterdam, 2001; Batchelder & Christian, 2000; Corcoran, Schwartz, & Weinstein, 2012), school leader traits and approaches and how they affect student mathematics achievement (Anderson, 2008; Nelson, 2010; Postell, 2009; Walker-Glenn, 2010). Several other studies found that when teachers were asked to whom they turned for advice on or information about mathematics instruction they were more likely to indicate a teacher leader than a school leader (Spillane, Healey, & Mesler Parise, 2009; Spillane & Kim, 2012). In their quantitative study investigating parent and community involvement with student achievement as compared to principal and teacher perceptions of stakeholder influence, Gordon and Louis (2009) found school leaders’ perceptions of, and openness to, community involvement were positively associated with student mathematics achievement. In a quantitative study involving 195 elementary schools in on estate over a four-year period, Heck and Hallinger (2009) found that there were significant direct effects of distributed leadership on changes in schools’ academic capacity and indirect effects on student growth rates in math. This was important to this study because this showed that school leaders do play a role in student mathematics achievement and that researchers can identify and study these indirect and direct effects.
Qualitative Research A much smaller quantity of qualitative case studies also looked at the role of school leaders in influencing student mathematics achievement among other outcomes (Dinham, 2005; Huggins, Scheurich, & Morgan, 2011; Lemons, 2012). Carver (2010) conducted a qualitative study group research project, involving eight sessions over 5
25 months for secondary principals in six south-central Michigan districts, in which they identified potential leadership moves to support teacher lesson planning, lesson delivery, and attending to student thinking in middle school algebra classes. Furthermore, in his qualitative case study of four elementary school principals, Gies (2004) identified specific strategies, behaviors, and actions a school leader might implement to keep staff motivated and focused on increased student performance in mathematics computation. These included the importance of the school leader in communicating a shared vision through the review of student data with teachers. This informed this study by showing it is possible to identify characteristics and relationships between stakeholders that influence the decisions and actions made by school leaders.
Mixed Methods Research Two mixed methods studies looked at the concept of vision with respect to school leadership and mathematics instruction (McLeod, 2008; Schoen, 2010). In particular, Mcleod explored the relationship between school leadership and middle school mathematics achievement. Results found through both descriptive and inferential analysis reported that there were important differences between principals and mathematics teachers in at-risk schools and advocated a shared leadership model in efforts to support state accountability efforts. In one other study, Gaffney and Faragher (2010) found that sustainable improvement in student achievement in numeracy requires a deliberate focus on two complementary strands of educational endeavors: the practice of effective teaching of mathematics and the exercise of high-level school leadership capabilities. These studies showed that school leaders’ decisions and actions are associated with
26 improvement in student mathematics achievement. This illuminates the need to better understand how school leaders’ decisions and actions allow a shared vision to be cultivated in order to better promote student mathematics achievement. Taken as a whole, there is a need for further empirical research on the role a school leader plays in promoting and influencing student mathematics achievement. In particular, there was a dearth of qualitative and mixed methods studies that seek to explain the reasoning behind the relationships found in recent quantitative research. This research study provides empirical results which fill this gap in the literature.
Conceptual Framework The convergence of complexity theory, the influence of leadership, and the role of the school leader in promoting and influencing student mathematical achievement gives rise to the School Leadership in a Complex Adaptive System (SL-CAS) Framework (see Figure 1). The framework is unique in that it recognizes an educational institution, or school, as a CAS (represented as a funnel; Gilstrap, 2005) containing internal units (i.e., groups of stakeholders such as teacher teams, parent organizations, and student demographics) of operating chaotic systems (represented as circles inside the funnel) in which both individual stakeholders and groups of stakeholders have agency (i.e., interactions with each other represented by two way arrows between the circles; Bruner, 1996; Jörg, 2011). This agency leads to complex emergence in which new practices and customs emerge at higher hierarchical levels of organization (Davis et al., 2004). Using the school leader as
27
Figure 1. Conceptual framework of school leadership in a complex adaptive system (SLCAS). This figure illustrates the dynamic organizational system known as a school with internal units of operating chaotic systems, complex feedback loops, and a school’s trajectory with respect to student mathematics achievement emphasizing the role of the school leader. a lens (represented by the darker black two way arrows and darker outlined circle), it then becomes a question of what role does school leaders’ agency play in guiding the CAS towards the trajectory (i.e., the goal represented as the arrow in which the complex
28 system is moving towards) to increase student mathematics achievement (Dewey, 1998; Eriksen & Cunliffe, 2010; Grotzer, 2012; Jörg, 2011, 2016; Lincoln & Guba, 1985; McClellan, 2010; Osberg, Biesta, & Cilliers, 2008; Vygotsky, 1978). At play is also the agency of various stakeholders with respect to initial school conditions (e.g., demographics, setting, and teacher quality), supports for teachers (e.g., curriculum, mentoring, evaluation, professional development, and technology), supports for students (e.g., Tier I, II, and II instruction, curriculum, and technology), the organizational structure of the school (e.g., schedules and time allocation), and the availability and use of data, which is represented by the complex braid twisting around the influences between various stakeholders. The influences represented combine and interact to affect the desired outcomes (Ball, 2009, 2012a, 2012b; Jörg, 2014), and must be considered to pragmatically help school leaders promote student mathematics achievement. As an emerging construct, the student leadership in a CAS framework provides a means for analyzing and interpreting the complex realities of educational institutions.
Unique Contributions of the Current Study A large corpus of research exists on the general influence of school leadership. There is a growing body of research into the role school leaders’ play into promoting and influencing student mathematics achievement. However, very little research has focused on this phenomenon through the lens of complexity theory in which a school is viewed as a CAS. Additionally, the relatively new research base on the role of school leaders on student mathematics achievement is primarily quantitative in nature, with very few
29 qualitative and mixed methods studies. By using school leadership in a complex adaptive system framework in an explanatory sequential mixed methods design, the current research study contributes to the field by examining quantitatively relationships between school leader characteristics and students’ mathematics achievement. Furthermore, the qualitative analysis in this study allows for a better understanding into what decisions are being made by school leaders that are directly or indirectly influencing students’ mathematics achievement and the relationships within and without the school that influence these decisions. Finally, this study links the network of influence between stakeholders together to better understand how a school leaders’ decisions and actions are associated with students’ mathematics achievement.
30 CHAPTER III METHODS The purpose of this research study was to explore the role the school leader plays in students’ mathematics achievement through the lens of complexity theory using an explanatory sequential mixed methods design (Creswell & Plano Clark, 2011). In the quantitative data collection phase of the study, the researcher collected survey data from K-12 traditional public and public charter school leaders throughout the state of Utah to assess whether school leader characteristics related to students’ mathematics achievement. The researcher collected the quantitative data over the course of two months. During the qualitative data collection phase, the researcher explored the school leaders’ role through three focus groups consisting of 5-6 school leaders each. The focus groups included school leaders from schools performing higher than their demographics would suggest, school leaders from schools performing about where their demographics would suggest, and school leaders from schools performing lower than their demographics would suggest. The researcher collected the qualitative data over the course of 2 months. In the mixed methods analysis phase, the researcher utilized an iterative array of data analysis procedures including random forests and variable importance plots (Breiman, 2001; Ho, 1995, 2002; Liaw & Wiener, 2002), model assumption and preliminary correlation analysis (Cramer, 1998; Cramer & Howitt, 2004; Doane & Seward, 2011; Razali & Wah, 2011; Shapiro & Wilk, 1965), network analysis
31 (Wasserman & Faust, 1994), initial regression model development and post-hoc regression analysis, as proposed by Gilstrap (2013), constant comparative analysis (Creswell, 2013) and connected data analysis (Creswell & Plano Clark, 2011). These methods were used to draw meta-inferences through the comparison of traditional quantitative and qualitative analytic methods combined with the more Complexity Theory-aligned network and post-hoc regression methods (Tashakkori & Teddlie, 2008). See Figure 2 for a procedural diagram of the study.
Research Questions The over-arching research question and subquestions guiding this study were as follows.
QUAN DATA COLLECTION
QUAL DATA COLLECTION
MIXED METHODS ANALYSIS
• Population: Utah K-12 School Leaders • Survey Data Collection • Preliminary analysis of QUAN data to Refine the Qualitative and Mixed Methods Questions • Determine Purposeful Sampling Plan: Maximal Variation for Focus Groups • Design Qualitative Semi-Structured Focus-Group Protocols
•Maximal Variation Sampling •Semi-Structured protocols with three focus groups consisting of 5-6 school leaders each
•Iterative Process: •Summarize and Interpret QUAN results •Summarize and interpret QUAL results •Connected Mixed Methods Data Analysis to draw meta-inferences
Figure 2. Explanatory sequential mixed methods design (Creswell & Plano-Clark, 2011). This figure illustrates the research design of this study.
32 Over-Arching Research Question What is the school leaders’ role in students’ mathematics achievement in the context of Complexity Theory?
Subquestions 1. What characteristics of the school leader are most important in predicting students’ mathematics achievement? 2. What is the relationship between students’ mathematics achievement and characteristics of the school leader? 3. What relationships with stakeholders in the schools influence school leaders’ decisions? 4. What decisions and actions are being made by school leaders? 5. How are school leaders’ decisions and actions associated with students’ mathematics achievement? The following sections outline the setting, participants, procedures, data sources, instruments, and data analysis for each phase of the study.
Participants and Settings
Quantitative Data Participants and Settings A total of 851 school leaders from 870 traditional public and public charter schools (hereafter called public schools), out of 1067 total K-12 schools in the state of Utah, were recruited to participate in the quantitative data collection phase of the study. Of these, 158 school leaders completed survey responses for an 18.6% response rate. Table 1 summarizes the school demographics information for the school leaders who participated. The state percent of ethnic minority students is 24.5%. This is in comparison
33 Table 1 School Demographics Represented by Survey Participants School demographic type School settings
Sub-type Urban Suburban Rural
Percent 11.4 37.3 51.3
Included grades
K-4 5-9 10-12
63.3 86.1 26.6
Ethic minority populations (%)
0-20 20.1-50 > 50
70.8 22.1 7.1
English language learner (ELL) populations (%)
0-10 10.1-25 > 25
78.6 13.6 7.8
Low socioeconomic (low-SES) populations (%)
0-20 20.1-50 > 50
22.1 48.7 29.2
Special education (SpEd) populations (%)
0-10 10.1-20 20.1
18.8 72.1 9.1
to a 2015 Utah State Office of Education (USOE) news release in which ethnic minorities comprised 24.5% of Utah’s student population, low-SES comprised 35%, SpEd comprised 11.3%, and ELL comprised 6.1% (USOE, 2015b).
Qualitative Data Participants and Settings The researcher used purposeful sampling to identify 16 school leaders, representing traditional public and public charter schools, from the survey participants in the QUAN phase (Creswell, 2013). Purposeful selection ensured maximal variation as
34 determined by student mathematics achievement (as measured by 2015 SAGE standardized student test scores in mathematics) and school demographics. The researcher divided school leaders into three focus groups: five school leaders from schools who are performing relatively higher than their demographics would suggest (referred to as “Higher,” six school leaders from schools who are performing about where their demographics would suggest (referred to as “As Expected”), and six school leaders from schools who are performing relatively lower than their demographics would suggest (referred to as “Lower”; Collins, 2010). School leaders were from schools demographically similar to others from their rankings found on the USOE Public Data Gateway website found at https://datagateway.schools.utah.gov/. The description given on the USOE Public Gateway on what constituted “similar” schools was as follows: What are “similar schools”? Similar schools are defined by using a statistical approach based on Polytopic Vector Analysis (PVA). In the 2015 edition, schools were analyzed using the size of the school (in terms of October 1 enrollment), percentages of the student population who are ethnic minority, low income, and English language learners, and two measures of rurality based on locale codes assigned by the U.S. Bureau of the Census. Schools which are online or otherwise “virtual” are included but they should be considered carefully in comparisons because they do not fit the geographic assumptions of the model. Schools designed for special purposes—special education, alternative education, and vocational education—and so identified in our data warehouse are not included. The first two types of school have a separate accountability system and the third is not included in accountability. The researcher looked at the 20 schools listed as demographically similar to each school represented in the quantitative survey data. Each school was then assigned a ranking from 1 to 20, based on SAGE mathematics proficiency scores, within the demographically similar schools. Thus, schools ranked 1-5 were performing relatively higher. Schools ranked 6-15 were performing as expected. Schools ranked 16-20 were performing
35 relatively lower. The five school leaders from schools performing HIGHER represented three suburban, one rural, and one urban school. They also represented four traditional public and one public charter school and three elementary and two secondary schools. The six school leaders from schools performing AS EXPECTED represented three suburban, two rural, and one urban school. They also represented four traditional public and one public charter school and three elementary and three secondary schools. The six school leaders from schools performing LOWER represented one suburban, three rural, and two urban schools. They also represented three elementary and three secondary schools. Table 2 shows the variation of the school demographics represented by each of the focus groups.
Procedures
Quantitative Participant Identification and Recruitment The researcher used convenience sampling of Utah K-12 school leaders to collect survey data for the first two research sub-questions. The researcher identified the 1,067 Utah public schools by using Utah’s 2015-16 Educational Directory found on the Utah State Office of Education website at www.schools.utah.gov under the Information and Table 2 School Demographics Represented by Focus Group Participants’ School Performance School performance Higher As expected Lower
Enroll
Eth. Min (%)
Low SES (%)
ELL (%)
SpEd (%)
75-1373
2.7-64.7
11.4-82.7
0-42.3
0.2-13.7
122-1616
6.4-47.4
6-80.3
0-23.6
10.7-21.3
67-692
10.4-79.4
19.9-99.7
0-72.9
9.9-14.3
36 Education Directory tabs (USOE, 2015a). The researcher contacted 41 public school districts, representing 965 schools, and the state charter school office, representing 102 charter schools, to request permission for school leaders to take the survey as part of the Institutional Review Board (IRB) process (see Appendix A). Every district had its own approval process. The researcher acquired permission from the charter school office at the state office of education and from 38 out of the 41 school districts to invite their school leaders to participate in the survey. The researcher kept detailed records in an excel spreadsheet indicating contact with different district personnel and a folder containing written permission from each district, when required. After also receiving appropriate IRB approval, the researcher invited every K-12 public school leader from the approving districts and charter schools to take the survey. Participants received $5 gift cards for completing the survey (e.g., Subway, Kneaders, McDonalds, and Wendy’s). After the research study was concluded, the researcher mailed the gift cards to each participant. The researcher invited school leaders to complete the Revised Principals Mathematics Questionnaire via the online platform, SurveyMonkey (see Appendix B for the survey informed consent and Appendix D for the Revised Principal’s Mathematics Questionnaire). The researcher kept a detailed participant invitation record in an excel spreadsheet indicating the dates email invitations were sent and who participated. One week after the initial survey invitation, the researcher sent a second invitation to participate (see Appendix E for the recruitment email). A third invitation was sent again 1 week later. One district allowed only two email invitations.
37 Qualitative Participant Identification and Recruitment After identifying possible focus group members from the results of the QUAN phase using maximal variation sampling, the researcher personally contacted (via a phone call and/or email) each school leader to invite them to participate in the QUAL phase. The researcher informed prospective participants of the purpose of the study, that their participation would be important and valuable, and why they were selected (see Appendix F for the Dialogue for Recruiting Participants). In addition, prospective participants were informed that the results of the study would be shared with them. The researcher contacted eleven prospective school leaders, representing schools performing HIGHER, before five agreed to participate in the focus group. Similarly, the researcher contacted seventeen prospective school leaders, representing schools performing AS EXPECTED before six agreed to participate in the focus group, and contacted fourteen prospective school leaders, representing schools performing LOWER, before six agreed to participate in the focus group. One school leader participated in both the above and as expected focus groups since they were a school leader of two schools. The researcher coordinated via email individually with each participant to select a focus group option that worked well for participants’ schedules. As an incentive to participate in the focus group interviews, each participant received a $25 gift card (Vaughn, Schumm, & Sinagub, 1996), a travel reimbursement of $0.54/mile for round trip travel expenses, and a 1-night hotel stay, if they had to travel more than 50 miles to participate. Some participants chose to participate via Skype or Google Hangouts. The researcher distributed gift cards immediately to those who participated in person and mailed gift
38 cards to those who participated electronically. Travel reimbursements were mailed at the completion of the study.
Conducting the Focus Group Interviews A total of seven focus group interviews took place with a total of sixteen participants over a 2-month period. The researcher obtained written informed consent for each participant, confidentiality agreements, and travel reimbursement information prior to the beginning of each interview (see Appendix C for the focus group informed consent form and Appendix G for the confidentiality agreement). The researcher kept all documents in a locked cabinet. Each interview took place during one 2-hour session. Five of the focus group interviews took place in a centrally located hotel conference room around a large table. Food and drink were provided for the participants so they felt as comfortable as possible. The food included fruit and vegetable trays, snack bars, and selected pastries. The drinks included water and a selection of soft drinks. One focus group interview was conducted in a library study room, and one was conducted in a university conference room. Two of the focus groups included one or more participants participating via Skype or Google Hangouts. Three school leaders participated electronically. All others participated in person. The researcher video- and audio-taped the interviews for later transcription using two video-recording cameras on stationary tripods on opposite sides of the focus groups. The cameras were high enough and angled slightly down, to allow a wide enough shot to capture all of the participants in the focus group (Roschelle, 2011). The researcher tested the video equipment in advance to avoid glare and backlighting. The researcher started
39 the recordings before the participants arrived and did not stop the recordings until after the participants left to capture any revealing remarks before or after the interview (Roschelle, 2000). As such, the researcher informed the participants prior to attending that they would be video-taped from the moment they entered the room until they left. The researcher tested the audio-equipment to ensure high-quality audio recordings. The researcher placed the audio recorder on the table in front of the interviewer, very close to the participants, and conducted sound checks prior to the start of the interview. There were extra batteries, in case they were needed. The researcher took all efforts to control ambient noise such as closing windows and doors, adjusting the air conditioning equipment, ensuring the room was carpeted, and closing window curtains to reduce reverberations (Roschelle, 2011). As suggested by Vaughn et al. (1996), at the beginning of the interview, the researcher welcomed the participants, informed them of the general purpose and topics to be discussed, and the general guidelines the discussion would follow. The researcher allowed for a warm-up period to set the tone and put participants at ease. Then the researcher clarified the meaning of the terms that were used as part of the interview. The bulk of the interview consisted of questions from the semi-structured, focus-group interview protocol (see Appendix H for the Focus Group Protocol Outline). Towards the end of each interview, the researcher closed with an added request for confidentiality of information, answered any remaining questions, and expressed thanks for the school leaders’ participation. Following the interview, all video- and audio-recordings were upload to a secure Google Drive to which only the researcher had permanent access. A
40 university employed transcriptionist was secured to transcribe the data and, thus, was granted temporary access. Before access was granted, the transcriptionist was required to sign a confidentiality form that was filed by the researcher.
Data Sources and Instruments
Quantitative Data Sources and Instruments The Revised Principal’s Mathematics Questionnaire (see Appendix D), which aligns with the SL-CAS theoretical framework, was developed as the survey instrument. This 20-minute survey of school leaders began with a portion wherein participants were asked to give IRB consent to participate in the survey (see Appendix B). The survey included questions covering general demographics, teaching experiences, administrative experiences, mathematics demographics, and perceived influence on mathematics curriculum and instruction, mathematics curriculum, and mathematics teaching and achievement. This survey was adapted from Williams’ (2010) Principal’s Elementary Mathematics Questionnaire and was distributed through an email invitation (see Appendix E) with a link to the SurveyMonkey platform. The researcher tested items as part of a class project to refine and receive feedback on the previously developed Williams’ (2010) Principal’s Elementary Mathematics Questionnaire. Changes were made to include school leader’s information across all grades K-12 in Utah. In addition, questions were updated to include the most recent documents affecting current mathematics education curriculum and instruction decisions and policies. Questions were also added to inquire as to school leader’s
41 perceptions of how to best increase students’ mathematics achievement. A small group of school leaders (N = 18) from schools identified as high performing on Utah State standardized testing participated in giving feedback on the revised survey items. After the feedback collection process, the researcher reviewed the reported length of time the survey took to complete and other feedback from the school leaders. The researcher then used the Likert scale data to conduct an item analysis using Cronbach’s alpha of .70 to determine the internal consistency or average correlation of items to gauge reliability and aspects of validity (Santos, 1999; Tavakol & Dennick, 2011). Based on this analysis, items were deleted to reduce the length of the survey while maintaining the appropriate Cronbach alpha threshold (see Appendix I for Cronbach alphas). The development of the survey instrument established the reliability, and aspects of validity, for the revised survey instrument. The revised survey (see Appendix D) contains the items necessary to validly, and reliably, identify organizational structures, teacher supports, and accompanying school leader perceptions. In addition, the revised survey addresses the feedback that the instrument was too lengthy.
Qualitative Data Sources and Instruments The researcher used a semistructured, focus-group interview protocol (see Appendix H for Focus Group Protocol Outline) to illicit spontaneous and genuine responses (Vaughn et al., 1996). This protocol was initially developed through the lens of Complexity Theory and based on the SL-CAS theoretical framework and preliminary analysis of the quantitative data. The researcher tested the focus-group interview protocol outline prior to the focus
42 group interviews. The purpose of this was to test technical aspects of recording the interviews and to practice facilitating the interview in a timely manner while maintaining a warm atmosphere of trust. Test participants were invited to share their frank opinions of the moderation process and the wording of questions in order to ensure a welcoming environment.
Data Analysis
Random Forests and Variable Importance Plots After the survey data collection, the researcher exported the SurveyMonkey data as an excel file. The researcher then cleaned the data to create a file that could be used in both SPSS and R for the statistical analyses. Then the researcher conducted a preliminary analysis using the statistical strategies of Random Forests and variable importance plots in R using R packages “haven,” “dplyr,” “tidyr,” “ggplot2,” “rpart,” and “randomForest” (Liaw & Wiener, 2002; R Core Team, 2016; Therneau, Atkinson, & Ripley, 2015; Wickham, 2009; Wickham & Francois, 2016; Wickham & Miller, 2016) to determine which of the independent variables were most important in predicting the dependent variable (Breiman, 2001; Ho, 1995, 2002; Liaw & Wiener, 2002). Random Forests are used in quantitative data mining and utilize decision trees. A single decision tree considers one variable at a time, independently, to find a good initial splitting point. A fixed value of the variable is chosen and data are classified as more or less than that fixed value. The analysis then attempts to find a good splitting point. A good split is the split that tries to put as many samples of one class (such as those in the “more than” group, as
43 determined by the chosen cut point) as possible on one side and as many samples of the other class (such as those in the “less than” group) as possible on the other side. In the end, the best split is the one that is most “pure”. A perfect “pure” split is reached when each section of the final tree contains only members of the same class. The tree continues to split until purity is reached. However, a single tree may reach purity without still demonstrating an overfitting problem. Random Forests (which utilize hundreds, if not thousands, of trees) effectively overcome this problem through “ensemble thinking”. Ensemble thinking is similar to a Board of Directors making decisions for an organization. In a board, various people bring different perspectives and areas of expertise thus generally ensuring a better decision than a single person. This is done statistically through the techniques of bagging (where randomized samples from your data set are employed to create different distributions), randomizing features, and randomizing splits. In this way, a random forest probability distribution can be generated that depends on no assumptions. This effectively deals with missing data by optimizing many trees based on starting with different variables. This method is particularly effective for data that are not clearly linear and for categorical variables which aligns well with Complexity Theory. This method comes with built-in cross validation so that overfitting is mostly avoided. Thus, utilizing Random Forests improves the predictive power of the final model. In alignment with complexity theory, the survey included 193 independent variables. As such, the researcher generated a variable importance plot to identify the most relevant predictor variables. There are two types of variance importance plots. The
44 most common is the “Percent Increase in Mean Square Error” (%IncMSE), which measures how much the mean square error (MSE) increases when a variable is permuted. The other is “Increase in Node Purity” (IncNodePurity) which measures how much node impurity increases when a variable is randomly permuted. The variables with the largest importance will change the predictions in measurable ways if randomly permuted, so we see bigger changes. If you randomly permute a variable that does not gain you anything in prediction, then predictions will not change much and you will only see small changes in MSE and node impurity. In other words, big changes indicate important variables. Of the two plots, IncNodePurity is biased and should only be used if the extra computation time of calculating %IncMSE is unacceptable. Since the calculation time was not an issue, the researcher used a %IncMSE variable importance plot to determine the most important variable. See Figure 3 for a hypothetical example of a %IncMSE plot. In Figure 3, looking at the top right most corner of the plot indicates that variable x2 would be most important in predicting changes in our final model, variable x1 would be next most important, etc. In this way, the researcher was able to answer the first research subquestion.
Model Assumptions and Preliminary Correlation Analysis Following the identification of the most relevant predictor variables, the researcher conducted a preliminary analysis of the model assumptions to check for the normality of each of the variables using a Shapiro-Wilks test (p > .05). In addition, the researcher conducted a visual inspection of their histograms, normal Q-Q plots and box
45
Figure 3. Example of %IncMSE variable importance plot. This figure illustrates how variables that are most important in predicting the dependent variable are located in the most top right of the graph.
plots. Because these data were normally distributed (Cramer, 1998; Cramer & Howitt, 2004; Doane & Seward, 2011; Razali & Wah, 2011; Shapiro & Wilk, 1965), the researcher conducted a preliminary correlation analysis using a two-tailed test with a .05 significance level to determine whether significant Spearman’s rho correlations existed between the independent variables. Spearman’s rho correlations were chosen over Pearson’s correlations because of the categorical variables present in the Principal’s Mathematics Questionnaire. Based on these preliminary findings, the focus-group interview protocol outline was revised to explore and explain the quantitative findings.
46 Network Analysis Following this, the researcher conducted a network analysis (Wasserman & Faust, 1994) in R using R packages “sna,” “igraph,” “visNetwork,” and “network” (Almende & Benoit, 2016; Butts, 2008, 2015, 2016; Csardi & Nespisz, 2006; R Core Team, 2016). Network analysis investigates the social structures in a CAS using graph theory by characterizing stakeholders as nodes and ties between them as relationships or interactions. Thus, based on the categories developed from the qualitative analysis of the focus-group interviews, the network analysis allowed the researchers to further understand the influences of various stakeholders on each other. This then allowed the researcher to analyze how various stakeholders influence school leaders, or vice versa through the lens of a shared vision to better understand how the school leader may move the CAS towards higher student mathematics achievement. This analysis, superimposed on the SL-CAS Framework, helped to determine the possibility of any interaction effects or multiplicative looping effects among the identified most important independent variables, as described in Complexity Theory. Thus, the researcher could use a more educated approach when selecting variables to be included in the final predicative model relating school leaders’ characteristics with the school-wide average SAGE mathematics proficiency scores at their respective schools.
Initial Regression Model Development and Post-Hoc Regression Analysis The network analysis allowed the researcher to narrow the search for possible interaction effects and multiplicative looping effects. Using educated guesses, an initial
47 multiple regression model was determined. Following this, the researcher conducted a post-hoc regression analysis joined with a correlation analysis of the independent variables without the moderating dependent variable as proposed by Gilstrap (2013) to determine if any emergent phenomenon were present at higher hierarchical levels of the CAS that would otherwise be rejected using traditional variable reduction. Post-hoc regression analysis is an emergent, recursive, and iterative quantitative method dealing with interaction effects and collinearity among variables that may have been missed in the preliminary multiple regression analysis. In this way, Gilstrap proposed a method in which a researcher notices an interaction that may not be identified as statistically significant, because of multicollinearity, through traditional multiple regression reductionist methods but for which evidence suggests there may be an important connection, or dynamic, that emerges in a quasi-correlation between two entities. For example, if evidence of multicollinearity takes place at a few dimensions of an initially developed regression model, and correlation analysis shows there are no correlations between these variables without the involvement of the dependent variable, this means one of the independent variables may be acting as a moderator variable. When this happened, the researcher moved into descriptive analyses of the phenomenon that are emerging during the model’s calculations. This created an iterative and recursive method of observation, consistent with Complexity Theory that allowed the researcher to qualitize the quantitative data and use qualitative methods to contribute to the understanding of the overarching research question about the role school leaders’ play in students’ mathematics achievement. When this happened, the researcher explored the
48 interaction in a descriptive framework, through an analysis of means, to qualitize the quantitative data using emergence, rather than reduction, to describe the phenomenon. This enabled the researcher to answer the second research sub-question.
Constant Comparative Analysis At the same time the initial regression model was being developed, the researcher employed traditional constant comparative analysis procedures (Creswell, 2013) utilizing the lens of complexity theory with the qualitative data. The researcher described the focus group samples, including size, the individuals who participated and their background, the location where the focus group interviews took place, and the procedures used for the selection of participants. The interviews were transcribed and coded using three phases of coding: open, axial, and selective (Creswell, 2013) utilizing NVivo11 qualitative analysis software (Edhlund & McDougall, 2016). During the open coding phase, the researcher reviewed the video recordings, audio recordings, transcripts, and field notes for salient categories of information until saturation was reached using constant comparative methods (Creswell, 2013). The initial codes evolved around the SL-CAS theoretical framework and include such categories as: internal operating chaotic units (i.e., stakeholder groups), the influences of such groups on the school leader and vice versa, the presence, or lack thereof, of a shared vision, and decisions regarding resources, curriculum, time, mentoring and coaching, feedback, teacher professional development, and instructional methods. Once the researcher developed an initial set of categories, the researcher used axial-coding categories to connect the open coding categories into overarching themes. Finally, the researcher used selective coding to build a description,
49 grounded in Complexity Theory, which connected the categories (Creswell, 2013) and answered the third and fourth research subquestions.
Connected Data Analysis to Draw Meta-Inferences Following the multiple regression model development and constant comparison analyses, the researcher conducted a descriptive analysis of the larger quantitative data set focused on the schools performing HIGHER, AS EXPECTED, and LOWER. The researcher then utilized connected data analysis as proposed by mixed methods techniques to further analyze the data (Creswell & Plano Clark, 2011). Connected data analysis occurs when the quantitative and qualitative strands are mixed during the data analysis phase of the research study (Creswell & Plano Clark, 2011). After independently analyzing the quantitative and qualitative data using traditional methods, the researcher used an interactive strategy of merging the two separate results to facilitate comparisons and interpretations. Thus, finally, the researcher was able to draw meta-inferences to determine whether the follow-up qualitative data provided a better understanding than just the quantitative data to answer the final research sub-question (Creswell & Plano Clark, 2011). Tashakkori and Teddlie (2008) describe a meta-inference as “an overall conclusion, explanation or understanding developed through an integration of the inferences obtained from the qualitative and quantitative strands of a mixed methods study” (p. 101). Thus, the researcher was first able to make inferences based on independent quantitative and qualitative analyses of the data. Then, through the two
50 strategies of relating the separate results and conducting additional analyses of the transformed data, the researcher was able to answer the final research sub-question and was able to describe, and explain, the overall role that school leaders play in promoting student mathematics achievement.
51 CHAPTER IV RESULTS The purpose of this study was to explore the role the school leader plays in students’ mathematics achievement through the lens of Complexity Theory. The results presented in the following sections are based on survey data collected from 158 K-12 Utah school leaders and focus group interviews with 16 of these same K-12 school leaders. The quantitative results are presented first, followed by the qualitative results. Throughout these sections, the quantitative and qualitative results will be iteratively discussed consistent with Complexity Theory and mixed methods data analysis. The section below reports the results answering the first two research sub-questions.
Quantitative Results
Question 1 The first research sub-question was: What characteristics of the school leader are most important in predicting students’ mathematics achievement? This section discusses the results of the preliminary quantitative analysis using the statistical strategy of Random Forests. As part of this analysis, a variable importance plot was generated to identify the most relevant predictor variables. Random forest and variable importance plot analysis. After the survey data collection, the researcher conducted a preliminary analysis using the statistical strategies of Random Forests and variable importance plots to determine which of the independent variables were most important in predicting the dependent variable, school-wide average
52 SAGE mathematics proficiency scores (Breiman, 2001; Ho, 1995, 2002; Liaw & Wiener, 2002). Figure 4 shows the percent increase in mean square error (%IncMSE) on the variable importance plot which identifies the 30 most important, independent variables out of the 193 possible. Student demographic data were purposefully excluded from this initial analysis to determine which of the characteristics of the school leader were most important in predicting school-wide average SAGE mathematics proficiency scores.
Figure 4. %IncMSE variable importance plot. This figure illustrates the top 30 most important characteristics of school leader variables in order of importance in predicting a school-wide average SAGE mathematics proficiency score.
53 Figure 4 displays the most important variables at the upper right of the graph indicating greater impact on school-wide average SAGE mathematics proficiency scores when randomly permuted. Thus, in order of importance, the graph indicates “the level of the school leaders’ agreement with the statement: The best way to increase student achievement in mathematics is to educate members of the legislature on the curriculum and research-based instructional strategies” (ISAM18) as most important. This was followed by “the level of the school leaders’ agreement with the statement: The best way to increase student achievement in mathematics is to provide teacher/aide tutoring for students” (ISAM12), “the number of years the school leader was in their last teaching position” (Yrs_Last_Teach_Pos), and “the level of the school leaders’ agreement with the use of mathematical discourse being used at least 50% of the time in the 10-12 mathematics classroom” (MTL64), etc. The variable importance plot thus lays out the 30 characteristics of the school leader that are possibly most important in predicting schoolwide average SAGE mathematics proficiency scores from the 193 initially considered. Table 3 provides a detailed description of these 30 most important variables for predicting the school-wide average SAGE mathematics proficiency score, in order of importance, based on the school leaders that participated in the survey. As can be seen in Table 3, the most important variable to predicting a school-wide average SAGE mathematics proficiency score is “the school leader’s agreement with this statement: The best way to increase student achievement in mathematics is to educate members of the legislature on the curriculum and research-based instructional strategies” (ISAM18). The second most important variable was “school leader’s agreement with this
54 Table 3 Description of Top 30 Most Important Characteristics of School Leader Variables in Order of Importance in Predicting a School-Wide Average SAGE Mathematics Proficiency Score Variable abbreviation
Description
ISAM18
School leader agreement with this statement: “The best way to increase student achievement in mathematics is to educate members of the legislature on the curriculum and research-based instructional strategies.”
ISAM12
School leader agreement with this statement: “The best way to increase student achievement in mathematics is to provide teacher/aide tutoring for students.”
Yrs_Last_Teach_Pos
Number of years the school leader was in their last teaching position.
MTL64
School leader agreement with this statement: “Discussion of mathematics (mathematical discourse) should be used at least 50% of the time in the 1012 mathematics classroom.”
Tot_Yrs_Teach
Numbers of years the school leader taught in some capacity.
Inf_Teach3
School leader perception of the amount of influence of teachers over the instructional methods used in the mathematics classroom at their school.
Math_Ed
School leader earned a major, minor, or special emphasis in mathematics education
MTL12
School leader agreement with this statement: “The use of calculators in early grades impedes the development of automaticity with basic facts.”
ISAM3
School leader agreement with this statement: “The best way to increase student achievement in mathematics is to work with university researchers in a collaborative professional development.”
MTL35
School leader agreement with this statement: “In grades K9, mathematics instruction should be teacher directed more than 50% of the time.”
Inf_Nat_Org2
School leader perception of the amount of influence of national organizations such as NCTM over the implementation of the mathematics curriculum at your school.
ISAM16
School leader agreement with this statement: “The best way to increase student achievement in mathematics is to educate parents on the curriculum and research-based instructional strategies.”
ISAM17
School leader agreement with this statement: “The best way to increase student achievement in mathematics is to educate board members on the curriculum and research-based instructional strategies.
Fam_PD_CI_Doc
Amount of school leader familiarity with professional development/materials/readings in mathematics curriculum and instruction.
Sec_Ed
School leader earned a major, minor, or special emphasis in secondary education.
(table continues)
55 Variable abbreviation
Description
ISAM13
School leader agreement with this statement: “The best way to increase student achievement in mathematics is to provide appropriate Tier II and Tier III instruction for students.”
MTL62
School leader agreement with this statement: “In 1012, certain aspects of geometry and measurement are critical foundations of algebra.”
Age
School leader age
MTL55
School leader agreement with this statement: “In 1012, explicit instruction for students who struggle in math is effective in increasing student performance with word problems and computation.”
Gr_T_2
School leader taught second grade at some point in their teaching career.
Sub_T_Elec
School leader taught elective subjects at some point in their teaching career.
Other_Math
School leader earned a major, minor, or special emphasis in some other mathematics related field.
Inf_State_Leg2
School leader perception of the amount of influence of the state legislature over the implementation of mathematics curriculum at your school.
Sub_T_H_SS
School leader taught history/social studies at some point in their teaching career.
Saxon_Math
The school uses Saxon Math curriculum resources as part of their mathematics program.
Gr_T_K
School leader taught kindergarten at some point in their teaching career.
MTL36
School leader agreement with this statement: “In grades K9, questioning should be an important instructional practice in the mathematics classroom.”
MTL44
School leader agreement with this statement: “Rote practice (drill) should be an important instructional practice in the 1012 mathematics classroom.”
Coll_Alg
School leader took college algebra.
MTL39
School leader agreement with this statement: “Cooperative work should be the primary instructional practice in the K9 mathematics classroom.”
statement: The best way to increase student achievement in mathematics is to provide teacher/aide tutoring for students” (ISAM12). The third most important variable was “the number of years the school leader was in their last teaching position” (Yrs_Last_Teach_Pos). As all the variables are described in Table 3, the results from the variable importance plot indicated a complex landscape of influences on students’ mathematics
56 achievement based on the characteristics of the school leader. The results of the analysis to answer the first research sub-question showed that there were identifiable characteristics of a school leader that are most important in predicting the school-wide average SAGE mathematics proficiency score at the leader’s school.
Question 2 This second research question was: What is the relationship between students’ mathematics achievement and characteristics of the school leader? There are five subsections to answer this question. 1. The first subsection discusses the preliminary model assumptions based on the 30 most important variables. 2. The second subsection discusses the preliminary correlation analysis in order to generate the data needed for the network analysis. 3. The third subsection discusses the network analysis to determine possible places to look for interaction effects and multiplicative looping effects in accordance with Complexity Theory. 4. The fourth subsection discusses the initial regression model and post-hoc regression analysis conducted to determine emergent phenomenon present at higher hierarchical levels of the CAS that would otherwise be rejected using traditional positivist variable removal in a multiple regression analysis. 5. The final subsection discusses the multiple regression analysis conducted in SPSS to determine trends between the independent and relevant dependent variables and generate a final predictive model for school-wide average SAGE mathematics proficiency scores based on characteristics of the school leaders and student demographics. Preliminary model assumptions. Based on the 30 most important independent variables and the one dependent variable, the researcher conducted a Shapiro-Wilk’s test (p > .05; Razali & Wah, 2011; Shapiro & Wilk, 1965) for each variable. In addition, the researcher conducted a visual inspection of their histograms, normal Q-Q plots and box
57 plots to check for normality. For example, in Table 4, this analysis showed that the independent variable, “the school leader’s agreement with this statement: ‘The best way to increase student achievement in mathematics is to educate members of the legislature on the curriculum and research-based instructional strategies’” (ISAM18), was approximately normally distributed (Cramer, 1998; Cramer & Howitt, 2004; Doane & Seward, 2011). The researcher completed similar analyses for the 30 most important independent variables and found that all independent variables were approximately normally distributed (see Appendix J for all 30 variables’ histograms and Q-Q plots). Correlation analysis. Next, because the data were normally distributed, the researcher conducted a preliminary correlation analysis using a two-tailed test with a .05 significance level to determine whether significant Spearman’s rho correlations existed between the independent variables. This analysis revealed 83 significant correlations; four strong, 28 moderate, and 51 weak (see Appendix K). Table 5 reports the results of the strong measures and Table 6 reports the results of the moderate measures. Table 4 Normality Tests for the Independent Variable ISAM18
ISAM18 Strongly disagree Disagree Neutral Agree Strongly agree
Shapiro-Wilk ────────────── Statistic df Sig. .87 11 .078 .98 25 .946 .98 43 .558 .98 51 .387 .89 13 .093
Skewness -1.21 .04 .10 -.49 .68
Std. error .66 .46 .36 .33 .62
Kurtosis 1.14 -.13 -.75 .23 -.68
Std. error 1.28 .90 .71 .66 1.19
58 Table 5 Results of the Correlation Analysis Showing Strong Correlations Between Variables Variables ISAM16 ISAM17 ISAM18 0.544** 0.872** ISAM16 0.673** Yrs_Last_Teach_Pos Note. See Appendix L for descriptive statistics of each variable. * p < .05. ** p < .01 level.
Tot_Yrs_Teach
0.798**
As can be seen in Table 5, “the level of the school leaders’ agreement with the statement: The best way to increase student achievement in mathematics is to educate members of the legislature on the curriculum and research-based instructional strategies” (ISAM18) and “the level of the school leaders’ agreement with the statement: The best way to increase student achievement in mathematics is to educate board members on the curriculum and research-based instructional strategies” (ISAM17) were the most strongly correlated variables, r(149) = .872, p < .001. This means that the more school leaders agreed with educating members of the legislature on the curriculum and research-based instructional strategies as the best way to increase student achievement, the more they also agreed with the education of board members as the best way to increase student achievement. As expected, “the total number of years in a school leaders’ last teaching position” (Tot_Yrs_Teach) strongly correlated to “the school leaders’ total number of years of teaching experience” (Yrs_Last_Teach_Pos), r(155) = .798, p < .001. “The level of the school leaders’ agreement with the statement: The best way to increase student achievement in mathematics is to educate parents on the curriculum and research-based
0.248** 0.316**
ISAM 16
ISAM 17
ISAM 17
0.269**
MTL 35
0.249*
Age
**p < .01 level.
* p < .05.
Note. See Appendix L for descriptive statistics of each variable.
Inf_State_Leg2
T_2
Sec_Ed
0.358**
MTL 62
0.245**
0.376**
Inf _State _Leg2 T_Elec T_H_SS
-0.278** 0.392**
MTL 55
Inf_Nat_Org2
0.281**
MTL 55
0.289**
T_2
0.311**
0.251*
Inf__ Teach3
ISAM 13
MTL 64
0.421**
Tot_Yrs_Teach
Age
0.331**
0.395** 0.408**
0.349** 0.315**
ISAM 16
Yrs_Last_Teach_Pos
ISAM 3
0.397**
ISAM 18
ISAM 12
0.311** 0.389** 0.266** 0.270**
Measures
MTL 39
ISAM ISAM 12 ISAM3 13
Results of the Correlation Analysis Showing Moderate Correlations Between Measures
Table 6
T_K
0.361** 0.286**
0.245**
MTL 36
0.304**
MTL 44
59
60 instructional strategies” (ISAM16) and “the level of the school leaders’ agreement with the statement: The best way to increase student achievement in mathematics is to educate members of the legislature on the curriculum and research-based instructional strategies” (ISAM17) were the next most strongly correlated, r(149) = .673, p < .001. This means that the more school leaders agreed with educating parents on the curriculum and research-based instructional strategies, the more they also agree with the education of board members as the best way to increase student achievement. Finally, “the level of the school leaders’ agreement with the statement: The best way to increase student achievement in mathematics is to educate members of the legislature on the curriculum and research-based instructional strategies” (ISAM18) and “the level of the school leaders’ agreement with the statement: The best way to increase student achievement in mathematics is to educate parents on the curriculum and researchbased instructional strategies” (ISAM16) were also strongly correlated, r(149) =.544 , p < .001. ISAM16, 17, and 18 were all variables that dealt with educating various stakeholders in the communities surrounding a school. Tests to see if the data met the assumption of collinearity indicated that multicollinearity was not a concern except for possibly ISAM17 and 18 (ISAM16, Tolerance = .35, VIF = 2.83; ISAM17, Tolerance = .11, VIF = 9.251; ISAM18, Tolerance = .14, VIF = 7.272; Yrs_Last_Teach_Pos, Tolerance = .22, VIF = 4.56; Tot_Yrs_Teach, Tolerance = .18, VIF = 5.60), although even these two variables are within the threshold. As can be seen in Table 6, moderately strong correlations were found between “a
61 school leaders’ total number of years teaching” (Tot_Yrs_Teach) and their “age” (Age), r(153) = .42, p < .001. A second correlation was between “the level of the school leaders’ agreement with the statement: The best way to increase student achievement in mathematics is to work with university researchers in a collaborative professional development” (ISAM3) and “the level of the school leaders’ agreement with the statement: The best way to increase student achievement in mathematics is to educate board members on the curriculum and research-based instructional strategies” (ISAM17), r(149) = .41, p < .00l. A third correlation was between “the level of the school leaders’ agreement with the statement: The best way to increase student achievement in mathematics is to provide teacher/aide tutoring for students” (ISAM12) and “the level of the school leaders’ agreement with the statement: The best way to increase student achievement in mathematics is to provide appropriate Tier II and Tier III instruction for students” (ISAM13), r(149) = .40, p < .001. A fourth correlation was between “the level of the school leaders’ agreement with the statement: The best way to increase student achievement in mathematics is to work with university researchers in a collaborative professional development” (ISAM3) and “the level of the school leaders’ agreement with the statement: The best way to increase student achievement in mathematics is to educate members of the legislature on the curriculum and research-based instructional strategies” (ISAM16), r(149) = .40, p < .001. Tests to see if the data met the assumption of collinearity indicated that multicollinearity was not a concern (see Appendix M). The researcher found moderate correlations between “the level of the school leaders’ agreement with the statement: The best way to increase student achievement in
62 mathematics is to educate members of the legislature on the curriculum and researchbased instructional strategies” (ISAM18) and “the level of the school leaders’ agreement with the statement: The best way to increase student achievement in mathematics is to work with university researchers in a collaborative professional development” (ISAM3), r(149) = .39, p < .001. A second moderate correlation was between “the school leaders’ perception of the amount of influence of national organizations such as NCTM over the implementation of the mathematics curriculum in their school” (Inf_Nat_Org2) and “the school leaders’ perception of the amount of influence of the state legislature over the implementation of the mathematics curriculum in their school” (Inf_State_Leg2), r(146) = .39, p < .001. A third correlation was between “if the school leader earned a major, minor, or special emphasis in secondary education” (Sec_Ed) and “if the school leader taught history/social studies” (Sub_T_H_SS), r(156) = .38, p < .001. A fourth correlation was between “the school leaders’ beliefs that certain aspects of geometry and measurement are critical foundations of algebra in grades10-12” (MTL62) and “the level of the school leaders’ agreement with the use of explicit instruction for students who struggle as an importance instructional strategy in the 10-12 mathematics classroom” (MTL55), r(92) = .36, p < .001. A fifth correlation was between “if the school leader taught 2nd grade” (Gr_T_2) and “the level of the school leaders’ agreement with the use of questioning as an importance instructional strategy in K-9 mathematics classrooms” (MTL36), r(144) = .36, p < .001. A sixth correlation was found between “the level of the school leaders’ agreement with the statement: The best way to increase student achievement in mathematics is to provide teacher/aide tutoring for students” (ISAM12)
63 and “the level of the school leaders’ agreement with the statement: The best way to increase student achievement in mathematics is to educate members of the legislature on the curriculum and research-based instructional strategies” (ISAM16), r(149) = .35, p < .001. A seventh correlation was between “the school leaders’ total number of years of teaching experience” (Yrs_Last_Teach_Pos) and the school leaders’ “age” (Age), r(154) = .33, p < .001). An eighth correlation was between “the level of the school leaders’ agreement with the statement: The best way to increase student achievement in mathematics is to provide teacher/aide tutoring for students” (ISAM12) and “the level of the school leaders’ agreement with the statement: The best way to increase student achievement in mathematics is to educate members of the legislature on the curriculum and research-based instructional strategies” (ISAM17), r(149) = .32, p < .001. A ninth correlation was between “the level of the school leaders’ agreement with the statement: The best way to increase student achievement in mathematics is to educate members of the legislature on the curriculum and research-based instructional strategies” (ISAM17) and “the level of the school leaders’ agreement with the statement: The best way to increase student achievement in mathematics is to provide appropriate Tier II and Tier III instruction for students” (ISAM13), r(149) = .32, p < .001. A 10th correlation was between “the level of the school leaders’ agreement with the statement: The best way to increase student achievement in mathematics is to educate members of the legislature on the curriculum and research-based instructional strategies” (ISAM18) and “the level of the school leaders’ agreement with the statement: The best way to increase student achievement in mathematics is to provide teacher/aide tutoring for students” (ISAM12),
64 r(149) = .31, p < .001. An 11th correlation was between “the level of the school leaders’ agreement with the statement: The best way to increase student achievement in mathematics is to provide appropriate Tier II and Tier III instruction for students” (ISAM13) and “if the school leader taught 2nd grade” (Gr_T_2), r(150) = .31, p < .001. Finally, a 12th correlation was between “the school leaders’ perception of the amount of influence of the state legislature over the implementation of the mathematics curriculum in their school” (Inf_State_Leg2) and “the level of the school leaders’ agreement with the use of rote practice (drill) as an importance instructional strategy in the 10-12 mathematics classroom” (MTL44), r(99) = .30, p = .002. Tests to see if the data met the assumption of collinearity indicated that multicollinearity was not a concern (see Appendix M). The researcher found moderately weak correlations between “a school leaders’ total number of years teaching” (Tot_Yrs_Teach) and “if the school leader taught 2nd grade (Gr_T_2), r(155) = .29, p < .001. A second correlation was between “if the school leader taught 2nd grade” (Gr_T_2) and “if the school leader taught Kindergarten” (Gr_T_K), r(156) = .29, p < .001. A third correlation was between “the level of the school leaders’ agreement with the use of explicit instruction for students who struggle as an importance instructional strategy in the 10-12 mathematics classroom” (MTL55) and “if the school leader taught 2nd grade” (Gr_T_2), r(95) = .28, p = .005. A fourth correlation was between “the school leaders’ perception of the amount of influence of national organizations such as NCTM over the implementation of the mathematics curriculum in their school” (Inf_Nat_Org2) and “the level of the school leaders’
65 agreement with the use of explicit instruction for students who struggle as an importance instructional strategy in the 10-12 mathematics classroom” (MTL55), r(95) = -.28, p = .006. A fifth correlation was between “the level of the school leaders’ agreement with the use of direct instruction for at least 50% of the time as an importance instructional strategy in the K-9 mathematics classroom” (MTL35) and the school leaders’ “age” (Age), r(140) = .27, p = .001. A sixth correlation was between “the level of the school leaders’ agreement with the statement: The best way to increase student achievement in mathematics is to educate members of the legislature on the curriculum and researchbased instructional strategies” (ISAM18) and “the level of the school leaders’ agreement with the use of cooperative work as the primary instructional practice in the K-9 mathematics classroom” (MTL39), r(140) = .27, p = .001. A seventh correlation was between “the level of the school leaders’ agreement with the statement: The best way to increase student achievement in mathematics is to educate members of the legislature on the curriculum and research-based instructional strategies” (ISAM18) and “the level of the school leaders’ agreement with the statement: The best way to increase student achievement in mathematics is to provide appropriate Tier II and Tier III instruction for students” (ISAM13), r(149) = .27, p = .001. An eighth correlation was between “the level of the school leaders’ agreement with the statement: The best way to increase student achievement in mathematics is to educate members of the legislature on the curriculum and research-based instructional strategies” (ISAM16) and “the level of the school leaders’ agreement with the statement: The best way to increase student achievement in mathematics is to provide appropriate Tier II and Tier III instruction for students”
66 (ISAM13), r(149) = .25, p = .002. A ninth correlation was between “the level of the school leaders’ agreement with the statement: The best way to increase student achievement in mathematics is to educate members of the legislature on the curriculum and research-based instructional strategies” (ISAM17) and “if the school leader taught an elective” (Sub_T_Elec), r(149) = .25, p = .002. A tenth correlation was between “the level of the school leaders’ agreement with the use of mathematical discourse being used at least 50% of the time in the 10-12 mathematics classroom” (MTL64) and “the school leaders’ perception of the amount of influence of teachers over the instructional methods used in the mathematics classroom at their school” (Inf_Teach3), r(91) = .25, p = .015. An eleventh correlation was between “the level of the school leaders’ agreement with the statement: The best way to increase student achievement in mathematics is to provide appropriate Tier II and Tier III instruction for students” (ISAM13) and “the level of the school leaders’ agreement with the use of questioning as an importance instructional strategy in K-9 mathematics classrooms” (MTL36), r(141) = .25, p = .003. Finally, a twelfth correlation was between the school leaders’ “age” (Age) and “the level of the school leaders’ agreement with the use of explicit instruction for students who struggle as an importance instructional strategy in the 10-12 mathematics classroom” (MTL55), r(95) = .25, p = .014. Tests to see if the data met the assumption of collinearity indicated that multicollinearity was not a concern (see Appendix M). Network analysis. The researcher conducted a network analysis in R using R packages “sna,” “igraph,” “visNetwork,” and “network” (Almende & Benoit, 2016; Butts, 2008, 2015, 2016; Csardi & Nespisz, 2006; R Core Team, 2016). The purpose of
67 the network analysis was to determine where to look for the possibility of any interaction effects or multiplicative looping effects among the 30 identified most important independent variables, as described in complexity theory (see Figure 5). In a network analysis, possible relationships are visualized through connecting lines that represent the
Figure 5. Network analysis. This figure illustrates to the researcher where to look for possible looping and interaction effects referencing SL-CAS conceptual framework.
68 correlations between variables. This analysis process allows a researcher to use a more educated approach when selecting variables to be included in the final predicative model relating school leaders’ characteristics with the school-wide average SAGE mathematics proficiency scores at their respective schools. In Figure 5, the network analysis shows the correlations between the 30 independent variables and the dependent variable, as shown by the connecting lines. These variables were then visualized within the categories aligned with the SL-CAS framework. For example, when looking at the top right oval, the blue colored variables are all school leader demographic specific variables. Thus, there appears to be multiple types of possible looping effects on the school leader. The researcher then looked specifically at these variable for these types of effects. When looking at the oval to the lower left, the brown and red variables contained in this oval are school leaders’ beliefs about instructional strategies or ways to increase student achievement. Creating this type of model allowed the researcher to see where to look for possible interaction effects between beliefs about instructional methods and various stakeholders. In summary, the possible looping effects would be found around the school leaders’ own characteristics, such as their age or experiences that may be influencing them more and more strongly over time. In addition, the possible interaction effects would be indicated by beliefs about instructional strategies and various stakeholders in the CAS, such as how strongly a school leader believes in the importance of cooperative work as an effective instructional strategy. Therefore, the researcher began to construct a final predictive model for schoolwide average SAGE mathematics proficiency scores using these indicated variables as
69 places in which to look for possible interaction effects and multiplicative looping effects. First multiple regression model and post-hoc regression analysis. Using educated guesses, an initial regression model was determined and a post-hoc regression analysis was then conducted to determine emergent phenomenon present at higher hierarchical levels of the CAS that would otherwise be rejected using traditional variable reduction (see Figure 6). Possible collinearity appears to be taking place between the interaction variable (Int_Inf_State_Leg2_MLT39) formed by “the school leaders’ perception of the amount of influence of the state legislature over the implementation of the mathematics curriculum in their school” (Inf_State_Leg2) and “the level of the school leaders’ agreement with the use of cooperative work as the primary instructional practice in the K9 mathematics classroom” (MTL39). A second possible collinearity appears to be taking place between the interaction variable (Int_Math_Ed_MTL62) formed by “if the school leader earned a major, minor, special emphasis in mathematics education” (Math_Ed) and “the school leaders’ beliefs that certain aspects of geometry and measurement are critical foundations of algebra in grades10-12” (MTL62) and “the percent of ethnic minority students at the school leaders’ school” (%EthMin). A third possible collinearity also appears between “the school leaders’ perception of the amount of influence of teachers over the instructional methods used in the mathematics classroom at their school” (Inf_Teach3) and “the percent of low-socioeconomic students at their school “(%LowSES). A fourth possible collinearity appears between the school leaders’ “age”
70
Figure 6. Post-hoc regression analysis of collinearity diagnostics. This figure illustrates possible emergent phenomenon present at higher hierarchical levels of a complex adaptive system (CAS) that need further comparison with their correlations without the involvement of the dependent variable.
71 (Age) with itself (indicating the possibility of a nonlinear multiplicative looping effect). And, finally, a fifth possible collinearity appears between the school leaders’ “age” (Age) and “the level of the school leaders’ agreement with the statement: The best way to increase student achievement in mathematics is to educate members of the legislature on the curriculum and research-based instructional strategies” (ISAM18). Using purely positivist regression reductionist methods, this would indicate possible variable elimination from the final predictive model of the school-wide average SAGE mathematics proficiency as predicted by school leader characteristics and student demographics. However, a correlation analysis between the variables in the model showed there were no significant correlations between these variables without the involvement of the dependent variable acting as the moderator (see Figure 7). As proposed by Gilstrap (2013), this provides evidence of possible emerging phenomenon at higher hierarchical levels of the CAS. Combined with the researchers’ qualitative data analysis, these variables should not be excluded in the final predictive model to answer the second research subquestion based on complexity theory. The final multiple regression analysis. The researcher calculated a multiple regression to predict school-wide average SAGE mathematics proficiency scores based on two interactions between the independent variables and seven other independent variables as determined by the qualitative results (see following sections for qualitative results). The first interaction included in the model was between “the school leaders’ perception of the amount of influence of the state legislature over the implementation of
72
Figure 7. Correlation analysis without involvement of dependent variable. This figure illustrates possible emergent phenomenon present at higher hierarchical levels of a complex adaptive system (CAS) indicating the need to keep these variables in the model based on Complexity Theory
the mathematics curriculum in their school” (Inf_State_Leg2) and “the level of the school leaders’ agreement with the use of cooperative work as the primary instructional practice in the K-9 mathematics classroom” (MTL39). The second interaction was between if “the school leader earned a major, minor, special emphasis in mathematics education” (Math_Ed) and “their beliefs about geometry and measurement as critical foundations of algebra in grades 10-12” (MTL62). The other seven independent variables included in the model were:
73 1. “the school leaders’ perception of the amount of influence of teachers over the instructional methods used in the mathematics classroom at their school” (Inf_Teach3), 2. “the school leaders’ perception of the amount of influence of national organizations such as NCTM over the implementation of the mathematics curriculum in their school” (Inf_Nat_Org2), 3. the school leader’s “age” (Age), 4. “the level of familiarity the school leader has with professional development/materials/readings in mathematics curriculum and instruction” (Fam_DI_CI_Doc), 5. “the level of the school leaders’ agreement with the statement: The best way to increase student achievement in mathematics is to educate members of the legislature on the curriculum and research-based instructional strategies” (ISAM18), 6. “the percentage of low-income students at the school’ (%LowSES), and 7. “the percentage of ethnic minority students at the school” (%EthMin). In addition, the researcher conducted several tests to check if the data met the assumptions required from the statistical tests, including linearity, normality of errors, and homoscedasticity. Final model assumptions. The following sections discuss the final model assumptions of linearity, normality, and homoscedasticity. Linearity. Graphing the standardized residuals against the interaction of the independent variables “between the school leaders’ perception of the amount of influence of the state legislature over the implementation of the mathematics curriculum in their school” (Inf_State_Leg2) and “the level of the school leaders’ agreement with the use of cooperative work as the primary instructional practice in the K-9 mathematics classroom” (MTL39), provides evidence that the assumption of linearity was met (see Figure 8).
74
Figure 8. Standardized residual plot against interaction variable (Inf_State_Leg2*MTL39). This figure illustrates linearity because the data are fairly symmetrically distributed without any clear patterns. Graphing the standardized residuals against the interaction of the independent variables “if the school leader earned a major, minor, special emphasis in mathematics education” (Math_Ed) and “the school leaders’ beliefs that certain aspects of geometry and measurement are critical foundations of algebra in grades10-12” (MTL62), provides evidence that the assumption of linearity was met (see Figure 9). Normality. The assumption of normality was tested via examination of the standardized residuals. Review of the regression standardized residual histogram and the Normal P-P plot (sees Figures 10 and 11 suggest the assumption of normality is reasonable.
75
Figure 9. Standardized residual plot against interaction variable (Math_Ed*MTL62). This figure illustrates linearity because the data are fairly symmetrically distributed without any clear patterns.
76
Figure 10. Normal P-P plot. This figure illustrates evidence that the assumption of normality of the final predictive model is reasonable.
77
Figure 11. Histogram showing the Standardized Residuals to the 2015 SAGE SchoolWide Average Mathematics Proficiency Scores. This figure illustrates evidence that the assumption of normality of the final predictive model is reasonable.
Homoscedasticity. A relatively random display of points where the spread of residuals appears fairly constant over the range of the interaction between the independent variables (Inf_State_Leg2 and MTL39, see Figure 12) provided evidence of homoscedasticity. There are some concerns for homoscedasticity between the variables (Math_Ed and MTL62, see Figure 13) but visual inspection finds the spread of residuals to meet the assumption well enough.
78
Figure 12. Spread of residuals over the range of interaction for Inf_State_Leg2_MTL39. This figure illustrates evidence that the assumption of homoscedasticity is met. . Final predictive model based on complexity theory. Based on these assumptions, the researcher found a significant regression equation, F(13, 65) = 6.91, p Butts, C. (2015). _network: Classes for relational data_ (Version R package version1.13.0). The Statnet Project (). Retrieved from http://CRAN.R-project.org/package=network> Butts, C. (2016). sna: Tools for social network analysis (Version R package version 2.4). Retrieved from https://CRAN.R-project.org/package=sna Campbell, P. F., Nishio, M., Smith, T. M., Clark, L. M., Conant, D. L., Rust, A. H., … Choi, Y. (2014). The relationship between teachers’ mathematical content and pedagogical knowledge, teachers’ perceptions, and student achievement. Journal for Research in Mathematics Education, 45(4), 419-459. https://doi.org/10.5951/ jresematheduc.45.4.0419 Carver, C. L. (2010). Principals + algebra (- fear) = instructional leadership. Journal of Staff Developfhoment, 31(5), 30-33.
162 Chorpita, B. F., & Daleiden, E. L. (2014). Structuring the collaboration of science and service in pursuit of a shared vision. Journal of Clinical Child & Adolescent Psychology, 43(2), 323-338. https://doi.org/10.1080/15374416.2013.828297 Claro, S., Paunesku, D., & Dweck, C. S. (2016). Growth mindset tempers the effects of poverty on academic achievement. Proceedings of the National Academy of Sciences, 113(31), 8664-8668. https://doi.org/10.1073/pnas.1608207113 Collins, K. T. (2010). Advanced sampling designs in mixed research: Current practices and emerging trends in the social and behavioral sciences. In A. Tashakkori & C. Teddlie (Eds.), Sage handbook of mixed methods in social and behavioral research (2nd ed., pp. 353-377). Thousand Oaks, CA: Sage. Corcoran, S. P., Schwartz, A. E., & Weinstein, M. (2012). Training your own: The impact of New York City’s aspiring principals program on student achievement. Educational Evaluation and Policy Analysis, 34(2), 232-253. Cramer, D. (1998). Fundamental statistics for social research: Step-by-step calculations and computer techniques using SPSS for Windows. New York, NY: Psychology Press. Retrieved from https://books.google.com/books?hl=en&lr=&id= LB7FrGHUqNoC&oi=fnd&pg=PR6&dq=Fundamental+statistics+for+social+res earch&ots=cB1uXHELvA&sig=PhoV20hKKvh1mUSSpWxT1WgSpxs Cramer, D., & Howitt, D. L. (2004). The Sage dictionary of statistics: A practical resource for students in the social sciences. Thousand Oaks, CA: Sage. Retrieved from https://books.google.com/books?hl=en&lr=&id=pa3_49Mpso4C&oi= fnd&pg=PP1&dq=SAge+dictionary+of+statistics&ots=YqxhlSjwu&sig=HlF9XowBJWQ6b_h-1rt88b9-CsI Creswell, J. W. (2013). Qualitative inquiry & research design: Choosing among five approaches (3rd ed.). Thousand Oaks, CA: Sage. Creswell, J. W., & Plano Clark, V. L. (2011). Designing and conducting mixed methods research (2nd ed.). Thousand Oaks, CA: Sage. Csardi, G., & Nespisz, T. (2006). The igraph software package for complex network research. InterJournal, Complex Systems 1695. Retrieved from http://igraph.org D’Agostino, J. V. (2000). Instructional and school effects on students’ longitudinal reading and mathematics achievements. School Effectiveness and School Improvement, 11(2), 197-235. Davis, B., Phelps, R., & Wells, K. (2004). Complicity: An introduction and a welcome. Complicity: An International Journal of Complexity and Education, 1(1), 1-7.
163 Davis, B., & Sumara, D. (2008). Complexity and education: Inquires into learning, teaching, and research. New York, NY: Routledge. Dee, T. S., & Jacob, B. (2011). The impact of No Child Left Behind on student achievement. Journal of Policy Analysis and Management, 30(3), 418-446. https://doi.org/10.1002/pam.20586 Dewey, J. (1998). Experience and education: The 60th anniversary edition. West Lafayette, IN: Kappa Delta Pi. Dinham, S. (2005). Principal leadership for outstanding educational outcomes. Journal of Educational Administration, 43(4), 338-356. Doane, D. P., & Seward, L. E. (2011). Measuring skewness: A forgotten statistic. Journal of Statistics Education, 19(2), 1-18. DuFour, R., & Marzano, R. J. (2011). Leaders of learning: How district, school, and classroom leaders improve student achievement. Bloomington, IN: Solution Tree Press. Dumay, X., Boonen, T., & Van Damme, J. (2013). Principal leadership long-term indirect effects on learning growth in mathematics. Elementary School Journal, 114(2), 225-251. Edhlund, B., & McDougall, A. (2016). NVivo 11 essentials. Lulu. com. Retrieved from https://books.google.com/books?hl=en&lr=&id=hQObCwAAQBAJ&oi=fnd&pg =PA21&dq=NVIVO11&ots=45R6sfnbPt&sig=WHSMNjFnuujsmplkE0U0ziKw xbQ Entwisle, D. R., & Alexander, K. L. (1992). Summer setback: Race, poverty, school Composition, and mathematics achievement in the first two years of school. American Sociological Review, 57(1), 72-84. https://doi.org/10.2307/2096145 Eriksen, M., & Cunliffe, A. (2010). Relational leadership. Complicity: An International Journal of Complexity and Education, 7(2), 97-100. Fleener, M. J. (2016). Re-searching methods in educational research: A transdiciplinary approach. In M. Koopmans & D. Stamovlasis (Eds.), Complex dynamical systems in education: Concepts, methods and applications (pp. 9-22). New York, NY: Springer International Publishing. Follett, M. P. (1924). The creative experience. Рипол Классик. Retrieved from https://books.google.com/books?hl=en&lr=&id=Eg8IAwAAQBAJ&oi=fnd&pg= PR9&dq=Follett+1924+The+creative+experience&ots=QaeUj_06P4&sig=cPjCO vJcyFaD81hG9xfUkEDfQV0
164 Forster, B. R. (1983). Pupil productivity in elementary school mathematics as related to principal and teacher leadership style (doctoral dissertation). The College of William and Mary, Williamsburg, VA. Retrieved from http://search.proquest. com/pqdtft/docview/303282232/1C7522E606A3482DPQ/8?accountid=14761 Gaffney, M., & Faragher, R. (2010). Sustaining improvement in numeracy: Developing pedagogical content knowledge and leadership capabilities in tandem. Mathematics Teacher Education and Development, 12(2), 72-83. Gies, B. (2004). The building principal as an instructional leader: Common characteristics that increase student performance in mathematics (doctoral dissertation). University of Idaho, Moscow, ID. Retrieved from http://search. proquest.com/pqdtft/docview/305198786/abstract/1C7522E606A3482DPQ/2?acc ountid=14761 Gilstrap, D. (2005). Strange attractors and human interaction: Leading complex organizations through the use of metaphors. Complicity: An International Journal of Complexity and Education, 2(1), 55-69. Gilstrap, D. (2013). Quantitative research methods on chaos and complexity: From probability to post hoc regression analysis. Complicity: An International Journal of Complexity and Education, 10(1/2), 57-70. Goldhaber, D., Lavery, L., & Theobald, R. (2015). Uneven playing field? Assessing the teacher quality gap between advantaged and disadvantaged students. Educational Researcher, 44(5), 293-307. https://doi.org/10.3102/0013189X15592622 Gordon, M. F., & Louis, K. S. (2009). Linking parent and community involvement with student achievement: Comparing principal and teacher perceptions of stakeholder influence. American Journal of Education, 116(1), 1-32. Graham, P. (Ed.). (1995). Mary Parker Follett: Prophet of management: A celebration of writings from the 1920s. Boston, MA: Harvard Business School Press. Greenleaf, R. (1970). The servant as leader. Indianapolis, IN: Robert K. Greenleaf Center for Servant-Leadership. Greenleaf, R. (1977). Servant leadership: A journey into the nature of legitimate power and greatness. New York, NY: Paulist Press. Grotzer, T. (2012). Learning causality in a complex world: Understandings of consequence. Lantham, MD: Rowman & Littlefield Education. Hallinger, P., Heck, R. H., & Murphy, J. (2014). Teacher evaluation and school improvement: An analysis of the evidence. Educational Assessment, Evaluation and Accountability, 26(1), 5-28. https://doi.org/10.1007/s11092-013-9179-5
165 Hazy, J. K., & Uhl-Bien, M. (2014). Changing the rules: The implications of complexity science for leadership research and practice. In D. V. Day & D. V. Day (Eds.), The Oxford handbook of leadership and organizations. (pp. 709-732). New York, NY: Oxford University Press. Heck, R. H., & Hallinger, P. (2009). Assessing the contribution of distributed leadership to school improvement and growth in math achievement. American Educational Research Journal, 46(3), 659-689. Heifetz, R. A. (1994). Leadership without easy answers. Cambridge, MA: Belknap. Heifetz, R. A., Grashow, A., & Linsky, M. (2009). The practice of adaptive leadership: Tools and tactics for changing your organization and the world. Boston, MA: Harvard University Press. Heifetz, R. A., & Laurie, D. L. (1997). The work of leadership. Harvard Business Review, 7(1), 124-134. Heifetz, R. A., & Linsky, M. (2002). Leadership on the line: Staying alive through the dangers of leading. Boston, MA: Harvard Business School Press. Heifetz, R. A., & Sinder, R. M. (1988). Political leadership: Managing the public’s problem solving. In R. B. Reich (Ed.), The power of public ideas (pp. 179-204). Boston, MA: Harvard University Press. Henry, G. T., Purtell, K. M., Bastian, K. C., Fortner, C. K., Thompson, C. L., Campbell, S. L., & Patterson, K. M. (2014). The effects of teacher entry portals on student achievement. Journal of Teacher Education, 65(1), 7-23. https://doi.org/10.1177/ 0022487113503871 Hiebert, J. S., & Grouws, D. A. (2007). The effects of classroom mathematics teaching on students’ learning. In F. K. Lester (Ed.), Second handbook of research on mathematics teaching and learning (pp. 371-404). Charlotte, NC: Information Age. Higgins, J., & Bonne, L. (2011). Configurations of instructional leadership enactments that promote the teaching and learning of mathematics in a New Zealand elementary school. Educational Administration Quarterly, 47(5), 794-825. Hill, H. C., Sleep, L., Lewis, J. M., & Ball, D. L. (2007). Assessing teachers’ mathematical knowledge: What knowledge matters and what evidence counts? In F. K. Lester (Ed.), Second handbook of research on mathematics teaching and learning (pp. 111-156). Charlotte, NC: Information Age.
166 Ho, T. K. (1995). Random decision forests. In Document Analysis and Recognition, 1995., Proceedings of the Third International Conference on Document Analysis and Recognition (Vol. 1, pp. 278-282). Montreal, Canada: IEEE. Retrieved from http://ieeexplore.ieee.org/xpls/abs_all.jsp?arnumber=598994 Ho, T. K. (2002). A data complexity analysis of comparative advantages of decision forest constructors. Pattern Analysis & Applications, 5(2), 102-112. Holland, J. H. (1995a). Hidden order: How adaptation builds complexity. New York, NY: Basic Books. Holland, J. H. (1995b, May). Innovation, risk and lever points. Paper presented at theComplexity and Strategy: The Intelligent Organisation, Santa Fe Institute and The Praxis Group Ltd, London, England. Holland, J. H. (2002). Complex adaptive systems and spontaneous emergence. In A. Q. Curzio & M. Fortis (Eds.), Complexity and industrial clusters (pp. 25-34). Berlin, Germany: Physica-Verlag. Holland, J. H. (2006). Studying complex adaptive systems. Journal of Systems Science and Complexity, 19(1), 1-8. Holland, J. H. (2014). Complexity: A very short introduction. New York, NY: Oxford University Press. Huggins, K. S., Scheurich, J. J., & Morgan, J. R. (2011). Professional learning communities as a leadership strategy to drive math success in an urban high school serving diverse, low-income students: A case study. Journal of Education for Students Placed at Risk, 16(2), 67-88. Huizinga, T., Handelzalts, A., Nieveen, N., & Voogt, J. M. (2014). Teacher involvement in curriculum design: Need for support to enhance teachers’ design expertise. Journal of Curriculum Studies, 46(1), 33-57. https://doi.org/10.1080/ 00220272.2013.834077 Johnson, E. S. (2008). Ecological systems and complexity theory: Toward an alternative model of accountability in education. Complicity: An International Journal of Complexity and Education, 5(1), 1-10. Johnson, J. (2013). The human factor. Educational Leadership, 70(7), 16-21. Jordan, M. E. (2010). Mathematics as a complex system: Learning in complex adaptive systems. Complicity: An International Journal of Complexity and Education, 7(1), 70-76.
167 Jörg, T. (2011). New thinking in complexity for the social sciences and humanities: A generative, transdisciplinary approach. New York, NY: Springer. Jörg, T. (2014). The crisis of knowing in the age of complexity. In M. E. Jennec (Ed.), Knowledge, discovery, transfer, and management in the age of transformation (pp. 1-19). Hershey, PA: IGI Global. Jörg, T. (2016). Opening the wondrous world of the possible for education: A generative complexity approach. In M. Koopmans & D. Stamovlasis (Eds.), Complex dynamical system in education: Concepts, methods and applications (pp. 59-92). New York, NY: Springer International Publishing. Jӓppinen, A. I. K. A. (2014). Collaborative educational leadership: The emergence of human interactional sense-making process as a complex system. Complicity: An International Journal of Complexity and Education, 11(2), 65-85. Kliebard, H. M. (2004). The struggle for the American curriculum (3rd ed.). New York, NY: RoutledgeFalmer. Koopmans, M. (2014). Change, self-organization and the search for causality in educational research and practice. Complicity: An International Journal of Complexity and Education, 11(1), 20-39. Koopmans, M. (2016). Investigating the long memory process in daily high school attendance data. In M. Koopmans & D. Stamovlasis (Eds.), Complex dynamical systems in education: Concepts, methods, and applications (pp. 299-321). New York, NY: Springer International Publishing. Koopmans, M., & Stamovlasis, D. (Eds.). (2016). Complex dynamical systems in education: Concepts, methods and applications. New York, NY: Springer International Publishing. Kouzes, J. M., & Posner, B. Z. (1987). The leadership challenge: How to get extraordinary things done in organizations. San Francisco, CA: Jossey-Bass. Kouzes, J. M., & Posner, B. Z. (2002). The leadership challenge (3rd ed.). San Francisco, CA: Jossey-Bass. Kythreotis, A., Pashiardis, P., & Kyriakides, L. (2010). The influence of school leadership styles and culture on students’ achievement in Cyprus primary schools. Journal of Educational Administration, 48(2), 218-240. Leithwood, K., Seashore Louis, K., Anderson, S., & Wahlstrom, K. (2004). Review of research: How leadership influences student learning. St. Paul, MN: University of Minnesota, Center for Applied Research and Educational Improvement. Retrieved from http://conservancy.umn.edu/handle/11299/2035
168 Lemons, C. D. (2012). A case study of principal engagement, teachers’ self-reflections, and student mathematics achievement in a Title I school (doctoral dissertation). Mercer University, Macon, GA. Retrieved from http://search.proquest.com/pqdtft/ docview/1041251576/abstract/1C7522E606A3482DPQ/5?accountid=14761 Liaw, A., & Wiener, M. (2002). Classification and regression by randomForest. R News, 2(3), 18-22. Lincoln, Y. S., & Guba, E. G. (1985). Naturalistic inquiry. Beverly Hills, CA: Sage. Loucks-Horsley, S., Stiles, K. E., Mundry, S., Love, N., & Hewson, P. W. (2010). Designing professional development for teachers of science and mathematics (3rd ed.). Thousand Oaks, CA: Corwin. Marion, R., & Schreiber, C. (2016). Evaluating complex educational systems with quadratic assignment problem and exponential random graph model methods. In M. Koopmans & D. Stamovlasis (Eds.), Complexy dynamical systems in education (pp. 117-201). New York, NY: Springer International Publishing. Marzano, R. J. (2003). What works in schools: Translating research into action. Alexandria, VA: Association for Supervision and Curriculum Development. Marzano, R. J., Waters, T., & McNulty, B. A. (2005). School leadership that works. Alexandria, VA: ASCD. Mason, M. (2008). Complexity theory and the philosophy of education. Educational Philosophy and Theory, 40(1), 4-18. McClellan, J. L. (2010). Leadership and complexity: Implications for practice within the advisement leadership bodies at colleges and universities. Complicity: An International Journal of Complexity and Education, 7(2), 32-51. McLeod, N. (2008). Exploring the relationship between school leadership and middle school mathematics achievement: An examination of leadership practices of principals (doctoral dissertation). University of Maryland, College Park, MD. Retrieved from http://search.proquest.com/pqdtft/docview/250909725/ abstract/1C7522E606A3482DPQ/16?accountid=14761 Mowat, E., & Davis, B. (2010). Interpreting embodied mathematics using network theory: Implication for mathematics education. Complicity: An International Journal of Complexity and Education, 7(1), 1-31. National Council of Teachers in Mathematics. (2014). Principles to actions: Ensuring mathematical success for all. Reston, VA: Author.
169 Nelson, B. S. (2010). How elementary school principals with different leadership content knowledge profiles support teachers’ mathematics instruction. New England Mathematics Journal, 42, 43-53. Northouse, P. G. (2016). Leadership: Theory and practice (7th ed.). Thousand Oaks, CA: Sage. Osberg, D., Biesta, G., & Cilliers, P. (2008). From representation to emergence: Complexity’s challenge to the epistemology of schooling. Educational Philosophy and Theory, 40(1), 213-227. Ottmar, E. R., Rimm-Kaufman, S. E., Larsen, R. A., & Berry, R. Q. (2015). Mathematical knowledge for teaching, standards-based mathematics teaching practices, and student achievement in the context of the responsive classroom approach. American Educational Research Journal, 52(4), 787-821. https://doi.org/10.3102/0002831215579484 Page, S. E. (2009). Understanding complexity. Chantilly, VA: Teaching Company. Payne, K. J., & Biddle, B. J. (1999). Poor school funding, child poverty, and mathematics achievement. Educational Researcher, 28(6), 4-13. https://doi.org/10.3102/0013189X028006004 Pennings, H. J. M., & Mainhard, T. (2016). Analyzing teacher-student interactions with state space grids. In M. Koopmans & D. Stamovlasis (Eds.), Complex dynamical systems in education. New York, NY: Springer International Publishing. Philipp, R. (2007). Mathematics teachers’ beliefs and affect. In F. K. Lester (Ed.), Second handbook of research on mathematics teaching and learning (pp. 257-315). Charlotte, NC: Information Age. Postell, K. (2009). The impact of selected principal leadership behaviors on elementary school students’ reading and mathematics achievement in southeast Maryland (doctoral dissertation). South Carolina State University, Orangeburg, SC. Retrieved from http://search.proquest.com/pqdtft/docview/751611214/abstract/ 1C7522E606A3482DPQ/6?accountid=14761 Presmeg, N. G. (2007). The role of culture in teaching and learning mathematics. In F. K. Lester (Ed.), Second handbook of research on mathematics teaching and learning. Charlotte, NC: Information Age. R Core Team. (2016). R: A language and environment for statistical computing. Vienna, Austria: R Foundation for Statistical Computing. Retrieved from https://www.Rproject.org/
170 Razali, N. M., & Wah, Y. B. (2011). Power comparisons of Shapiro-Wilk, KolmogorovSmirnov, Lilliefors and Anderson-Darling tests. Journal of Statistical Modeling and Analytics, 2(1), 21-33. Resnicow, K., & Page, S. E. (2008). Embracing chaos and complexity: A quantum change for public health. American Journal of Public Health, 98(8), 1382-1389. Rittle-Johnson, B., & Star, J. R. (2007). Does comparing solution methods facilitate conceptual and procedural knowledge? An experimental study on learning to solve equations. Journal of Educational Psychology, 99(3), 561-574. https://doi.org/10.1037/0022-0663.99.3.561 Rittle-Johnson, B., & Star, J. R. (2009). Compared with what? The effects of different comparisons on conceptual knowledge and procedural flexibility for equation solving. Journal of Educational Psychology, 101(3), 529-544. https://doi.org/10.1037/a0014224 Ronfeldt, M., Farmer, S. O., McQueen, K., & Grissom, J. A. (2015). Teacher collaboration in instructional teams and student achievement. American Educational Research Journal, 52(3), 475-514. https://doi.org/10.3102/ 0002831215585562 Roschelle, J. (2000). Choosing and using video equipment for data collection. In Handbook of research design in mathematics and science education (pp. 709731). Mahwah, NJ: Erlbaum. Roschelle, J. (2011). Choosing and using video equipment for data collection. In A. E. Kelly & R. A. Lesh (Eds.), Handbook of research design in mathematics and science education (pp. 709-729). New York, NY: Routledge. Rosenau, J. N. (1997). Many damn things simultaneously: Complexity theory and world affairs. Complexity, Global Politics, and National Security, 73-100. Roueche, P. E. D., Baker, G. A., III, & Rose, R. R. (2014). Shared vision: Transformational leadership in American community colleges. Washington DC: Rowman & Littlefield. Santos, J. R. A. (1999). Cronbach’s alpha: A tool for assessing the reliability of scales. Journal of Extension, 37(2), 1-5. Schoen, R. C. (2010). Professional vision: Elementary school principals’ perceptions of mathematics instruction (doctoral dissertation). The Florida State University, Tallahassee, FL. Retrieved from http://search.proquest.com/pqdtft/docview/ 740213554/abstract/1C7522E606A3482DPQ/13?accountid=14761
171 Shapiro, S. S., & Wilk, M. B. (1965). An analysis of variance test for normality (complete samples). Biometrika, 52(3/4), 591-611. Shin, S. H., & Slater, C. L. (2010). Principal leadership and mathematics achievement: An international comparative study. School Leadership & Management, 30(4), 317-334. Smith, L. (2007). Chaos: A very short introduction. New York, NY: Oxford University Press. Smith, W. F., & Andrews, R. L. (1989). Instructional leadership: How principals make a difference. Alexandria, VA: Association for Supervision and Curriculum Development. Spillane, J. P., Healey, K., & Mesler Parise, L. (2009). School leaders’ opportunities to learn: A descriptive analysis from a distributed perspective. Educational Review, 61(4), 407-432. Spillane, J. P., & Kim, C. M. (2012). An exploratory analysis of formal school leaders’ positioning in instructional advice and information networks in elementary schools. American Journal of Education, 119(1), 73-102. Stamovlasis, D. (2016). Nonlinear dynamical interaction patterns in collaborative groups: Discourse analysis with orbital decomposition. In M. Koopmans & D. Stamovlasis (Eds.), Complex dynamical systems in education (pp. 273-297). New York, NY: Springer International Publishing. Stanley, D. (2006). Comparative dynamics: Healthy collectivities and pattern which connects. Complicity: An International Journal of Complexity and Education, 3(1), 73-82. Stein, M. K., Remillard, J., & Smith, M. S. (2007). How curriculum influences student learning. In F. K. Lester (Ed.), Second handbook of research on mathematics teaching and learning (pp. 319-369). Charlotte, NC: Information Age. Strese, S., Keller, M., Flatten, T. C., & Brettel, M. (2016). CEOs’ passion for inventing and radical innovations in SMEs: The moderating effect of shared vision. Journal of Small Business Management, 1-18 https://doi.org/10.1111/jsbm.12264 Stronge, J. (2013). Effective teachers=student achievement: What the research says. New York, NY: Routledge. Svyantek, D. J., & Brown, L. L. (2000). A complex-systems approach to organizations. Current Directions in Psychological Science, 9(2), 69-74.
172 System [Def. 1]. (2015). Dictionary.com. Retrieved from http://dictionary.reference. com/browse/system?s=t Tashakkori, A., & Teddlie, C. (2008). Quality of inferences in mixed methods research: Calling for an integrative framework. In M. M. Bergman (Ed.), Advances in mixed methods research (pp. 101-119). London, England: Sage. Tavakol, M., & Dennick, R. (2011). Making sense of Cronbach’s alpha. International Journal of Medical Education, 2, 53-55. Therneau, T., Atkinson, B., & Ripley, B. (2015). rpart: Recursive partitioning and regression trees (Version R package version 4.1-10). Retrieved from https://CRAN.R-project.org/package=rpart Uhl-Bien, M., & Marion, R. (Eds.). (2008). Complexity leadership: Part I: Conceptual foundations. Charlotte, NC: Information Age. Uhl-Bien, M., & McKelvey, B. (2007). Complexity leadership theory: Shifting leadership from the industrial age to the knowledge era. Leadership Quarterly, 18, 298-318. Utah State Office of Education. (2015a). Utah’s 2015-16 educational directory. Salt Lake City, UT: Author. Retrieved from www.school.utah.gov Utah State Office of Education. (2015b). Utah’s public schools add 11,743 students this year [Press release]. Retrieved from http://schools.utah.gov/main/ INFORMATION/Online-Newsroom/DOCS/2015/Enrollment.aspx Uswatte, D. (2013). A quantitative study of mathematics teaching self- efficacy and principal instructional leadership in Alabama elementary schools (doctoral dissertation). The University of Alabama at Birmingham, Birmingham, AL: Retrieved from http://search.proquest.com/pqdtft/docview/1491381109/ abstract/1C7522E606A3482DPQ/3?accountid=14761 Vale, C., Davies, A., Weaven, M., Hooley, N., Davidson, K., & Loton, D. (2010). Leadership to improve mathematics outcomes in low SES schools and school networks. Mathematics Teacher Education and Development, 12(2), 47-71. van Vondel, S., Steenbeck, H., van Dijk, M., & van Geert, P. (2016). “Looking at” educational interventions: Surplus value of a complex dynamic systems approach to study the effectiveness of a science and technology educational intervention. In M. Koopmans & D. Stamovlasis (Eds.), Complex dynamical systems in education. New York, NY: Springer International Publishing. Vaughn, S., Schumm, J. S., & Sinagub, J. (1996). Focus group interviews in education and psychology. Thousand Oaks, CA: Sage.
173 Von Neumann, J. (1956). Probabilistic logics and the synthesis of reliable organisms from unreliable components. Automata Studies, 34, 43-98. Vygotsky, L. S. (1978). Mind in society: The development of higher psychological processes. (M. Cole, V. John-Steiner, S. Scribner, & E. Souberman, Eds.). Cambridge, MA: Harvard University Press. Walker-Glenn, M. L. (2010). Leadership for school numeracy: How school leaders’ knowledge and attitudes impact student mathematics achievement (doctoral dissertation). Miami University, Oxford, OH. Retrieved from http://search. proquest.com/pqdtft/docview/366353282/1C7522E606A3482DPQ/15?accountid= 14761 Wasserman, S., & Faust, K. (1994). Social network analysis: Methods and applications. Cambridge, MA: Cambridge University Press. Wickham, H. (2009). ggplot2: Elegant graphics for data analysis. New York, NY: Springer-Verlag. Wickham, H., & Francois, R. (2016). dplyr: A grammar of data manipulation (Version R package version 0.5.0). Retrieved from https://CRAN.R-project.org/ package=dplyr Wickham, H., & Miller, E. (2016). haven: Import and export “SPSS”, “Stata” and “SAS” files (Version R package version 1.0.0). Retrieved from https://CRAN.Rproject.org/package=haven Williams, D. R. (2010). Characteristics of elementary school principals and the relationship to student achievement in mathematics (doctoral dissertation). Southeastern Louisiana University, Hammond, LA. Retrieved from http://search.proquest.com/pqdtft/docview/305248545/abstract/1C7522E606A348 2DPQ/18?accountid=14761
174
APPENDICES
175
Appendix A IRB Approval
176
177
Appendix B Survey Informed Consent
178
Department of Teacher Education and Leadership (TEAL) 2805 Old Main Hill Logan UT 84322-2805 Telephone: (435) 797-0389
INFORMED CONSENT AN EXPLANATORY SEQUENTIAL MIXED METHODS STUDY OF THE SCHOOL LEADERS’ ROLE IN INFLUENCING MATHEMATICS LEARNING IN THE CONTEXT OF COMPLEXITY THEORY Introduction/ Purpose Dr. Moyer-Packenham and doctoral candidate, Emma Bullock, in the Department of TEAL at Utah State University are conducting a research study to find out more about the role school leaders play in promoting student mathematics learning. You have been asked to take part because you are a K-12, Utah public school leader/principal. There will be approximately 374 total participants in this phase of the research study. Procedures If you agree to be in this research study, you will participate in one 20 minute survey. Participation is voluntary. The survey instrument that will be used is the Principal’s Mathematics Questionnaire which aligns with the SL-CAS theoretical framework. This survey of school leaders will begin with a portion where participants are asked to give IRB consent to participate in the survey. The survey will include questions covering general demographics, teaching experiences, administrative experiences, mathematics demographics, and perceived influence on mathematics curriculum and instruction, mathematics curriculum, and mathematics teaching and achievement. This survey is adapted from Williams’ (2010) Principal’s Elementary Mathematics Questionnaire and will be distributed via SurveyMonkey. Risks Participation in this research study may involve some added risks or discomforts. These include the small risk of loss of confidentiality, discomfort with the survey questions, and possible unforeseen risks that could occur. However, the researcher will take all steps necessary to reduce these risks. You may view SurveyMonkey’s Security Statement at the following link: https://www.surveymonkey.com/mp/policy/security/ Benefits There are no expected direct benefits. Possible indirect benefits may be reflection on current practice for the immediate participants. On a broader scale, this study serves to inform future research on aspects of school leadership through the lens of complexity theory, including the use of the School Leadership in a Complex Adaptive System (SL-CAS) Framework to understand the role school leaders play in students’ mathematics achievement, for possible goals other than students’ mathematics achievement, and the use of other stakeholders as the units of analysis. This study is significant because schools are being held increasingly accountable for students’ mathematics achievement. School leaders and researchers need to understand how to make decisions that will allow for the most effective use of resources, time, and professional development within the complex realities that exist in schools to achieve higher mathematics achievement for all students. The knowledge gained from this study will give direction to researchers and school leaders on the nature of complex adaptive school systems and address pragmatically the understanding of the school leaders’ actions to effectively move a CAS toward the goal of a shared vision which promotes higher student mathematics achievement.
179 Explanation & offer to answer questions Dr. Patricia Moyer-Packenham and Emma Bullock has explained this research study to you and answered your questions. If you have other questions or researchrelated problems, you may Emma Bullock at (801) 808-6985 or
[email protected] or Dr. Patricia Moyer-Packenham at (435) 797-2597. Compensation All participants who complete the survey will receive a $5 gift card of their choice to one of the following vendors: Subway, Kneaders, McDonald’s, or Wendy’s. Participants will need to provide their first and last name and an address for the gift card to be mailed. Voluntary nature of participation and right to withdraw without consequence Participation in research is entirely voluntary. You may refuse to participate or withdraw at any time without consequence or loss of benefits. Please contact Emma Bullock at (801) 808-6985 or
[email protected] to be withdrawn from this study. Confidentiality Research records will be kept confidential, consistent with federal and state regulations. Only the investigator will have access to the data which will be kept in a secure USU Box.com file. While the investigators will know your identities, to protect your privacy, personal, identifiable information will be removed from study documents and replaced with a study identifier for all publication of results. Identifying information will be stored separately from data and will be kept separately in a secure USU Box.com file. All personally identifiable data will be stored until the completion of the study (March 30th, 2018) and then destroyed and investigators will keep all knowledge of participation confidential and sign confidentiality agreements. De-identifiable data will be kept indefinitely. IRB Approval Statement The Institutional Review Board for the protection of human participants at Utah State University has approved this research study. If you have any questions or concerns about your rights or a research-related injury and would like to contact someone other than the research team, you may contact the IRB Administrator at (435) 797-0567 or email
[email protected] to obtain information or to offer input. Copy of consent Participation in the survey will be acknowledgement of consent to participate. If you would like a hard copy of your consent, please contact Emma Bullock at
[email protected] and one will be sent to you. Investigator Statement “I certify that the research study has been explained to the individual, by me or my research staff, and that the individual understands the nature and purpose, the possible risks and benefits associated with taking part in this research study. Any questions that have been raised have been answered.”
Signature of Researcher(s)
_______________________________________ Dr. Patricia Moyer-Packenham Professor, Mathematics Education Director, Mathematics Education and Leadership Programs School of Teacher Education and Leadership 318 Emma Eccles Jones Early Childhood Education and Research Center Utah State University 2605 Old Main Hill Logan, UT 84322-2605 (435) 797-2597
[email protected]
Date
180 _______________________________ Emma Bullock Student Researcher/Doctoral Candidate (801) 808-6985
[email protected]
______________________________ Date
Signature of Participant By signing below, I verify that I am 18 years of age or older and consent to participate in this study. _______________________________ Participant’s signature
______________________________ Date
181
Appendix C Focus Group Informed Consent
182
Department of Teacher Education and Leadership (TEAL) 2805 Old Main Hill Logan UT 84322-2805 Telephone: (435) 797-0389
INFORMED CONSENT AN EXPLANATORY SEQUENTIAL MIXED METHODS STUDY OF THE SCHOOL LEADERS’ ROLE IN INFLUENCING MATHEMATICS LEARNING IN THE CONTEXT OF COMPLEXITY THEORY Introduction/ Purpose Dr. Patricia Moyer-Packenham and doctoral candidate, Emma Bullock, in the Department of TEAL at Utah State University is conducting a research study to find out more about the role school leaders play in promoting student mathematics learning. You have been asked to take part because you are a K-12, Utah public school leader/principal. There will be approximately 18-24 total participants in this phase of the research study. Procedures If you agree to be in this research study, you will participate in one 2-hour, video-taped, and audio-recorded, focus-group interview session. This session will be held at a neutral site. Participation is voluntary. The bulk of the interview will consist of questions about the influence of various stakeholders at your school and student mathematics learning. Video-taping will occur from the moment participants enter the room until the moment they leave which means participants will be video-taped prior to the official start of the interview and after the official end of the interview as long as they are in the interview room. The researcher will share all data and results with you prior to publication. In addition, the researcher will take all necessary measures to assure anonymity of the participants in publications of the results. You may withdraw your participation at any time without negative consequences. Risks Participation in this research study may involve some added risks or discomforts. These include the small risk of loss of confidentiality, discomfort with the research process, and possible unforeseen risks that could occur. However, the researcher will take all steps necessary to reduce these risks. Benefits Expected possible direct benefits are increases in knowledge of how to best directly or indirectly promote student mathematics learning at your school. Possible indirect benefits may be reflection on current practice. On a broader scale, this study serves to inform future research on aspects of school leadership through the lens of complexity theory, including the use of the School Leadership in a Complex Adaptive System (SL-CAS) Framework to understand the role school leaders play in students’ mathematics achievement, for possible goals other than students’ mathematics achievement, and the use of other stakeholders as the units of analysis. This study is significant because schools are being held increasingly accountable for students’ mathematics achievement. School leaders and researchers need to understand how to make decisions that will allow for the most effective use of resources, time, and professional development within the complex realities that exist in schools to achieve higher mathematics achievement for all students. The knowledge gained from this study will give direction to researchers and school leaders on the nature of complex adaptive school systems and address pragmatically the understanding of the school leaders’ actions to effectively move a CAS toward the goal of a shared vision which promotes higher student mathematics achievement. Explanation & offer to answer questions Emma Bullock has explained this research study to you and answered your questions. If you have other questions or research-related problems, you may contact Dr.
183 Patricia Moyer-Packenham at (435) 797-2597 or
[email protected] or Emma Bullock at (801) 808-6985 or
[email protected]. Extra Cost(s) Participants may need to travel within the State of Utah to attend the Focus Group. Travel reimbursement will be provided to all participants at $0.54/mile round trip. Total reimbursable miles will be determined between the researcher and participant beforehand in writing via an email using a Google Maps. Compensation All focus group participants will receive a $25 gift card as compensation for their participation. Voluntary nature of participation and right to withdraw without consequence Participation in research is entirely voluntary. You may refuse to participate or withdraw at any time without consequence or loss of benefits. Please contact Emma Bullock at (801) 808-6985 or
[email protected] to be withdrawn from this study. Confidentiality Research records will be kept confidential, consistent with federal and state regulations. Only the investigator will have access to the data which will be kept in a locked file cabinet or on a password protected computer in a locked room. To protect your privacy, personal, identifiable information will be removed from study documents and replaced with a study identifier. Identifying information will be stored separately from data and will be kept. All video-recordings will be stored using USU Box.com files and personally identifiable information will be beeped out from the recordings and removed from all transcripts and replaced with identifiers and/or pseudonyms. All personally identifiable data, including video or audio recordings, will be stored until the completion of the study (March 30th, 2018) and then destroyed. IRB Approval Statement The Institutional Review Board for the protection of human participants at Utah State University has approved this research study. If you have any questions or concerns about your rights or a research-related injury and would like to contact someone other than the research team, you may contact the IRB Administrator at (435) 797-0567 or email
[email protected] to obtain information or to offer input. Copy of consent You have been given two copies of this Informed Consent. Please sign both copies and keep one copy for your files. Investigator Statement “I certify that the research study has been explained to the individual, by me or my research staff, and that the individual understands the nature and purpose, the possible risks and benefits associated with taking part in this research study. Any questions that have been raised have been answered.”
Signature of Researcher(s)
_______________________________________ Dr. Patricia Moyer-Packenham Professor, Mathematics Education Director, Mathematics Education and Leadership Programs School of Teacher Education and Leadership 318 Emma Eccles Jones Early Childhood Education and Research Center Utah State University 2605 Old Main Hill Logan, UT 84322-2605 (435) 797-2597
[email protected]
Date
184 _______________________________ Emma Bullock Student Researcher/Doctoral Candidate (801) 808-6985
[email protected]
______________________________ Date
Signature of Participant By signing below, I verify that I am 18 years of age or older and consent to participate and maintain full confidentiality of other focus-group participants.
_______________________________ Participant’s signature
______________________________ Date
185
Appendix D Revised Principal’s Mathematics Questionnaire
186 Principal’s Mathematics Questionnaire
187
188
189
190
191
192
193
194
195
196
197
198
199
200
Appendix E Survey Recruitment Email
201 Dear Principal/School Leader, You are being invited to take part in a research project examining the school leaders’ role in student mathematics achievement. The data are being gathered by using on-line surveys. The surveys will take no more than 20 minutes for you to complete. To thank you for your time, you will receive a $5 gift card to a vendor of your choice (Subway, Kneaders, McDonalds, or Wendy’s). The survey begins with a consent form informing you more about the study and is followed by a series of questions to gather some demographic data and a brief survey regarding your perception of influences on (a) the content of mathematics curriculum, (b) the implementation of the mathematics curriculum, and (c) the instructional methods used to teach mathematics, your perceptions about teaching and achievement in mathematics, and your perceptions about supports for increasing student achievement of mathematics. Here is the link: https://www.surveymonkey.com/r/SQYRT8H Please take no more than 20 minutes to complete the survey. If you have any questions, please contact Emma Bullock at
[email protected] or 801-808-6985 or Dr. Patricia Moyer-Packenham at
[email protected] or 435-797-2597.
202
Appendix F Focus Group Recruitment Dialogue
203 (adapted from Vaughn, Schumm, & Sinagub, 1996) Hello, _______? This is Emma Bullock from Utah State University. I am currently enrolled as a PhD student in the Mathematics Education and Leadership Program at Utah State University. I would like to take a few minutes of your time to tell you about a research study I am conducting and to solicit your help. First, let me tell you how you were selected. I am very interested in conducting this study and including K-12 public school leaders in the State of Utah. You were identified from your participation in the Principal’s Mathematics Questionnaire as a school leader who might be interested in providing information to a research study on the role school leaders play in promoting student mathematics achievement. The purpose of this study is to determine the complex influences that impact the decisions made my school leaders with respect to the allocation of resources, curriculum, time, mentoring and coaching, feedback, professional development, and the support of instructional methods. We are also interested in how these decisions influence student mathematics achievement. You were carefully selected for participation in this study and I am very hopeful that you will agree to be part of a group of school leaders who will share with us their perceptions on these issues. What is very important is that there are no right or wrong answers, but what I am interested in is what you think and how things are going for you related to this issue. Your contribution is very important because I am going to summarize the responses of more than 20 school leaders and use this information (of course, all identifying information will be kept strictly confidential), along with survey
204 data from hundreds of principals across the State of Utah to assist school leaders in determining the most effective ways to promote student mathematics achievement. Furthermore, the information will be provided to other agencies, such as the State Department of Education, which might find it useful in supporting K-12 school leaders. The contribution that you will make is essential to our better understanding of this important topic, and we feel that you are uniquely suited to assist us. In addition, you will be compensated for your time and travel if you choose to participate. All your mileage for travel expenses will be reimbursed (at $0.54/mile), you will receive a $25 VISA gift card, and a one night hotel will be provided if you live more than 50 miles away from the interview site. You may have some questions, and I will do my best to answer them.
205
Appendix G Focus Group Confidentiality Agreement
206
Department of Teacher Education and Leadership (TEAL) 2805 Old Main Hill Logan UT 84322-2805 Telephone: (435) 797-0389
CONFIDENTIALITY AGREEMENT AN EXPLANATORY SEQUENTIAL MIXED METHODS STUDY OF THE SCHOOL LEADERS’ ROLE IN INFLUENCING MATHEMATICS LEARNING IN THE CONTEXT OF COMPLEXITY THEORY I understand that any information concerning the identities and information shared by people participating in project-related focus groups is to be kept confidential at all times. The only exceptions to the above confidentiality policy are as follows: 1. When researchers with Utah State University are bound by the law to report suspected child abuse, elder abuse, and/or the abuse of a person with a disability and/or homicide or homicidal or suicidal threats. 2. Researchers with Utah State University will comply with court orders and properly issued subpoenas. 3. When researchers with Utah State University are bound by state law requirements to report abusive, illegal, or sexually exploitive acts. 4. Researchers with Utah State University may discuss confidential information about focus group and individual interviews with other project staff who have signed confidentiality agreements. I have read, understood, and agree to comply with the confidentiality policy described above. ____________________________________ Print Name ____________________________________ Signature Date: _______________________________
207
Appendix H Focus Group Interview Protocol
208 adapted from (Vaughn, Schumm, & Sinagub, 1996) 1. Introduction a. Welcome b. Statement of the purpose of the interview c. Guidelines to follow during the interview 2. Warm-Up a. Set the tone b. Set participants at ease 3. Clarification of Terms a. Establish the knowledge base of key terms through questions b. Provide definition of key terms i. Influence ii. Student Mathematics Achievement iii. Resource Allocation iv. Curriculum v. Time vi. Mentoring and Coaching vii. Feedback viii. Professional Development ix. Support for Instructional Strategies 4. Establish Ease and Nonthreatening Questions a. Tell me about the influence of various stakeholders at your school. b. What type of organizational structures/groups exist for teachers, students, parents, community members, etc. at your school? i. What do you perceive contributed to the organization of these groups? ii. What has changed over time about these groups at your school? iii. How have these groups helped contribute to decisions with respect to the allocation of resources (i.e., choices about curriculum, time allocation, feedback, teacher professional development, instructional methods, etc.)? iv. How do you feel the decisions made by these stakeholder groups influence your decisions and actions at your school? c. Tell me about the mathematics supports for teachers. i. What has contributed to the development of these supports in your school? d. Tell me about the mathematics supports for students. i. What has contributed to the development of these supports in your school? 5. Establish More Difficult Questions a. Do you feel there is a shared vision with respect to student mathematics learning within your school? i. Are there particular events, or decisions, that have occurred as a result of this shared vision?
209 ii. Do you perceive this shared vision, or the lack of it as influencing students’ mathematics learning at their school? b. What do you feel has helped to promote student mathematics learning the most at your school? i. What stakeholder groups do you feel have contributed to these decisions? c. What so you feel has hindered student mathematics learning the most at your school? i. What stakeholder groups do you feel have contributed to these decisions? d. What you feel is your role in promoting student mathematics learning? i. Who influences you in your role as a school leader? Whom do you feel you influence? 6. Wrap-Up a. Identify and organize the major themes from the participant’s responses. b. Ensure that any conversational points not completed are mentioned. 7. Member Check a. Determine how each member perceives selected issues 8. Closing Statements a. Request anonymity of information b. Answer any remaining questions c. Express thanks.
210
Appendix I Cronbach Alphas for Revised Principal’s Mathematics Questionnaire
211 Table I-1 Cronbach’s Alpha for Influence on Mathematics Curriculum and Instruction Portion
Question
Cronbach’s Alpha
Cronbach’s Alpha if item deleted
-Please rate the amount of influence each of the following have over the content of the mathematics curriculum at your school.
0.695
0.772
-Please rate the amount of influence each of the following have over the implementation of the mathematics curriculum at your school.
0.687
0.715
-Please rate the amount of influence each of the following have over the instructional methods used in the mathematics classrooms in your school.
0.790
0.822
Table I-2 Corrected Item-Total Correlation and the Effect of Deletion on Cronbach’s Alpha for Influence on Content Sub-Item
Corrected item-total correlation
Cronbach’s alpha if item deleted
You, the principal
.505
.646
Teachers
.189
.696
Parents
.472
.655
Students
.393
.665
School District*
-.072
.772
School Board
.360
.671
USOE
.426
.662
State Legislature
.409
.664
Federal Legislature
.572
.629
National Organizations (i.e., NCTM, etc.)
.523
.639
* indicates greatest effect on alpha towards .7 threshold
212 Table I-3 Corrected Item-Total Correlation and the Effect of Deletion on Cronbach’s Alpha for Influence on Implementation Sub-item
Corrected item-total correlation
Cronbach’s alpha if item deleted
You, the principal
.378
.664
Teachers
-.085
.705
Parents
.244
.681
Students
.128
.699
School District*
.218
.715
School Board
.505
.630
USOE
.336
.667
State Legislature
.363
.661
Federal Legislature
.715
.612
National Organizations (i.e., NCTM, etc.)
.766
.573
* indicates greatest effect on alpha towards .7 threshold
Table I-4 Corrected Item-Total Correlation and the Effect of Deletion on Cronbach’s Alpha for Influence on Instructional Methods Sub-item
Corrected item-total correlation
Cronbach’s alpha if item deleted
You, the principal
.485
.771
Teachers
-.432
.827
Parents
.641
.755
Students
.496
.770
School District*
.146
.822
School Board
.568
.758
USOE
.421
.777
State Legislature
.845
.733
Federal Legislature
.820
.733
National Organizations (i.e., NCTM, etc.)
.644
.746
* indicates greatest effect on alpha towards .7 threshold
213 Table I-5 Cronbach’s Alpha for Mathematics Curriculum Portion Question Please rate your familiarity with the following mathematics curriculum documents and reports. Please rate the extent the following documents, university courses, or professional development have influences your understanding of mathematics curriculum and instruction.
Cronbach’s alpha
Cronbach’s alpha if item deleted
0.926
0.927
Table I-6 Cronbach’s Alpha for Grades K-4 for Mathematics Teaching and Learning Portion Cronbach’s alpha
Cronbach’s alpha if item deleted
To what extent to you agree with the following statements as they relate to mathematics teaching and learning (K-4): [V282-V293]
0.769
0.814
To what extent to you agree with the following statements as they relate to mathematics teaching and learning (K-4): [V318-V338]
0.991
0.991
To what extent to you agree with the following statements as they relate to mathematics teaching and learning (K-4): [V381-V391]
0.955
0.956
To what extent to you agree with the following statements as they relate to mathematics teaching and learning (K-4): [V414-V423]
0.723
0.807
Question
Table I-7 Cronbach’s Alpha for Grades 5-9 for Mathematics Teaching and Learning Portion Cronbach’s alpha
Cronbach’s alpha if item deleted
To what extent to you agree with the following statements as they relate to mathematics teaching and learning (K-5): [V294-V305]
0.951
0.952
To what extent to you agree with the following statements as they relate to mathematics teaching and learning (K-5): [V339-V359]
0.989
0.990
To what extent to you agree with the following statements as they relate to mathematics teaching and learning (K-5): [V393-V402]
0.643
0.750
To what extent to you agree with the following statements as they relate to mathematics teaching and learning (K-5): [V424-V433]
0.875
0.896
Question
214 Table I-8 Cronbach’s Alpha for Grades 10-12 for Mathematics Teaching and Learning Portion Cronbach’s alpha
Cronbach’s alpha if item deleted
-To what extent to you agree with the following statements as they relate to mathematics teaching and learning (K-5): [V306-V317]
0.988
0.990
-To what extent to you agree with the following statements as they relate to mathematics teaching and learning (K-5): [V360-V380]
0.993
0.994
-To what extent to you agree with the following statements as they relate to mathematics teaching and learning (K-5): [V403-V413]
0.982
0.984
-To what extent to you agree with the following statements as they relate to mathematics teaching and learning (K-5): [V434-V443]
0.984
0.986
Question
215 Table I-9 Cronbach’s Alpha Across Grade Spans with Accompanying Means and Standard Deviations
Question
Cronbach’s alpha
Cronbach’s alpha if item deleted (most different grade span)
K-4 Mean SD
5-9 Mean SD
10-12 Mean SD
There should be a streamlined and a welldefined set of important topics that are taught in early grades.
-0.040
0.532 (K-4)
5.11 2.028
5.40 1.897
3.30 2.869
The mathematics curriculum should be conceptually oriented.
-0.073
0.517 (K-4)
4.75 2.053
4.80 1.814
2.80 2.974
Topics in mathematics curriculum should be revisited year after year without bringing closure to them.*
0.701
0.710 (K-4)
4.89 1.364
4.50 1.900
3.00 2.667
The practice of teaching by telling should be used as the primary instructional practice in the mathematics classroom.*
0.700
0.787 (5-9)
2.44 0.882
2.10 1.101
1.60 1.578
Proficiency with whole numbers, fractions, and certain aspects of geometry and measurement are the foundations for algebra.
0.226
0.452 (K-4)
5.11 1.965
4.80 1.874
3.20 2.821
The mathematics curriculum should include a broad range of content.
0.436
0.823 (K-4)
2.89 2.008
3.40 1.838
2.70 2.497
Conceptual understanding, computational and procedural fluency, and problem solving skills are equally important and mutually reinforce each other.
0.334
0.562 (K-4)
5.78 0.441
4.60 2.459
3.40 2.951
Rote practice (drill) should be an important instructional practice in the mathematics classroom.
0.499
0.688 (K-4)
4.56 1.014
3.60 1.713
2.10 1.969
Students should develop immediate recall of arithmetic facts.
0.591
0.739 (10-12)
4.78 1.394
4.00 2.000
2.30 2.263
Mathematics curriculum should emphasize the development of children’s mathematical thinking and reasoning abilities.
0.363
0.435 (K-4)
5.89 0.333
5.20 1.874
3.50 3.028
Children’s belief in their mathematics ability effects their persistence in mathematics learning.
0.488
0.593 (K-4)
5.89 0.333
4.70 2.497
3.50 3.028
Problemsolving approaches to instruction should be used as the primary instructional practice in the mathematics classroom.
0.230
0.539 (K-4)
4.44 1.944
4.30 1.703
3.40 2.951
Teachers’ mathematical content knowledge is important for students’ achievement.
0.567
0.674 (10-12)
4.44 2.555
4.71 2.215
2.57 3.207
(table continues)
216
Question
Cronbach’s alpha
Cronbach’s alpha if item deleted (most different grade span)
K-4 Mean SD
5-9 Mean SD
10-12 Mean SD
Teachers’ mathematical pedagogical content knowledge is important for student achievement.
0.464
0.564 (10-12)
4.56 2.603
5.14 2.268
2.57 3.207
School leaders/principal’s mathematical content knowledge is important for students’ achievement.
0.526
0.694 (10-12)
3.89 2.369
4.00 2.00
2.00 2.646
School leaders/principal’s mathematical pedagogical content knowledge is important for student achievement.
0.520
0.575 (10-12)
4.11 2.472
4.33 2.251
2.00 2.646
Parents’ mathematical knowledge is important for students’ achievement.*
0.747
0.768 (10-12)
3.00 2.000
3.43 1.813
1.71 2.360
Individuals who work at the district office’s mathematical content knowledge is important for students’ achievement.*
0.721
0.766 (10-12)
3.56 2.351
4.00 2.082
2.29 2.870
Individuals on school boards’ mathematical content knowledge is important for students’ achievement.*
0.834
0.882 (10-12)
2.78 2.048
2.86 1.676
1.57 2.149
Individuals who work at the State Office of Education’ mathematical knowledge is important for student’s achievement.*
0.760
0.807 (10-12)
3.33 2.345
3.29 2.059
1.71 2.430
Legislator’s mathematical knowledge is important for student’s achievement. *
0.750
0.786 (10-12)
3.11 2.147
2.57 1.718
2.57 2.149
Mathematics curriculum should actively involve children in doing mathematics.
0.435
0.509 (10-12)
4.56 2.603
4.86 2.193
2.43 3.047
Teacher’s use of regular ongoing assessments can improve student learning in mathematics.
0.495
0.564 (10-12)
4.56 2.603
5.00 2.236
2.57 3.207
Written practice should be an important instructional practice in the mathematics classroom.
0.483
0.577 (10-12)
4.22 2.489
4.71 2.138
2.43 3.047
Some children are not ready or are too young to learn certain mathematics content.*
0.714
0.802 (K-4)
2.67 1.936
2.17 1.941
1.29 2.215
Mathematics curriculum should emphasize the application of mathematics.
0.612
0.579 (K-4)
4.22 2.489
4.29 2.360
2.43 3.047
Explicit instruction for students who struggle with math is effective in increasing student performance with word problems and computation.
0.371
0.577 (10-12)
4.33 2.500
4.71 2.138
2.43 3.047
Worksheets should be an important instructional practice in the mathematics curriculum.
0.534
0.680 (10-12)
2.78 1.641
3.00 1.414
1.57 1.988
Publishers should produce shorter and more focused mathematics textbooks.*
0.716
0.714 (10-12)
3.89 2.421
3.86 1.952
2.29 2.928
(table continues)
217
Question
Cronbach’s alpha
Cronbach’s alpha if item deleted (most different grade span)
K-4 Mean SD
5-9 Mean SD
10-12 Mean SD
Mathematics curriculum should include an increased use of calculators.
0.460
0.554 (10-12)
2.67 1.871
3.29 1.704
2.00 2.646
Mathematics curriculum should include an increased use of touchscreen apps and computer apps/websites.*
0.738
0.725 (10-12)
3.67 2.345
4.00 2.236
2.29 2.870
Knowledge of fractions (proportional reasoning) is the most important foundational skill developed among students.*
0.825
0.856 (10-12)
2.78 2.167
3.29 2.289
1.71 2.628
Children should not be taught that there is only one answer or one method to solve mathematics problems.
0.421
0.510 (10-12)
3.67 2.693
4.14 2.545
1.17 2.401
Mathematics preparation of teachers must be strengthened to improve teacher effectiveness.
0.600
0.600 (5-9)
5.00 2.236
6.00 0.000
3.00 3.286
Manipulative materials should be used as the primary instructional practice in the mathematics classroom.
-0.162
0.320 (10-12)
4.29 2.215
3.50 1.049
2.00 2.449
Proficiency with whole numbers is a critical foundation for algebra.
0.309
0.575 (5-9)
4.86 2.193
5.33 0.816
2.33 2.733
Mathematics curriculum should make appropriate and ongoing use of computers.*
0.803
0.819 (K-4)
4.29 2.138
4.50 1.378
2.67 2.994
Certain aspects of geometry and measurement are critical foundations of algebra.
0.565
0.633 (K-4)
3.86 2.193
4.50 1.517
2.17 2.714
Rote memorization of rule should be the primary instructional practice in the mathematics classroom.
0.451
0.737 (5-9)
2.86 1.952
2.67 0.816
1.17 1.329
Our current curriculum provides sufficient practice to ensure fast and efficient solving of mathematics facts.*
0.792
0.811 (K-4)
3.14 1.864
4.00 1.265
2.00 2.530
Discussion of mathematics (mathematical discourse) should be used at least 50% of the time in the mathematics classroom.
-0.245
0.480 (10-12)
3.29 1.604
4.17 0.983
2.00 2.121
Students learn mathematics by building on prior knowledge.
0.288
0.469 (5-9)
4.00 2.769
5.83 0.408
2.83 3.125
Mathematics instruction should be student centered more than 50% of the time.
-0.500
1.000 (10-12)
3.86 2.734
5.40 0.894
2.50 2.811
Cooperative work should be the primary practice in the mathematics classroom.
0.487
0.642 (5-9)
3.00 1.826
3.83 1.169
2.17 2.714
Mathematics instruction should be teacher directed more than 50% of the time.*
0.773
1.000 (10-12)
4.00 1.581
4.25 1.708
2.75 2.500
(table continues)
218
Question
Cronbach’s alpha
Cronbach’s alpha if item deleted (most different grade span)
K-4 Mean SD
5-9 Mean SD
10-12 Mean SD
Questioning should be an important instructional practice in the mathematics classroom.
-0.330
0.930 (10-12)
5.40 0.894
5.25 0.957
4.00 2.708
Computerbased drill and practice and tutorials can improve student performance in specific areas of mathematics.
-0.294
-.0294 (K-4)
4.60 0.894
4.75 0.500
3.75 2.500
Justification of thinking should be a primary instructional practice in the mathematics classroom.
0.028
0.500 (10-12)
4.80 0.447
5.25 0.500
4.25 2.872
Proficiency with fractions (proportional reasoning) is a critical foundation of algebra.*
0.708
0.978 (10-12)
4.20 1.483
4.50 1.732
3.50 3.000
The use of calculators impedes the development of automaticity with basic facts.*
0.765
0.963 (K-4)
4.40 2.074
3.50 1.732
2.50 2.517
Writing about mathematics should be the primary instructional practice in the mathematics classroom.*
0.877
0.925 (K-4))
4.60 0.894
3.25 1.500
2.75 2.217
U.S. mathematics textbooks are extremely long.*
0.774
0.983 (10-12)
4.80 1.643
5.00 2.000
3.50 3.000
Content integration should take place at least 50% of the time in the mathematics classroom.*
0.825
0.978 (10-12)
4.60 1.517
4.25 1.708
3.25 2.754
U.S. mathematics textbooks contain many errors and a large number of ambiguous and confusing statements and problems.*
1.000
1.000 (no difference)
3.60 2.510
3.25 2.754
3.25 2.754
* Indicates the same across grade spans.
Table I-10 Cronbach’s Alpha for Supports of Increasing Student Achievement Portion
Question The best way to increase student achievement in mathematics is to....[V446-V471]
Cronbach’s alpha
Cronbach’s alpha if item deleted
0.912
0.929
219 Table I-11 Corrected-Item Total Correlation, Cronbach’s Alpha if Deleted with Accompanying Means and Standard Deviations for Increasing Student Achievement Portion Corrected item-total correlation
Cronbach’s alpha if deleted
Mean
SD
Provide teachers with workshop/conference types of professional development.*
-0.368
0.918
4.80
.837
Provide teachers with long-term professional development differentiated according to needs.
0.773
0.909
5.80
.447
Allow teachers to choose their own professional development opportunities.
-0.125
0.917
4.20
1.095
Send all teachers to the same professional development.
0.142
0.917
3.40
1.817
Pay for teachers to take more university mathematics courses. *
0.557
0.908
4.80
1.304
Pay for teachers to obtain a Utah mathematics endorsement.
0.215
0.915
4.40
1.817
Have teachers attend webinar mathematics professional development.*
0.697
0.906
4.20
1.095
Have teachers attend online mathematics professional development/university courses.*
0.697
0.906
4.20
1.095
Work with university researchers in a collaborative professional development.
0.811
0.904
4.20
1.304
Have teachers engage in Japanese lesson study.*
-0.409
0.918
2.20
.837
Improve professional learning communities (PLCs).
0.778
0.906
5.40
.894
Vertical teacher teaming/planning of mathematics curriculum and instructional strategies.
0.778
0.906
5.40
.894
Use a district/charter mathematics specialist/coach/mentor to work individually, or in groups, with teachers, as needed.
0.844
0.902
4.20
1.643
Have teachers attend national professional organizations’ conferences such as the annual or regional NCTM.
0.725
0.904
3.00
1.581
Have teachers attend state professional organizations’ conferences such as the annual UCTM (Utah Council of Teachers of Mathematics) or UAPCS (Utah Association of Public Charter Schools) conferences.
0.683
0.905
3.20
1.643
Conduct regular, comprehensive teacher evaluations.
0.791
0.903
4.00
1.581
Sub-item
(table continues)
220 Corrected item-total correlation
Cronbach’s alpha if deleted
Mean
SD
Provide mathematics family nights for parents and students.
0.866
0.902
4.40
1.517
Provide peer tutoring for students.
0.866
0.902
4.40
1.517
Provide teacher/aide tutoring for students.
0.762
0.904
4.60
1.673
Provide appropriate Tier II and Tier III instruction for students.
0.471
0.910
5.20
.837
Provide individualized education plans for all students that need it.
0.731
0.904
3.80
1.789
Use some form of heterogeneous, ability, achievement, multigrade, accelerated or differentiated grouping for primary mathematics instruction.
0.262
0.914
4.20
1.789
Use homogenous (wholegroup) instruction for primary mathematics instruction.
-0.691
0.929
3.60
1.517
Provide webbased/computerbased/appbased tutoring for students.
0.601
0.910
4.40
.548
Educate parents on the curriculum and researchbased instructional strategies.
0.854
0.904
4.60
1.140
Educate board members on the curriculum and researchbased instructional strategies.
0.681
0.905
3.60
1.817
Educate members of the legislature on the curriculum and researchbased instructional strategies.
0.731
0.904
3.80
1.789
Provide specialized, intensive instruction for subpopulations of students such as SPED, ELL, low SES, migrant, homeless, etc.
0.726
0.904
4.00
1.871
Use common assessments and analyze student data on a regular basis.
Zero variance removed from scale
N/A
6.00
0.000
Sub-item
* In desired range.
221 Table I-12 Cronbach’s Alpha for Revised 14 Items Across Grades Question for Mathematics Teaching and Learning Portion Question To what extent do you agree with the following statements as they relate to mathematics teaching and learning (across all grade spans):
Cronbach’s alpha
Cronbach’s alpha if item deleted
0.814
0.843
Table I-13 Cronbach’s Alpha for Revised 25 Items K-9 Question for Mathematics Teaching and Learning Portion Question To what extent do you agree with the following statements as they relate to mathematics teaching and learning (K-9):
Cronbach’s alpha
Cronbach’s alpha if item deleted
0.832
0.844
Table I-14 Cronbach’s Alpha for Revised 31 Items 10-12 Question for Mathematics Teaching and Learning Portion Question To what extent do you agree with the following statements as they relate to mathematics teaching and learning (10-12):
Cronbach’s alpha
Cronbach’s alpha if item deleted
0.996
0.996
Table I-15 Cronbach’s Alpha for Revised 21 Items Supports of Increasing Student Achievement Portion Question The best way to increase student achievement in mathematics is to....
Cronbach’s alpha
Cronbach’s alpha if item deleted
0.941
0.950
222
Appendix J Normality Tests for 30 Most Important Variables
223 Table J-1 ISAM18: Tests of Normality Shapiro-Wilk ───────────── Variable ISAM18
Skewness
Std. Error
Kurtosis
Std. Error
1
Statistic .87
df 11
Sig. .078
s -1.21
SE .66
k 1.14
SE 1.28
2
.98
25
.946
.04
.46
-.13
.90
3
.98
43
.558
.10
.36
-.75
.71
4
.98
51
.387
-.49
.33
.23
.66
5
.89
13
.093
.68
.62
-.68
1.19
Figure J-1. Frequency by 2015 SAGE % Mathematics Proficiency for ISAM18 = 1. This figure illustrates the number of school leaders who rated ISAM18 at 1 based on their school’s school-wide 2015 SAGE % mathematics proficiency.
224
Figure J-2. Frequency by 2015 SAGE % Mathematics Proficiency for ISAM18 = 2. This figure illustrates the number of school leaders who rated ISAM18 at 2 based on their school’s school-wide 2015 SAGE % mathematics proficiency.
Figure J-3. Frequency by 2015 SAGE % Mathematics Proficiency for ISAM18 = 3. This figure illustrates the number of school leaders who rated ISAM18 at 3 based on their school’s school-wide 2015 SAGE % mathematics proficiency.
225
Figure J-4. Frequency by 2015 SAGE % Mathematics Proficiency for ISAM18 = 4. This figure illustrates the number of school leaders who rated ISAM18 at 4 based on their school’s school-wide 2015 SAGE % mathematics proficiency.
Figure J-5. Frequency by 2015 SAGE % Mathematics Proficiency for ISAM18 = 5. This figure illustrates the number of school leaders who rated ISAM18 at 5 based on their school’s school-wide 2015 SAGE % mathematics proficiency.
226
Figure J-6. Normal Q-Q Plot of 2015 SAGE % Mathematics Proficiency for ISAM18 = 1. This figure illustrates the observed value versus the expected normal for school leaders who rated ISAM18 at 1 based on their school’s school-wide 2015 SAGE % mathematics proficiency.
Figure J-7. Normal Q-Q Plot of 2015 SAGE % Mathematics Proficiency for ISAM18 = 2. This figure illustrates the observed value versus the expected normal for school leaders who rated ISAM18 at 2 based on their school’s school-wide 2015 SAGE % mathematics proficiency.
227
Figure J-8. Normal Q-Q Plot of 2015 SAGE % Mathematics Proficiency for ISAM18 = 3. This figure illustrates the observed value versus the expected normal for school leaders who rated ISAM18 at 3 based on their school’s school-wide 2015 SAGE % mathematics proficiency.
Figure J-9. Normal Q-Q Plot of 2015 SAGE % Mathematics Proficiency for ISAM18 = 4. This figure illustrates the observed value versus the expected normal for school leaders who rated ISAM18 at 4 based on their school’s school-wide 2015 SAGE % mathematics proficiency.
228
Figure J-10. Normal Q-Q Plot of 2015 SAGE % Mathematics Proficiency for ISAM18 = 5. This figure illustrates the observed value versus the expected normal for school leaders who rated ISAM18 at 5 based on their school’s school-wide 2015 SAGE % mathematics proficiency.
Figure J-11. Boxplot of 2015 SAGE % Mathematics Proficiency for ISAM18. This figure illustrates spread of school-wide 2015 SAGE % Mathematics Proficiency scores based on school leaders’ ranking of ISAM18.
229 Table J-2 ISAM12: Tests of Normality Shapiro-Wilk ──────────── Variable ISAM12
Statistic
df
Sig.
Skewness
Std. Error
Kurtosis
Std. Error
2
.97
12
.888
-.56
.64
.84
1.23
3
.96
29
.278
-.58
.43
.03
.85
4
.98
83
.366
-.36
.26
-.15
.52
5
.90
17
.065
1.11
.55
1.87
1.06
1
Figure J-12. Frequency by 2015 SAGE % Mathematics Proficiency for ISAM12 = 1. This figure illustrates the number of school leaders who rated ISAM12 at 1 based on their school’s school-wide 2015 SAGE % mathematics proficiency.
230
Figure J-13. Frequency by 2015 SAGE % Mathematics Proficiency for ISAM12 = 2. This figure illustrates the number of school leaders who rated ISAM12 at 2 based on their school’s school-wide 2015 SAGE % mathematics proficiency.
Figure J-14. Frequency by 2015 SAGE % Mathematics Proficiency for ISAM12 = 3. This figure illustrates the number of school leaders who rated ISAM12 at 3 based on their school’s school-wide 2015 SAGE % mathematics proficiency.
231
Figure J-15. Frequency by 2015 SAGE % Mathematics Proficiency for ISAM12 = 4. This figure illustrates the number of school leaders who rated ISAM12 at 4 based on their school’s school-wide 2015 SAGE % mathematics proficiency.
Figure J-16. Frequency by 2015 SAGE % Mathematics Proficiency for ISAM12 = 5. This figure illustrates the number of school leaders who rated ISAM12 at 5 based on their school’s school-wide 2015 SAGE % mathematics proficiency.
232
Figure J-17. Normal Q-Q Plot of 2015 SAGE % Mathematics Proficiency for ISAM12 = 1. This figure illustrates the observed value versus the expected normal for school leaders who rated ISAM12 at 1 based on their school’s school-wide 2015 SAGE % mathematics proficiency.
Figure J-18. Normal Q-Q Plot of 2015 SAGE % Mathematics Proficiency for ISAM12 = 2. This figure illustrates the observed value versus the expected normal for school leaders who rated ISAM12 at 2 based on their school’s school-wide 2015 SAGE % mathematics proficiency.
233
Figure J-19. Normal Q-Q Plot of 2015 SAGE % Mathematics Proficiency for ISAM12 = 3. This figure illustrates the observed value versus the expected normal for school leaders who rated ISAM12 at 3 based on their school’s school-wide 2015 SAGE % mathematics proficiency.
Figure J-20. Normal Q-Q Plot of 2015 SAGE % Mathematics Proficiency for ISAM12 = 4. This figure illustrates the observed value versus the expected normal for school leaders who rated ISAM12 at 4 based on their school’s school-wide 2015 SAGE % mathematics proficiency.
234
Figure J-21. Normal Q-Q Plot of 2015 SAGE % Mathematics Proficiency for ISAM12 = 5. This figure illustrates the observed value versus the expected normal for school leaders who rated ISAM12 at 5 based on their school’s school-wide 2015 SAGE % mathematics proficiency.
Figure J-22. Boxplot of 2015 SAGE % Mathematics Proficiency for ISAM12. This figure illustrates spread of school-wide 2015 SAGE % Mathematics Proficiency scores based on school leaders’ ranking of ISAM12.
235 Table J-3 Yrs_Last_Teach_Pos: Tests of Normality Shapiro-Wilk ────────────── Variable Yrs_Last_Teach_ Pos
Statistic
df
Sig.
Skewness
Std. Error
Kurtosis
Std. Error
.97
3
.683
-.83
1.23
2
.93
8
.537
-.76
.75
1.46
1.48
3
.93
11
.435
.95
.66
.88
1.28
4
.95
16
.480
-.61
.56
-.44
1.09
5
.92
15
.217
-.31
.58
-1.27
1.12
6
.91
18
.098
-1.13
.54
1.14
1.04
7
.94
11
.480
.37
.66
-.96
1.28
8
.84
12
.030
1.14
.64
.42
1.23
9
.97
10
.891
.22
.69
-.46
1.33
10
.97
12
.915
.03
.64
1.31
1.23
12
.92
4
.557
.22
1.01
-3.74
2.62
13
1.00
3
.900
-.27
1.23
14
.95
7
.726
15
1.00
3
.884
.42
.79
-.66
1.59
.31
1.23
0 1
11
16 17 18 19 20 21 22 23 24
236
Figure J-23. Frequency by 2015 SAGE % Mathematics Proficiency for Yrs_Last_Teach_Pos = 0. This figure illustrates the number of school leaders who spent 0 years in their last teaching position based on their school’s school-wide 2015 SAGE % mathematics proficiency.
Figure J-24. Frequency by 2015 SAGE % Mathematics Proficiency for Yrs_Last_Teach_Pos = 2. This figure illustrates the number of school leaders who spent 2 years in their last teaching position based on their school’s school-wide 2015 SAGE % mathematics proficiency.
237
Figure J-25. Frequency by 2015 SAGE % Mathematics Proficiency for Yrs_Last_Teach_Pos = 3. This figure illustrates the number of school leaders who spent 3 years in their last teaching position based on their school’s school-wide 2015 SAGE % mathematics proficiency.
Figure J-26. Frequency by 2015 SAGE % Mathematics Proficiency for Yrs_Last_Teach_Pos = 4. This figure illustrates the number of school leaders who spent 4 years in their last teaching position based on their school’s school-wide 2015 SAGE % mathematics proficiency.
238
Figure J-27. Frequency by 2015 SAGE % Mathematics Proficiency for Yrs_Last_Teach_Pos = 5. This figure illustrates the number of school leaders who spent 5 years in their last teaching position based on their school’s school-wide 2015 SAGE % mathematics proficiency.
Figure J-28. Frequency by 2015 SAGE % Mathematics Proficiency for Yrs_Last_Teach_Pos = 6. This figure illustrates the number of school leaders who spent 6 years in their last teaching position based on their school’s school-wide 2015 SAGE % mathematics proficiency.
239
Figure J-29. Frequency by 2015 SAGE % Mathematics Proficiency for Yrs_Last_Teach_Pos = 7. This figure illustrates the number of school leaders who spent 7 years in their last teaching position based on their school’s school-wide 2015 SAGE % mathematics proficiency.
Figure J-30. Frequency by 2015 SAGE % Mathematics Proficiency for Yrs_Last_Teach_Pos = 8. This figure illustrates the number of school leaders who spent 8 years in their last teaching position based on their school’s school-wide 2015 SAGE % mathematics proficiency.
240
Figure J-31. Frequency by 2015 SAGE % Mathematics Proficiency for Yrs_Last_Teach_Pos = 9. This figure illustrates the number of school leaders who spent 9 years in their last teaching position based on their school’s school-wide 2015 SAGE % mathematics proficiency.
Figure J-32. Frequency by 2015 SAGE % Mathematics Proficiency for Yrs_Last_Teach_Pos = 10. This figure illustrates the number of school leaders who spent 10 years in their last teaching position based on their school’s school-wide 2015 SAGE % mathematics proficiency.
241
Figure J-33. Frequency by 2015 SAGE % Mathematics Proficiency for Yrs_Last_Teach_Pos = 11. This figure illustrates the number of school leaders who spent 11 years in their last teaching position based on their school’s school-wide 2015 SAGE % mathematics proficiency.
Figure J-34. Frequency by 2015 SAGE % Mathematics Proficiency for Yrs_Last_Teach_Pos = 12. This figure illustrates the number of school leaders who spent 12 years in their last teaching position based on their school’s school-wide 2015 SAGE % mathematics proficiency.
242
Figure J-35. Frequency by 2015 SAGE % Mathematics Proficiency for Yrs_Last_Teach_Pos = 13. This figure illustrates the number of school leaders who spent 13 years in their last teaching position based on their school’s school-wide 2015 SAGE % mathematics proficiency.
Figure J-36. Frequency by 2015 SAGE % Mathematics Proficiency for Yrs_Last_Teach_Pos = 15. This figure illustrates the number of school leaders who spent 15 years in their last teaching position based on their school’s school-wide 2015 SAGE % mathematics proficiency.
243
Figure J-37. Frequency by 2015 SAGE % Mathematics Proficiency for Yrs_Last_Teach_Pos = 17. This figure illustrates the number of school leaders who spent 17 years in their last teaching position based on their school’s school-wide 2015 SAGE % mathematics proficiency.
Figure J-38. Frequency by 2015 SAGE % Mathematics Proficiency for Yrs_Last_Teach_Pos = 18. This figure illustrates the number of school leaders who spent 18 years in their last teaching position based on their school’s school-wide 2015 SAGE % mathematics proficiency.
244
Figure J-39. Frequency by 2015 SAGE % Mathematics Proficiency for Yrs_Last_Teach_Pos = 19. This figure illustrates the number of school leaders who spent 19 years in their last teaching position based on their school’s school-wide 2015 SAGE % mathematics proficiency.
Figure J-40. Frequency by 2015 SAGE % Mathematics Proficiency for Yrs_Last_Teach_Pos = 20. This figure illustrates the number of school leaders who spent 20 years in their last teaching position based on their school’s school-wide 2015 SAGE % mathematics proficiency.
245
Figure J-41. Frequency by 2015 SAGE % Mathematics Proficiency for Yrs_Last_Teach_Pos = 21. This figure illustrates the number of school leaders who spent 21 years in their last teaching position based on their school’s school-wide 2015 SAGE % mathematics proficiency.
Figure J-42. Frequency by 2015 SAGE % Mathematics Proficiency for Yrs_Last_Teach_Pos = 22. This figure illustrates the number of school leaders who spent 22 years in their last teaching position based on their school’s school-wide 2015 SAGE % mathematics proficiency.
246
Figure J-43. Frequency by 2015 SAGE % Mathematics Proficiency for Yrs_Last_Teach_Pos = 24. This figure illustrates the number of school leaders who spent 24 years in their last teaching position based on their school’s school-wide 2015 SAGE % mathematics proficiency.
Figure J-44. Normal Q-Q Plot of 2015 SAGE % Mathematics Proficiency for Yrs_Last_Teach_Pos = 0. This figure illustrates the observed value versus the expected normal for school leaders who spent 0 years in their last teaching position based on their school’s school-wide 2015 SAGE % mathematics proficiency.
247
Figure J-45. Normal Q-Q Plot of 2015 SAGE % Mathematics Proficiency for Yrs_Last_Teach_Pos = 2. This figure illustrates the observed value versus the expected normal for school leaders who spent 2 years in their last teaching position based on their school’s school-wide 2015 SAGE % mathematics proficiency.
Figure J-46. Normal Q-Q Plot of 2015 SAGE % Mathematics Proficiency for Yrs_Last_Teach_Pos = 3. This figure illustrates the observed value versus the expected normal for school leaders who spent 3 years in their last teaching position based on their school’s school-wide 2015 SAGE % mathematics proficiency.
248
Figure J-47. Normal Q-Q Plot of 2015 SAGE % Mathematics Proficiency for Yrs_Last_Teach_Pos = 4. This figure illustrates the observed value versus the expected normal for school leaders who spent 4 years in their last teaching position based on their school’s school-wide 2015 SAGE % mathematics proficiency.
Figure J-48. Normal Q-Q Plot of 2015 SAGE % Mathematics Proficiency for Yrs_Last_Teach_Pos = 5. This figure illustrates the observed value versus the expected normal for school leaders who spent 5 years in their last teaching position based on their school’s school-wide 2015 SAGE % mathematics proficiency.
249
Figure J-49. Normal Q-Q Plot of 2015 SAGE % Mathematics Proficiency for Yrs_Last_Teach_Pos = 6. This figure illustrates the observed value versus the expected normal for school leaders who spent 6 years in their last teaching position based on their school’s school-wide 2015 SAGE % mathematics proficiency.
Figure J-50. Normal Q-Q Plot of 2015 SAGE % Mathematics Proficiency for Yrs_Last_Teach_Pos = 7. This figure illustrates the observed value versus the expected normal for school leaders who spent 7 years in their last teaching position based on their school’s school-wide 2015 SAGE % mathematics proficiency.
250
Figure J-51. Normal Q-Q Plot of 2015 SAGE % Mathematics Proficiency for Yrs_Last_Teach_Pos = 8. This figure illustrates the observed value versus the expected normal for school leaders who spent 8 years in their last teaching position based on their school’s school-wide 2015 SAGE % mathematics proficiency.
Figure J-52. Normal Q-Q Plot of 2015 SAGE % Mathematics Proficiency for Yrs_Last_Teach_Pos = 9. This figure illustrates the observed value versus the expected normal for school leaders who spent 9 years in their last teaching position based on their school’s school-wide 2015 SAGE % mathematics proficiency.
251
Figure J-53. Normal Q-Q Plot of 2015 SAGE % Mathematics Proficiency for Yrs_Last_Teach_Pos = 10. This figure illustrates the observed value versus the expected normal for school leaders who spent 10 years in their last teaching position based on their school’s school-wide 2015 SAGE % mathematics proficiency.
Figure J-54. Normal Q-Q Plot of 2015 SAGE % Mathematics Proficiency for Yrs_Last_Teach_Pos = 11. This figure illustrates the observed value versus the expected normal for school leaders who spent 11 years in their last teaching position based on their school’s school-wide 2015 SAGE % mathematics proficiency.
252
Figure J-55. Normal Q-Q Plot of 2015 SAGE % Mathematics Proficiency for Yrs_Last_Teach_Pos = 12. This figure illustrates the observed value versus the expected normal for school leaders who spent 12 years in their last teaching position based on their school’s school-wide 2015 SAGE % mathematics proficiency.
Figure J-56. Normal Q-Q Plot of 2015 SAGE % Mathematics Proficiency for Yrs_Last_Teach_Pos = 13. This figure illustrates the observed value versus the expected normal for school leaders who spent 13 years in their last teaching position based on their school’s school-wide 2015 SAGE % mathematics proficiency.
253
Figure J-57. Normal Q-Q Plot of 2015 SAGE % Mathematics Proficiency for Yrs_Last_Teach_Pos = 15. This figure illustrates the observed value versus the expected normal for school leaders who spent 15 years in their last teaching position based on their school’s school-wide 2015 SAGE % mathematics proficiency.
Figure J-58. Normal Q-Q Plot of 2015 SAGE % Mathematics Proficiency for Yrs_Last_Teach_Pos = 17. This figure illustrates the observed value versus the expected normal for school leaders who spent 17 years in their last teaching position based on their school’s school-wide 2015 SAGE % mathematics proficiency.
254
Figure J-59. Normal Q-Q Plot of 2015 SAGE % Mathematics Proficiency for Yrs_Last_Teach_Pos = 18. This figure illustrates the observed value versus the expected normal for school leaders who spent 18 years in their last teaching position based on their school’s school-wide 2015 SAGE % mathematics proficiency.
Figure J-60. Normal Q-Q Plot of 2015 SAGE % Mathematics Proficiency for Yrs_Last_Teach_Pos = 19. This figure illustrates the observed value versus the expected normal for school leaders who spent 19 years in their last teaching position based on their school’s school-wide 2015 SAGE % mathematics proficiency.
255
Figure J-61. Normal Q-Q Plot of 2015 SAGE % Mathematics Proficiency for Yrs_Last_Teach_Pos = 20. This figure illustrates the observed value versus the expected normal for school leaders who spent 20 years in their last teaching position based on their school’s school-wide 2015 SAGE % mathematics proficiency.
Figure J-62. Normal Q-Q Plot of 2015 SAGE % Mathematics Proficiency for Yrs_Last_Teach_Pos = 21. This figure illustrates the observed value versus the expected normal for school leaders who spent 21 years in their last teaching position based on their school’s school-wide 2015 SAGE % mathematics proficiency.
256
Figure J-63. Normal Q-Q Plot of 2015 SAGE % Mathematics Proficiency for Yrs_Last_Teach_Pos = 22. This figure illustrates the observed value versus the expected normal for school leaders who spent 22 years in their last teaching position based on their school’s school-wide 2015 SAGE % mathematics proficiency.
Figure J-64. Normal Q-Q Plot of 2015 SAGE % Mathematics Proficiency for Yrs_Last_Teach_Pos = 24. This figure illustrates the observed value versus the expected normal for school leaders who spent 24 years in their last teaching position based on their school’s school-wide 2015 SAGE % mathematics proficiency.
257
Figure J-65. Boxplot of 2015 SAGE % Mathematics Proficiency for Yrs_Last_Teach_Pos. This figure illustrates spread of school-wide 2015 SAGE % Mathematics Proficiency scores based on school leaders’ number of years in their last teaching position.
258 Table J-4 MTL64: Tests of Normality Shapiro-Wilk ──────────── Variable MTL64
Statistic
df
Sig.
Skewness
Std. Error
Kurtosis
Std. Error
2
.89
8
.209
-1.38
.75
1.89
1.48
3
.97
37
.378
.43
.39
-.05
.76
4
.96
35
.172
-.14
.40
-.03
.78
5
.83
6
.10
-1.39
.85
2.54
1.74
1
Figure J-66. Frequency by 2015 SAGE % Mathematics Proficiency for MTL64 = 1. This figure illustrates the number of school leaders who rated MTL64 at 1 based on their school’s school-wide 2015 SAGE % mathematics proficiency.
259
Figure J-67. Frequency by 2015 SAGE % Mathematics Proficiency for MTL64 = 2. This figure illustrates the number of school leaders who rated MTL64 at 2 based on their school’s school-wide 2015 SAGE % mathematics proficiency.
Figure J-68. Frequency by 2015 SAGE % Mathematics Proficiency for MTL64 = 3. This figure illustrates the number of school leaders who rated MTL64 at 3 based on their school’s school-wide 2015 SAGE % mathematics proficiency.
260
Figure J-69. Frequency by 2015 SAGE % Mathematics Proficiency for MTL64 = 4. This figure illustrates the number of school leaders who rated MTL64 at 4 based on their school’s school-wide 2015 SAGE % mathematics proficiency.
Figure J-70. Frequency by 2015 SAGE % Mathematics Proficiency for MTL64 = 5. This figure illustrates the number of school leaders who rated MTL64 at 5 based on their school’s school-wide 2015 SAGE % mathematics proficiency.
261
Figure J-71. Normal Q-Q Plot of 2015 SAGE % Mathematics Proficiency for MTL64 = 1. This figure illustrates the observed value versus the expected normal for school leaders who ranked MTL64 as 1 based on their school’s school-wide 2015 SAGE % mathematics proficiency.
Figure J-72. Normal Q-Q Plot of 2015 SAGE % Mathematics Proficiency for MTL64 = 2. This figure illustrates the observed value versus the expected normal for school leaders who ranked MTL64 as 2 based on their school’s school-wide 2015 SAGE % mathematics proficiency.
262
Figure J-73. Normal Q-Q Plot of 2015 SAGE % Mathematics Proficiency for MTL64 = 3. This figure illustrates the observed value versus the expected normal for school leaders who ranked MTL64 as 3 based on their school’s school-wide 2015 SAGE % mathematics proficiency.
Figure J-74. Normal Q-Q Plot of 2015 SAGE % Mathematics Proficiency for MTL64 = 4. This figure illustrates the observed value versus the expected normal for school leaders who ranked MTL64 as 4 based on their school’s school-wide 2015 SAGE % mathematics proficiency.
263
Figure J-75. Normal Q-Q Plot of 2015 SAGE % Mathematics Proficiency for MTL64 = 5. This figure illustrates the observed value versus the expected normal for school leaders who ranked MTL64 as 5 based on their school’s school-wide 2015 SAGE % mathematics proficiency.
Figure J-76. Boxplot of 2015 SAGE % Mathematics Proficiency for MTL64. This figure illustrates spread of school-wide 2015 SAGE % Mathematics Proficiency scores based on school leaders’ ranking of MTL64.
264 Table J-5 Tot_Yrs_Teach: Tests of Normality Shapiro-Wilk ──────────── Variable Tot_Yrs_ Teach
Statistic
df
Sig.
Skewness
Std. Error
Kurtosis
Std. Error
.97
3
.683
-.83
1.23
3
.99
3
.844
-.42
1.23
4
.97
10
.899
-.25
.69
-.65
1.33
5
.96
13
.68
-.16
.62
-1.03
1.19
6
.96
8
.77
-.85
.75
1.18
1.48
7
.95
15
.552
-.44
.58
-.59
1.12
8
.96
11
.737
.53
.66
-.35
1.28
9
.93
8
.545
-.29
.75
-1.29
1.48
10
.94
8
.567
.81
.75
.09
1.48
0 1 2
11
.99
4
.952
-.12
1.01
-1.42
2.62
12
.94
6
.677
-.18
.85
-1.2
1.74
13
.93
4
.591
1.16
1.01
1.83
2.62
14
.85
5
.189
-1.57
.91
2.43
2.00
15
.95
12
.624
-.27
.64
1.33
1.23
16
.93
6
.606
18
.96
3
.616
.98
1.23
19
.85
3
.243
1.61
1.23
20
.78
5
.056
-1.82
.91
3.40
2.00
.98
4
.903
.55
1.01
-.46
2.62
17
21 22 23 24 25 26 27 28 29
265
Figure J-77. Frequency by 2015 SAGE % Mathematics Proficiency for Tot_Yrs_Teach = 0. This figure illustrates the number of school leaders who spent 0 years in total teaching based on their school’s school-wide 2015 SAGE % mathematics proficiency.
Figure J-78. Frequency by 2015 SAGE % Mathematics Proficiency for Tot_Yrs_Teach = 3. This figure illustrates the number of school leaders who spent 3 years in total teaching based on their school’s school-wide 2015 SAGE % mathematics proficiency.
266
Figure J-79. Frequency by 2015 SAGE % Mathematics Proficiency for Tot_Yrs_Teach = 4. This figure illustrates the number of school leaders who spent 4 years in total teaching based on their school’s school-wide 2015 SAGE % mathematics proficiency.
Figure J-80. Frequency by 2015 SAGE % Mathematics Proficiency for Tot_Yrs_Teach = 5. This figure illustrates the number of school leaders who spent 5 years in total teaching based on their school’s school-wide 2015 SAGE % mathematics proficiency.
267
Figure J-81. Frequency by 2015 SAGE % Mathematics Proficiency for Tot_Yrs_Teach = 6. This figure illustrates the number of school leaders who spent 6 years in total teaching based on their school’s school-wide 2015 SAGE % mathematics proficiency.
Figure J-82. Frequency by 2015 SAGE % Mathematics Proficiency for Tot_Yrs_Teach = 7. This figure illustrates the number of school leaders who spent 7 years in total teaching based on their school’s school-wide 2015 SAGE % mathematics proficiency.
268
Figure J-83. Frequency by 2015 SAGE % Mathematics Proficiency for Tot_Yrs_Teach = 8. This figure illustrates the number of school leaders who spent 8 years in total teaching based on their school’s school-wide 2015 SAGE % mathematics proficiency.
Figure J-84. Frequency by 2015 SAGE % Mathematics Proficiency for Tot_Yrs_Teach = 9. This figure illustrates the number of school leaders who spent 9 years in total teaching based on their school’s school-wide 2015 SAGE % mathematics proficiency.
269
Figure J-85. Frequency by 2015 SAGE % Mathematics Proficiency for Tot_Yrs_Teach = 10. This figure illustrates the number of school leaders who spent 10 years in total teaching based on their school’s school-wide 2015 SAGE % mathematics proficiency.
Figure J-86. Frequency by 2015 SAGE % Mathematics Proficiency for Tot_Yrs_Teach = 11. This figure illustrates the number of school leaders who spent 11 years in total teaching based on their school’s school-wide 2015 SAGE % mathematics proficiency.
270
Figure J-87. Frequency by 2015 SAGE % Mathematics Proficiency for Tot_Yrs_Teach = 12. This figure illustrates the number of school leaders who spent 12 years in total teaching based on their school’s school-wide 2015 SAGE % mathematics proficiency.
Figure J-88. Frequency by 2015 SAGE % Mathematics Proficiency for Tot_Yrs_Teach = 13. This figure illustrates the number of school leaders who spent 13 years in total teaching based on their school’s school-wide 2015 SAGE % mathematics proficiency.
271
Figure J-89. Frequency by 2015 SAGE % Mathematics Proficiency for Tot_Yrs_Teach = 14. This figure illustrates the number of school leaders who spent 14 years in total teaching based on their school’s school-wide 2015 SAGE % mathematics proficiency.
Figure J-90. Frequency by 2015 SAGE % Mathematics Proficiency for Tot_Yrs_Teach = 15. This figure illustrates the number of school leaders who spent 15 years in total teaching based on their school’s school-wide 2015 SAGE % mathematics proficiency.
272
Figure J-91. Frequency by 2015 SAGE % Mathematics Proficiency for Tot_Yrs_Teach = 16. This figure illustrates the number of school leaders who spent 16 years in total teaching based on their school’s school-wide 2015 SAGE % mathematics proficiency.
Figure J-92. Frequency by 2015 SAGE % Mathematics Proficiency for Tot_Yrs_Teach = 17. This figure illustrates the number of school leaders who spent 17 years in total teaching based on their school’s school-wide 2015 SAGE % mathematics proficiency.
273
Figure J-93. Frequency by 2015 SAGE % Mathematics Proficiency for Tot_Yrs_Teach = 18. This figure illustrates the number of school leaders who spent 18 years in total teaching based on their school’s school-wide 2015 SAGE % mathematics proficiency.
Figure J-94. Frequency by 2015 SAGE % Mathematics Proficiency for Tot_Yrs_Teach = 19. This figure illustrates the number of school leaders who spent 19 years in total teaching based on their school’s school-wide 2015 SAGE % mathematics proficiency.
274
Figure J-95. Frequency by 2015 SAGE % Mathematics Proficiency for Tot_Yrs_Teach = 20. This figure illustrates the number of school leaders who spent 20 years in total teaching based on their school’s school-wide 2015 SAGE % mathematics proficiency.
Figure J-96. Frequency by 2015 SAGE % Mathematics Proficiency for Tot_Yrs_Teach = 22. This figure illustrates the number of school leaders who spent 22 years in total teaching based on their school’s school-wide 2015 SAGE % mathematics proficiency.
275
Figure J-97. Frequency by 2015 SAGE % Mathematics Proficiency for Tot_Yrs_Teach = 24. This figure illustrates the number of school leaders who spent 24 years in total teaching based on their school’s school-wide 2015 SAGE % mathematics proficiency.
Figure J-98. Frequency by 2015 SAGE % Mathematics Proficiency for Tot_Yrs_Teach = 29. This figure illustrates the number of school leaders who spent 29 years in total teaching based on their school’s school-wide 2015 SAGE % mathematics proficiency.
276
Figure J-99. Normal Q-Q Plot of 2015 SAGE % Mathematics Proficiency for Tot_Yrs_Teach = 0. This figure illustrates the observed value versus the expected normal for school leaders who spent 0 years total teaching based on their school’s school-wide 2015 SAGE % mathematics proficiency.
Figure J-100. Normal Q-Q Plot of 2015 SAGE % Mathematics Proficiency for Tot_Yrs_Teach = 3. This figure illustrates the observed value versus the expected normal for school leaders who spent 3 years total teaching based on their school’s school-wide 2015 SAGE % mathematics proficiency.
277
Figure J-101. Normal Q-Q Plot of 2015 SAGE % Mathematics Proficiency for Tot_Yrs_Teach = 4. This figure illustrates the observed value versus the expected normal for school leaders who spent 4 years total teaching based on their school’s school-wide 2015 SAGE % mathematics proficiency.
Figure J-102. Normal Q-Q Plot of 2015 SAGE % Mathematics Proficiency for Tot_Yrs_Teach = 5. This figure illustrates the observed value versus the expected normal for school leaders who spent 5 years total teaching based on their school’s school-wide 2015 SAGE % mathematics proficiency.
278
Figure J-103. Normal Q-Q Plot of 2015 SAGE % Mathematics Proficiency for Tot_Yrs_Teach = 6. This figure illustrates the observed value versus the expected normal for school leaders who spent 6 years total teaching based on their school’s school-wide 2015 SAGE % mathematics proficiency.
Figure J-104. Normal Q-Q Plot of 2015 SAGE % Mathematics Proficiency for Tot_Yrs_Teach = 7. This figure illustrates the observed value versus the expected normal for school leaders who spent 7 years total teaching based on their school’s school-wide 2015 SAGE % mathematics proficiency.
279
Figure J-105. Normal Q-Q Plot of 2015 SAGE % Mathematics Proficiency for Tot_Yrs_Teach = 8. This figure illustrates the observed value versus the expected normal for school leaders who spent 8 years total teaching based on their school’s school-wide 2015 SAGE % mathematics proficiency.
Figure J-106. Normal Q-Q Plot of 2015 SAGE % Mathematics Proficiency for Tot_Yrs_Teach = 9. This figure illustrates the observed value versus the expected normal for school leaders who spent 9 years total teaching based on their school’s school-wide 2015 SAGE % mathematics proficiency.
280
Figure J-107. Normal Q-Q Plot of 2015 SAGE % Mathematics Proficiency for Tot_Yrs_Teach = 10. This figure illustrates the observed value versus the expected normal for school leaders who spent 10 years total teaching based on their school’s school-wide 2015 SAGE % mathematics proficiency.
Figure J-108. Normal Q-Q Plot of 2015 SAGE % Mathematics Proficiency for Tot_Yrs_Teach = 11. This figure illustrates the observed value versus the expected normal for school leaders who spent 11 years total teaching based on their school’s school-wide 2015 SAGE % mathematics proficiency.
281
Figure J-109. Normal Q-Q Plot of 2015 SAGE % Mathematics Proficiency for Tot_Yrs_Teach = 12. This figure illustrates the observed value versus the expected normal for school leaders who spent 12 years total teaching based on their school’s school-wide 2015 SAGE % mathematics proficiency.
Figure J-110. Normal Q-Q Plot of 2015 SAGE % Mathematics Proficiency for Tot_Yrs_Teach = 13. This figure illustrates the observed value versus the expected normal for school leaders who spent 13 years total teaching based on their school’s school-wide 2015 SAGE % mathematics proficiency.
282
Figure J-111. Normal Q-Q Plot of 2015 SAGE % Mathematics Proficiency for Tot_Yrs_Teach = 14. This figure illustrates the observed value versus the expected normal for school leaders who spent 14 years total teaching based on their school’s school-wide 2015 SAGE % mathematics proficiency.
Figure J-112. Normal Q-Q Plot of 2015 SAGE % Mathematics Proficiency for Tot_Yrs_Teach = 15. This figure illustrates the observed value versus the expected normal for school leaders who spent 15 years total teaching based on their school’s school-wide 2015 SAGE % mathematics proficiency.
283
Figure J-113. Normal Q-Q Plot of 2015 SAGE % Mathematics Proficiency for Tot_Yrs_Teach = 16. This figure illustrates the observed value versus the expected normal for school leaders who spent 16 years total teaching based on their school’s school-wide 2015 SAGE % mathematics proficiency.
Figure J-114. Normal Q-Q Plot of 2015 SAGE % Mathematics Proficiency for Tot_Yrs_Teach = 17. This figure illustrates the observed value versus the expected normal for school leaders who spent 17 years total teaching based on their school’s school-wide 2015 SAGE % mathematics proficiency.
284
Figure J-115. Normal Q-Q Plot of 2015 SAGE % Mathematics Proficiency for Tot_Yrs_Teach = 18. This figure illustrates the observed value versus the expected normal for school leaders who spent 18 years total teaching based on their school’s school-wide 2015 SAGE % mathematics proficiency.
Figure J-116. Normal Q-Q Plot of 2015 SAGE % Mathematics Proficiency for Tot_Yrs_Teach = 19. This figure illustrates the observed value versus the expected normal for school leaders who spent 19 years total teaching based on their school’s school-wide 2015 SAGE % mathematics proficiency.
285
Figure J-117. Normal Q-Q Plot of 2015 SAGE % Mathematics Proficiency for Tot_Yrs_Teach =20. This figure illustrates the observed value versus the expected normal for school leaders who spent 20 years total teaching based on their school’s school-wide 2015 SAGE % mathematics proficiency.
Figure J-118. Normal Q-Q Plot of 2015 SAGE % Mathematics Proficiency for Tot_Yrs_Teach = 22. This figure illustrates the observed value versus the expected normal for school leaders who spent 22 years total teaching based on their school’s school-wide 2015 SAGE % mathematics proficiency.
286
Figure J-119. Normal Q-Q Plot of 2015 SAGE % Mathematics Proficiency for Tot_Yrs_Teach = 24. This figure illustrates the observed value versus the expected normal for school leaders who spent 24 years total teaching based on their school’s school-wide 2015 SAGE % mathematics proficiency.
Figure J-120. Normal Q-Q Plot of 2015 SAGE % Mathematics Proficiency for Tot_Yrs_Teach = 29. This figure illustrates the observed value versus the expected normal for school leaders who spent 29 years total teaching based on their school’s school-wide 2015 SAGE % mathematics proficiency.
287
Figure J-121. Boxplot of 2015 SAGE % Mathematics Proficiency for Tot_Yrs_Teach. This figure illustrates spread of school-wide 2015 SAGE % Mathematics Proficiency scores based on school leaders’ total number of years teaching.
288 Table J-6 Inf_Teach3: Tests of Normality Shapiro-Wilk ──────────── Variable Inf_Teach3
Statistic
df
Sig.
Skewness
Std. Error
Kurtosis
Std. Error
5
.97
32
.502
-.43
.41
-.50
.81
6
.99
114
.307
-.28
.23
.24
.45
1 2 3 4
Figure J-122. Frequency by 2015 SAGE % Mathematics Proficiency for Inf_Teach3 = 3. This figure illustrates the number of school leaders who rated Inf_Teach3 at 3 based on their school’s school-wide 2015 SAGE % mathematics proficiency.
289
Figure J-123. Frequency by 2015 SAGE % Mathematics Proficiency for Inf_Teach3 = 5. This figure illustrates the number of school leaders who rated Inf_Teach3 at 5 based on their school’s school-wide 2015 SAGE % mathematics proficiency.
Figure J-124. Frequency by 2015 SAGE % Mathematics Proficiency for Inf_Teach3 = 6. This figure illustrates the number of school leaders who rated Inf_Teach3 at 6 based on their school’s school-wide 2015 SAGE % mathematics proficiency.
290
Figure J-125. Normal Q-Q Plot of 2015 SAGE % Mathematics Proficiency for Inf_Teach3 = 3. This figure illustrates the observed value versus the expected normal for school leaders who ranked Inf_Teach3 as 3 based on their school’s school-wide 2015 SAGE % mathematics proficiency.
Figure J-126. Normal Q-Q Plot of 2015 SAGE % Mathematics Proficiency for Inf_Teach3 = 5. This figure illustrates the observed value versus the expected normal for school leaders who ranked Inf_Teach3 as 5 based on their school’s school-wide 2015 SAGE % mathematics proficiency.
291
Figure J-127. Normal Q-Q Plot of 2015 SAGE % Mathematics Proficiency for Inf_Teach3 = 6. This figure illustrates the observed value versus the expected normal for school leaders who ranked Inf_Teach3 as 6 based on their school’s school-wide 2015 SAGE % mathematics proficiency.
Figure J-128. Boxplot of 2015 SAGE % Mathematics Proficiency for Inf_Teach3. This figure illustrates spread of school-wide 2015 SAGE % Mathematics Proficiency scores based on school leaders’ ranking of Inf_Teach3.
292 Table J-7 Math_Ed: Tests of Normality Shapiro-Wilk ──────────── Variable Math_ Ed
Statistic
df
Sig.
Skewness
Std. Error
Kurtosis
Std. Error
No
.99
130
.173
-.33
.21
.33
.42
Yes, Minor
.95
15
.547
-.33
.58
-.96
1.12
Yes, Major
.74
4
.029
-1.91
1.01
3.73
2.62
Figure J-129. Frequency by 2015 SAGE % Mathematics Proficiency for Math_Ed = No. This figure illustrates the number of school leaders who rated Math_Ed at No based on their school’s school-wide 2015 SAGE % mathematics proficiency.
293
Figure J-130. Frequency by 2015 SAGE % Mathematics Proficiency for Math_Ed = Yes, Minor/Sp.Emphasis. This figure illustrates the number of school leaders who rated Math_Ed at Yes, Minor/Sp.Emphasis based on their school’s school-wide 2015 SAGE % mathematics proficiency.
Figure J-131. Frequency by 2015 SAGE % Mathematics Proficiency for Math_Ed = Yes, Major. This figure illustrates the number of school leaders who rated Math_Ed at Yes, Major based on their school’s school-wide 2015 SAGE % mathematics proficiency.
294
Figure J-132. Normal Q-Q Plot of 2015 SAGE % Mathematics Proficiency for Math _Ed = No. This figure illustrates the observed value versus the expected normal for school leaders who ranked Math_Ed as No based on their school’s school-wide 2015 SAGE % mathematics proficiency.
Figure J-133. Normal Q-Q Plot of 2015 SAGE % Mathematics Proficiency for Math _Ed = Yes, Minor/Sp.Emphasis. This figure illustrates the observed value versus the expected normal for school leaders who ranked Math_Ed as Yes, Minor/Sp.Emphasis based on their school’s school-wide 2015 SAGE % mathematics proficiency.
295
Figure J-134. Normal Q-Q Plot of 2015 SAGE % Mathematics Proficiency for Math _Ed = Yes, Major. This figure illustrates the observed value versus the expected normal for school leaders who ranked Math_Ed as Yes, Major based on their school’s school-wide 2015 SAGE % mathematics proficiency.
Figure J-135. Boxplot of 2015 SAGE % Mathematics Proficiency for Math_Ed. This figure illustrates spread of school-wide 2015 SAGE % Mathematics Proficiency scores based on school leaders’ ranking of Math_Ed.
296 Table J-8 MTL12: Tests for Normality Shapiro-Wilk ──────────── Variable MTL12
1
Statistic .91
df 12
Sig. .230
Skewness .71
Std. Error .64
Kurtosis -.58
Std. Error 1.23
2
.97
46
.309
-.09
.35
-.73
.69
3
.97
49
.272
-.39
.34
.28
.67
4
.98
34
.674
-.39
.40
-.16
.79
5
.99
6
.980
-.15
.85
-.94
1.74
Figure J-136. Frequency by 2015 SAGE % Mathematics Proficiency for MTL12 = 1. This figure illustrates the number of school leaders who rated MTL12 at 1 based on their school’s school-wide 2015 SAGE % mathematics proficiency.
297
Figure J-137. Frequency by 2015 SAGE % Mathematics Proficiency for MTL12 = 2. This figure illustrates the number of school leaders who rated MTL12 at 2 based on their school’s school-wide 2015 SAGE % mathematics proficiency.
Figure J-138. Frequency by 2015 SAGE % Mathematics Proficiency for MTL12 = 3. This figure illustrates the number of school leaders who rated MTL12 at 3 based on their school’s school-wide 2015 SAGE % mathematics proficiency.
298
Figure J-139. Frequency by 2015 SAGE % Mathematics Proficiency for MTL12 = 4. This figure illustrates the number of school leaders who rated MTL12 at 4 based on their school’s school-wide 2015 SAGE % mathematics proficiency.
Figure J-140. Frequency by 2015 SAGE % Mathematics Proficiency for MTL12 = 5. This figure illustrates the number of school leaders who rated MTL12 at 5 based on their school’s school-wide 2015 SAGE % mathematics proficiency.
299
Figure J-141. Normal Q-Q Plot of 2015 SAGE % Mathematics Proficiency for MTL12 = 1. This figure illustrates the observed value versus the expected normal for school leaders who ranked MTL12 as 1 based on their school’s school-wide 2015 SAGE % mathematics proficiency.
Figure J-142. Normal Q-Q Plot of 2015 SAGE % Mathematics Proficiency for MTL12 = 2. This figure illustrates the observed value versus the expected normal for school leaders who ranked MTL12 as 2 based on their school’s school-wide 2015 SAGE % mathematics proficiency.
300
Figure J-143. Normal Q-Q Plot of 2015 SAGE % Mathematics Proficiency for MTL12 = 3. This figure illustrates the observed value versus the expected normal for school leaders who ranked MTL12 as 3 based on their school’s school-wide 2015 SAGE % mathematics proficiency.
Figure J-144. Normal Q-Q Plot of 2015 SAGE % Mathematics Proficiency for MTL12 = 4. This figure illustrates the observed value versus the expected normal for school leaders who ranked MTL12 as 4 based on their school’s school-wide 2015 SAGE % mathematics proficiency.
301
Figure J-145. Normal Q-Q Plot of 2015 SAGE % Mathematics Proficiency for MTL12 = 5. This figure illustrates the observed value versus the expected normal for school leaders who ranked MTL12 as 5 based on their school’s school-wide 2015 SAGE % mathematics proficiency.
Figure J-146. Boxplot of 2015 SAGE % Mathematics Proficiency for MTL12. This figure illustrates spread of school-wide 2015 SAGE % Mathematics Proficiency scores based on school leaders’ ranking of MTL12.
302 Table J-9 ISAM3: Tests for Normality Shapiro-Wilk ──────────── Variable ISAM3
Statistic
df
Sig.
Skewness
Std. Error
Kurtosis
Std. Error
2
.97
10
.912
-.48
.69
.48
1.33
3
.96
34
.257
-.38
.40
-.59
.79
4
.98
76
.181
-.4
.28
-.01
.55
5
.93
22
.132
-.51
.49
.39
.95
1
Figure J-147. Frequency by 2015 SAGE % Mathematics Proficiency for ISAM3 = 1. This figure illustrates the number of school leaders who rated ISAM3 at 1 based on their school’s school-wide 2015 SAGE % mathematics proficiency.
303
Figure J-148. Frequency by 2015 SAGE % Mathematics Proficiency for ISAM3 = 2. This figure illustrates the number of school leaders who rated ISAM3 at 2 based on their school’s school-wide 2015 SAGE % mathematics proficiency.
Figure J-149. Frequency by 2015 SAGE % Mathematics Proficiency for ISAM3 = 3. This figure illustrates the number of school leaders who rated ISAM3 at 3 based on their school’s school-wide 2015 SAGE % mathematics proficiency.
304
Figure J-150. Frequency by 2015 SAGE % Mathematics Proficiency for ISAM3 = 4. This figure illustrates the number of school leaders who rated ISAM3 at 4 based on their school’s school-wide 2015 SAGE % mathematics proficiency.
Figure J-151. Frequency by 2015 SAGE % Mathematics Proficiency for ISAM3 = 5. This figure illustrates the number of school leaders who rated ISAM3 at 5 based on their school’s school-wide 2015 SAGE % mathematics proficiency.
305
Figure J-152. Normal Q-Q Plot of 2015 SAGE % Mathematics Proficiency for ISAM3 = 1. This figure illustrates the observed value versus the expected normal for school leaders who ranked ISAM3 as 1 based on their school’s school-wide 2015 SAGE % mathematics proficiency.
Figure J-153. Normal Q-Q Plot of 2015 SAGE % Mathematics Proficiency for ISAM3 = 2. This figure illustrates the observed value versus the expected normal for school leaders who ranked ISAM3 as 2 based on their school’s school-wide 2015 SAGE % mathematics proficiency.
306
Figure J-154. Normal Q-Q Plot of 2015 SAGE % Mathematics Proficiency for ISAM3 = 3. This figure illustrates the observed value versus the expected normal for school leaders who ranked ISAM3 as 3 based on their school’s school-wide 2015 SAGE % mathematics proficiency.
Figure J-155. Normal Q-Q Plot of 2015 SAGE % Mathematics Proficiency for ISAM3 = 4. This figure illustrates the observed value versus the expected normal for school leaders who ranked ISAM3 as 4 based on their school’s school-wide 2015 SAGE % mathematics proficiency.
307
Figure J-156. Normal Q-Q Plot of 2015 SAGE % Mathematics Proficiency for ISAM3 = 5. This figure illustrates the observed value versus the expected normal for school leaders who ranked ISAM3 as 5 based on their school’s school-wide 2015 SAGE % mathematics proficiency.
Figure J-157. Boxplot of 2015 SAGE % Mathematics Proficiency for ISAM3. This figure illustrates spread of school-wide 2015 SAGE % Mathematics Proficiency scores based on school leaders’ ranking of ISAM3.
308 Table J-10 MTL35: Tests for Normality Shapiro-Wilk ──────────── Variable MTL35
1
Statistic .92
df 5
Sig. .530
Skewness -.49
Std. Error .91
Kurtosis -2.04
Std. Error 2.00
2
.96
55
.050
-.59
.32
1.02
.63
3
.97
45
.252
.31
.35
-.27
.70
4
.93
25
.097
-.03
.46
-1.25
.90
5
.96
7
.808
-.52
.79
-.48
1.59
Figure J-158. Frequency by 2015 SAGE % Mathematics Proficiency for MTL35 = 1. This figure illustrates the number of school leaders who rated MTL35 at 1 based on their school’s school-wide 2015 SAGE % mathematics proficiency.
309
Figure J-159. Frequency by 2015 SAGE % Mathematics Proficiency for MTL35 = 2. This figure illustrates the number of school leaders who rated MTL35 at 2 based on their school’s school-wide 2015 SAGE % mathematics proficiency.
Figure J-160. Frequency by 2015 SAGE % Mathematics Proficiency for MTL35 = 3. This figure illustrates the number of school leaders who rated MTL35 at 3 based on their school’s school-wide 2015 SAGE % mathematics proficiency.
310
Figure J-161. Frequency by 2015 SAGE % Mathematics Proficiency for MTL35 = 4. This figure illustrates the number of school leaders who rated MTL35 at 4 based on their school’s school-wide 2015 SAGE % mathematics proficiency.
Figure J-162. Frequency by 2015 SAGE % Mathematics Proficiency for MTL35 = 5. This figure illustrates the number of school leaders who rated MTL35 at 5 based on their school’s school-wide 2015 SAGE % mathematics proficiency.
311
Figure J-163. Normal Q-Q Plot of 2015 SAGE % Mathematics Proficiency for MTL35 = 1. This figure illustrates the observed value versus the expected normal for school leaders who ranked MTL35 as 1 based on their school’s school-wide 2015 SAGE % mathematics proficiency.
Figure J-164. Normal Q-Q Plot of 2015 SAGE % Mathematics Proficiency for MTL35 = 2. This figure illustrates the observed value versus the expected normal for school leaders who ranked MTL35 as 2 based on their school’s school-wide 2015 SAGE % mathematics proficiency.
312
Figure J-165. Normal Q-Q Plot of 2015 SAGE % Mathematics Proficiency for MTL35 = 3. This figure illustrates the observed value versus the expected normal for school leaders who ranked MTL35 as 3 based on their school’s school-wide 2015 SAGE % mathematics proficiency.
Figure J-166. Normal Q-Q Plot of 2015 SAGE % Mathematics Proficiency for MTL35 = 4. This figure illustrates the observed value versus the expected normal for school leaders who ranked MTL35 as 4 based on their school’s school-wide 2015 SAGE % mathematics proficiency.
313
Figure J-167. Normal Q-Q Plot of 2015 SAGE % Mathematics Proficiency for MTL35 = 5. This figure illustrates the observed value versus the expected normal for school leaders who ranked MTL35 as 5 based on their school’s school-wide 2015 SAGE % mathematics proficiency.
Figure J-168. Boxplot of 2015 SAGE % Mathematics Proficiency for MTL35. This figure illustrates spread of school-wide 2015 SAGE % Mathematics Proficiency scores based on school leaders’ ranking of MTL35.
314 Table J-11 Inf_Nat_Org2: Tests for Normality Shapiro-Wilk ───────────── Variable Inf_Nat_ Org2
1
Statistic .96
df 38
Sig. .183
Skewness -.74
Std. Error .38
Kurtosis .98
Std. Error .75
2
.97
30
.565
.20
.43
-.77
.83
3
.95
39
.061
-.88
.38
1.51
.74
4
.94
20
.193
-.75
.51
.03
.99
5
.98
19
.971
.12
.52
-.23
1.01
6
.95
3
.551
1.12
1.23
Figure J-169. Frequency by 2015 SAGE % Mathematics Proficiency for Inf_Nat_Org2 = 1. This figure illustrates the number of school leaders who rated Inf_Nat_Org2 at 1 based on their school’s school-wide 2015 SAGE % mathematics proficiency.
315
Figure J-170. Frequency by 2015 SAGE % Mathematics Proficiency for Inf_Nat_Org2 = 2. This figure illustrates the number of school leaders who rated Inf_Nat_Org2 at 2 based on their school’s school-wide 2015 SAGE % mathematics proficiency.
Figure J-171. Frequency by 2015 SAGE % Mathematics Proficiency for Inf_Nat_Org2 = 3. This figure illustrates the number of school leaders who rated Inf_Nat_Org2 at 3 based on their school’s school-wide 2015 SAGE % mathematics proficiency.
316
Figure J-172. Frequency by 2015 SAGE % Mathematics Proficiency for Inf_Nat_Org2 = 4. This figure illustrates the number of school leaders who rated Inf_Nat_Org2 at 4 based on their school’s school-wide 2015 SAGE % mathematics proficiency.
Figure J-173. Frequency by 2015 SAGE % Mathematics Proficiency for Inf_Nat_Org2 = 5. This figure illustrates the number of school leaders who rated Inf_Nat_Org2 at 5 based on their school’s school-wide 2015 SAGE % mathematics proficiency.
317
Figure J-174. Frequency by 2015 SAGE % Mathematics Proficiency for Inf_Nat_Org2 = 6. This figure illustrates the number of school leaders who rated Inf_Nat_Org2 at 6 based on their school’s school-wide 2015 SAGE % mathematics proficiency.
Figure J-175. Normal Q-Q Plot of 2015 SAGE % Mathematics Proficiency for Inf_Nat_Org2 = 1. This figure illustrates the observed value versus the expected normal for school leaders who ranked Inf_Nat_Org2 as 1 based on their school’s school-wide 2015 SAGE % mathematics proficiency.
318
Figure J-176. Normal Q-Q Plot of 2015 SAGE % Mathematics Proficiency for Inf_Nat_Org2 = 2. This figure illustrates the observed value versus the expected normal for school leaders who ranked Inf_Nat_Org2 as 2 based on their school’s school-wide 2015 SAGE % mathematics proficiency.
Figure J-177. Normal Q-Q Plot of 2015 SAGE % Mathematics Proficiency for Inf_Nat_Org2 = 3. This figure illustrates the observed value versus the expected normal for school leaders who ranked Inf_Nat_Org2 as 3 based on their school’s school-wide 2015 SAGE % mathematics proficiency.
319
Figure J-178. Normal Q-Q Plot of 2015 SAGE % Mathematics Proficiency for Inf_Nat_Org2 = 4. This figure illustrates the observed value versus the expected normal for school leaders who ranked Inf_Nat_Org2 as 4 based on their school’s school-wide 2015 SAGE % mathematics proficiency.
Figure J-179. Normal Q-Q Plot of 2015 SAGE % Mathematics Proficiency for Inf_Nat_Org2 = 5. This figure illustrates the observed value versus the expected normal for school leaders who ranked Inf_Nat_Org2 as 5 based on their school’s school-wide 2015 SAGE % mathematics proficiency.
320
Figure J-180. Normal Q-Q Plot of 2015 SAGE % Mathematics Proficiency for Inf_Nat_Org2 = 6. This figure illustrates the observed value versus the expected normal for school leaders who ranked Inf_Nat_Org2 as 6 based on their school’s school-wide 2015 SAGE % mathematics proficiency.
Figure J-181. Boxplot of 2015 SAGE % Mathematics Proficiency for Inf_Nat_Org2. This figure illustrates spread of school-wide 2015 SAGE % Mathematics Proficiency scores based on school leaders’ ranking of Inf_Nat_Org2.
321 Table J-12 ISAM16: Tests for Normality Shapiro-Wilk ───────────── Variable ISAM16
df 3
Sig. .113
Skewness -1.71
Std. Error 1.23
Kurtosis
Std. Error
1
Statistic .80
2
.96
19
.498
-.19
.52
-.62
1.01
3
.99
51
.829
.06
.33
-.45
.66
4
.98
60
.253
-.61
.31
.63
.61
5
.89
10
.177
.62
.69
-1.11
1.33
Figure J-182. Frequency by 2015 SAGE % Mathematics Proficiency for ISAM16 = 1. This figure illustrates the number of school leaders who rated ISAM16 at 1 based on their school’s school-wide 2015 SAGE % mathematics proficiency.
322
Figure J-183. Frequency by 2015 SAGE % Mathematics Proficiency for ISAM16 = 2. This figure illustrates the number of school leaders who rated ISAM16 at 2 based on their school’s school-wide 2015 SAGE % mathematics proficiency.
Figure J-184. Frequency by 2015 SAGE % Mathematics Proficiency for ISAM16 = 3. This figure illustrates the number of school leaders who rated ISAM16 at 3 based on their school’s school-wide 2015 SAGE % mathematics proficiency.
323
Figure J-185. Frequency by 2015 SAGE % Mathematics Proficiency for ISAM16 = 4. This figure illustrates the number of school leaders who rated ISAM16 at 4 based on their school’s school-wide 2015 SAGE % mathematics proficiency.
Figure J-186. Frequency by 2015 SAGE % Mathematics Proficiency for ISAM16 = 5. This figure illustrates the number of school leaders who rated ISAM16 at 5 based on their school’s school-wide 2015 SAGE % mathematics proficiency.
324
Figure J-187. Normal Q-Q Plot of 2015 SAGE % Mathematics Proficiency for ISAM16 = 1. This figure illustrates the observed value versus the expected normal for school leaders who ranked ISAM16 as 1 based on their school’s school-wide 2015 SAGE % mathematics proficiency.
Figure J-188. Normal Q-Q Plot of 2015 SAGE % Mathematics Proficiency for ISAM16 = 2. This figure illustrates the observed value versus the expected normal for school leaders who ranked ISAM16 as 2 based on their school’s school-wide 2015 SAGE % mathematics proficiency.
325
Figure J-189. Normal Q-Q Plot of 2015 SAGE % Mathematics Proficiency for ISAM16 = 3. This figure illustrates the observed value versus the expected normal for school leaders who ranked ISAM16 as 3 based on their school’s school-wide 2015 SAGE % mathematics proficiency.
Figure J-190. Normal Q-Q Plot of 2015 SAGE % Mathematics Proficiency for ISAM16 = 4. This figure illustrates the observed value versus the expected normal for school leaders who ranked ISAM16 as 4 based on their school’s school-wide 2015 SAGE % mathematics proficiency.
326
Figure J-191. Normal Q-Q Plot of 2015 SAGE % Mathematics Proficiency for ISAM16 = 5. This figure illustrates the observed value versus the expected normal for school leaders who ranked ISAM16 as 5 based on their school’s school-wide 2015 SAGE % mathematics proficiency.
Figure J-192. Boxplot of 2015 SAGE % Mathematics Proficiency for ISAM16. This figure illustrates spread of school-wide 2015 SAGE % Mathematics Proficiency scores based on school leaders’ ranking of ISAM16.
327 Table J-13 ISAM17: Tests for Normality Shapiro-Wilk ───────────── Variable ISAM17
1
Statistic .95
df 8
Sig. .678
Skewness -.68
Std. Error .75
Kurtosis .60
Std. Error 1.48
2
.97
24
.735
.28
.47
.02
.92
3
.97
43
.335
-.10
.36
-.75
.71
4
.98
61
.354
-.48
.31
.28
.60
5
.92
7
.500
.95
.79
1.03
1.59
Figure J-193. Frequency by 2015 SAGE % Mathematics Proficiency for ISAM17 = 1. This figure illustrates the number of school leaders who rated ISAM17 at 1 based on their school’s school-wide 2015 SAGE % mathematics proficiency.
328
Figure J-194. Frequency by 2015 SAGE % Mathematics Proficiency for ISAM17 = 2. This figure illustrates the number of school leaders who rated ISAM17 at 2 based on their school’s school-wide 2015 SAGE % mathematics proficiency.
Figure J-195. Frequency by 2015 SAGE % Mathematics Proficiency for ISAM17 = 3. This figure illustrates the number of school leaders who rated ISAM17 at 3 based on their school’s school-wide 2015 SAGE % mathematics proficiency.
329
Figure J-196. Frequency by 2015 SAGE % Mathematics Proficiency for ISAM17 = 4. This figure illustrates the number of school leaders who rated ISAM17 at 4 based on their school’s school-wide 2015 SAGE % mathematics proficiency.
Figure J-197. Frequency by 2015 SAGE % Mathematics Proficiency for ISAM17 = 5. This figure illustrates the number of school leaders who rated ISAM17 at 5 based on their school’s school-wide 2015 SAGE % mathematics proficiency.
330
Figure J-198. Normal Q-Q Plot of 2015 SAGE % Mathematics Proficiency for ISAM17 = 1. This figure illustrates the observed value versus the expected normal for school leaders who ranked ISAM17 as 1 based on their school’s school-wide 2015 SAGE % mathematics proficiency.
Figure J-199. Normal Q-Q Plot of 2015 SAGE % Mathematics Proficiency for ISAM17 = 2. This figure illustrates the observed value versus the expected normal for school leaders who ranked ISAM17 as 2 based on their school’s school-wide 2015 SAGE % mathematics proficiency.
331
Figure J-200. Normal Q-Q Plot of 2015 SAGE % Mathematics Proficiency for ISAM17 = 3. This figure illustrates the observed value versus the expected normal for school leaders who ranked ISAM17 as 3 based on their school’s school-wide 2015 SAGE % mathematics proficiency.
Figure J-201. Normal Q-Q Plot of 2015 SAGE % Mathematics Proficiency for ISAM17 = 4. This figure illustrates the observed value versus the expected normal for school leaders who ranked ISAM17 as 4 based on their school’s school-wide 2015 SAGE % mathematics proficiency.
332
Figure J-202. Normal Q-Q Plot of 2015 SAGE % Mathematics Proficiency for ISAM17 = 5. This figure illustrates the observed value versus the expected normal for school leaders who ranked ISAM17 as 5 based on their school’s school-wide 2015 SAGE % mathematics proficiency.
Figure J-203. Boxplot of 2015 SAGE % Mathematics Proficiency for ISAM17. This figure illustrates spread of school-wide 2015 SAGE % Mathematics Proficiency scores based on school leaders’ ranking of ISAM17.
333 Table J-14 Fam_PD_CI_Doc: Tests for Normality Shapiro-Wilk ───────────── Variable Fam_PD_ CI_Doc
1
Statistic .86
df 5
Sig. .232
Skewness -.48
Std. Error .91
Kurtosis -2.79
Std. Error 2.00
2
.98
24
.909
-.2
.47
.06
.92
3
.96
32
.333
-.34
.41
.40
.81
4
.98
40
.498
.00
.37
-.72
.73
5
.97
37
.397
-.59
.39
.57
.76
6
.92
9
.393
.53
.72
-.34
1.40
Figure J-204. Frequency by 2015 SAGE % Mathematics Proficiency for Fam_PD_CI_Doc = 1. This figure illustrates the number of school leaders who rated Fam_PD_CI_Doc at 1 based on their school’s school-wide 2015 SAGE % mathematics proficiency.
334
Figure J-205. Frequency by 2015 SAGE % Mathematics Proficiency for Fam_PD_CI_Doc = 2. This figure illustrates the number of school leaders who rated Fam_PD_CI_Doc at 2 based on their school’s school-wide 2015 SAGE % mathematics proficiency.
Figure J-206. Frequency by 2015 SAGE % Mathematics Proficiency for Fam_PD_CI_Doc = 3. This figure illustrates the number of school leaders who rated Fam_PD_CI_Doc at 3 based on their school’s school-wide 2015 SAGE % mathematics proficiency.
335
Figure J-207. Frequency by 2015 SAGE % Mathematics Proficiency for Fam_PD_CI_Doc = 4. This figure illustrates the number of school leaders who rated Fam_PD_CI_Doc at 4 based on their school’s school-wide 2015 SAGE % mathematics proficiency.
Figure J-208. Frequency by 2015 SAGE % Mathematics Proficiency for Fam_PD_CI_Doc = 5. This figure illustrates the number of school leaders who rated Fam_PD_CI_Doc at 5 based on their school’s school-wide 2015 SAGE % mathematics proficiency.
336
Figure J-209. Frequency by 2015 SAGE % Mathematics Proficiency for Fam_PD_CI_Doc = 6. This figure illustrates the number of school leaders who rated Fam_PD_CI_Doc at 6 based on their school’s school-wide 2015 SAGE % mathematics proficiency.
Figure J-210. Normal Q-Q Plot of 2015 SAGE % Mathematics Proficiency for Fam_PD_CI_Doc = 1. This figure illustrates the observed value versus the expected normal for school leaders who ranked Fam_PD_CI_Doc as 1 based on their school’s school-wide 2015 SAGE % mathematics proficiency.
337
Figure J-211. Normal Q-Q Plot of 2015 SAGE % Mathematics Proficiency for Fam_PD_CI_Doc = 2. This figure illustrates the observed value versus the expected normal for school leaders who ranked Fam_PD_CI_Doc as 2 based on their school’s school-wide 2015 SAGE % mathematics proficiency.
Figure J-212. Normal Q-Q Plot of 2015 SAGE % Mathematics Proficiency for Fam_PD_CI_Doc = 3. This figure illustrates the observed value versus the expected normal for school leaders who ranked Fam_PD_CI_Doc as 3 based on their school’s school-wide 2015 SAGE % mathematics proficiency.
338
Figure J-213. Normal Q-Q Plot of 2015 SAGE % Mathematics Proficiency for Fam_PD_CI_Doc = 4. This figure illustrates the observed value versus the expected normal for school leaders who ranked Fam_PD_CI_Doc as 4 based on their school’s school-wide 2015 SAGE % mathematics proficiency.
Figure J-214. Normal Q-Q Plot of 2015 SAGE % Mathematics Proficiency for Fam_PD_CI_Doc = 5. This figure illustrates the observed value versus the expected normal for school leaders who ranked Fam_PD_CI_Doc as 5 based on their school’s school-wide 2015 SAGE % mathematics proficiency.
339
Figure J-215. Normal Q-Q Plot of 2015 SAGE % Mathematics Proficiency for Fam_PD_CI_Doc = 6. This figure illustrates the observed value versus the expected normal for school leaders who ranked Fam_PD_CI_Doc as 6 based on their school’s school-wide 2015 SAGE % mathematics proficiency.
Figure J-216. Boxplot of 2015 SAGE % Mathematics Proficiency for Fam_PD_CI_Doc. This figure illustrates spread of school-wide 2015 SAGE % Mathematics Proficiency scores based on school leaders’ ranking of Fam_PD_CI_Doc.
340 Table J-15 Sec_Ed: Tests for Normality Shapiro-Wilk ───────────── Variable Sec_ Ed No Yes, Minor Yes, Major
Statistic .99
df 94
Sig. .383
Skewness -.39
Std. Error .25
Kurtosis .06
Std. Error .49
.95
18
.460
-.55
.54
1.36
1.04
.97
37
.519
.17
.39
-.85
.76
Figure J-217. Frequency by 2015 SAGE % Mathematics Proficiency for Sec_Ed = No. This figure illustrates the number of school leaders who rated Sec_Ed at No based on their school’s school-wide 2015 SAGE % mathematics proficiency.
341
Figure J-218. Frequency by 2015 SAGE % Mathematics Proficiency for Sec_Ed = Yes, Minor/Sp.Emphasis. This figure illustrates the number of school leaders who rated Sec_Ed at Yes, Minor/Sp.Emphasis based on their school’s school-wide 2015 SAGE % mathematics proficiency.
Figure J-219. Frequency by 2015 SAGE % Mathematics Proficiency for Sec_Ed = Yes, Major. This figure illustrates the number of school leaders who rated Sec_Ed at Yes, Major based on their school’s school-wide 2015 SAGE % mathematics proficiency.
342
Figure J-220. Normal Q-Q Plot of 2015 SAGE % Mathematics Proficiency for Sec_Ed = No. This figure illustrates the observed value versus the expected normal for school leaders who ranked Sec_Ed as No based on their school’s school-wide 2015 SAGE % mathematics proficiency.
Figure J-221. Normal Q-Q Plot of 2015 SAGE % Mathematics Proficiency for Sec_Ed = Yes, Minor/Sp.Emphasis. This figure illustrates the observed value versus the expected normal for school leaders who ranked Sec_Ed as Yes, Minor/Sp.Emphasis based on their school’s school-wide 2015 SAGE % mathematics proficiency.
343
Figure J-222. Normal Q-Q Plot of 2015 SAGE % Mathematics Proficiency for Sec_Ed = Yes, Major. This figure illustrates the observed value versus the expected normal for school leaders who ranked Sec_Ed as Yes, Major based on their school’s school-wide 2015 SAGE % mathematics proficiency.
Figure J-223. Boxplot of 2015 SAGE % Mathematics Proficiency for Sec_Ed. This figure illustrates spread of school-wide 2015 SAGE % Mathematics Proficiency scores based on school leaders’ ranking of Sec_Ed.
344 Table J-16 ISAM13: Tests for Normality Shapiro-Wilk ───────────── Variable ISAM13
Statistic
df
Sig.
Skewness
Std. Error
Kurtosis
Std. Error
3
.94
8
.620
-.48
.75
-.54
1.48
4
.98
78
.176
-.34
.27
-.18
.54
5
.98
57
.565
-.05
.32
-.49
.62
1 2
Figure J-224. Frequency by 2015 SAGE % Mathematics Proficiency for ISAM13 = 3. This figure illustrates the number of school leaders who rated ISAM13 at 3 based on their school’s school-wide 2015 SAGE % mathematics proficiency.
345
Figure J-225. Frequency by 2015 SAGE % Mathematics Proficiency for ISAM13 = 4. This figure illustrates the number of school leaders who rated ISAM13 at 4 based on their school’s school-wide 2015 SAGE % mathematics proficiency.
Figure J-226. Frequency by 2015 SAGE % Mathematics Proficiency for ISAM13 = 5. This figure illustrates the number of school leaders who rated ISAM13 at 5 based on their school’s school-wide 2015 SAGE % mathematics proficiency.
346
Figure J-227. Normal Q-Q Plot of 2015 SAGE % Mathematics Proficiency for ISAM13 = 3. This figure illustrates the observed value versus the expected normal for school leaders who ranked ISAM13 as 3 based on their school’s school-wide 2015 SAGE % mathematics proficiency.
Figure J-228. Normal Q-Q Plot of 2015 SAGE % Mathematics Proficiency for ISAM13 = 4. This figure illustrates the observed value versus the expected normal for school leaders who ranked ISAM13 as 4 based on their school’s school-wide 2015 SAGE % mathematics proficiency.
347
Figure J-229. Normal Q-Q Plot of 2015 SAGE % Mathematics Proficiency for ISAM13 = 5. This figure illustrates the observed value versus the expected normal for school leaders who ranked ISAM13 as 5 based on their school’s school-wide 2015 SAGE % mathematics proficiency.
Figure J-230. Boxplot of 2015 SAGE % Mathematics Proficiency for ISAM13. This figure illustrates spread of school-wide 2015 SAGE % Mathematics Proficiency scores based on school leaders’ ranking of ISAM13.
348 Table J-17 MTL62: Tests for Normality Shapiro-Wilk ───────────── Variable MTL62
Statistic
df
Sig.
Skewness
Std. Error
Kurtosis
Std. Error
3
.94
16
.336
-.21
.56
-.94
1.09
4
.98
66
.534
-.09
.30
-.08
.58
5
.95
5
.725
-.05
.91
1.68
2.00
1 2
Figure J-231. Frequency by 2015 SAGE % Mathematics Proficiency for MTL62 = 2. This figure illustrates the number of school leaders who rated MTL62 at 2 based on their school’s school-wide 2015 SAGE % mathematics proficiency.
349
Figure J-232. Frequency by 2015 SAGE % Mathematics Proficiency for MTL62 = 3. This figure illustrates the number of school leaders who rated MTL62 at 3 based on their school’s school-wide 2015 SAGE % mathematics proficiency.
Figure J-233. Frequency by 2015 SAGE % Mathematics Proficiency for MTL62 = 4. This figure illustrates the number of school leaders who rated MTL62 at 4 based on their school’s school-wide 2015 SAGE % mathematics proficiency.
350
Figure J-234. Frequency by 2015 SAGE % Mathematics Proficiency for MTL62 = 5. This figure illustrates the number of school leaders who rated MTL62 at 5 based on their school’s school-wide 2015 SAGE % mathematics proficiency.
Figure J-235. Normal Q-Q Plot of 2015 SAGE % Mathematics Proficiency for MTL62 = 2. This figure illustrates the observed value versus the expected normal for school leaders who ranked MTL62 as 2 based on their school’s school-wide 2015 SAGE % mathematics proficiency.
351
Figure J-236. Normal Q-Q Plot of 2015 SAGE % Mathematics Proficiency for MTL62 = 2. This figure illustrates the observed value versus the expected normal for school leaders who ranked MTL62 as 2 based on their school’s school-wide 2015 SAGE % mathematics proficiency.
Figure J-237. Normal Q-Q Plot of 2015 SAGE % Mathematics Proficiency for MTL62 = 4. This figure illustrates the observed value versus the expected normal for school leaders who ranked MTL62 as 4 based on their school’s school-wide 2015 SAGE % mathematics proficiency.
352
Figure J-238. Normal Q-Q Plot of 2015 SAGE % Mathematics Proficiency for MTL62 = 5. This figure illustrates the observed value versus the expected normal for school leaders who ranked MTL62 as 5 based on their school’s school-wide 2015 SAGE % mathematics proficiency.
Figure J-239. Boxplot of 2015 SAGE % Mathematics Proficiency for MTL62. This figure illustrates spread of school-wide 2015 SAGE % Mathematics Proficiency scores based on school leaders’ ranking of MTL62.
353 Table J-18 Age: Tests for Normality Shapiro-Wilk ───────────── Variable Age
Statistic
df
Sig.
Skewness
Std. Error
Kurtosis
Std. Error
36
1.
3
.914
-.23
1.23
37
.98
4
.907
.37
1.01
-1.3
2.62
39
.97
4
.85
-.77
1.01
.89
2.62
40
.93
7
.585
.1
.79
-.58
1.59
41
.81
5
.096
-1.78
.91
3.65
2.00
42
.91
7
.418
-.66
.79
-.68
1.59
43
.9
6
.346
.67
.85
-.89
1.74
44
.85
5
.196
.63
.91
-2.52
2.00
45
.9
8
.299
-.59
.75
-.76
1.48
46
.91
5
.451
.77
.91
-1.01
2.00
47
.88
9
.141
-.07
.72
-2.06
1.40
48
.97
7
.884
.03
.79
-1.09
1.59
49
.87
7
.192
1.03
.79
-.13
1.59
50
.99
3
.768
-.62
1.23
51
1.
4
.980
-.32
1.01
.30
2.62
52
.87
4
.301
.17
1.01
-4.76
2.62
53
.89
8
.221
-1.31
.75
3.09
1.48
54
.99
3
.797
.54
1.23
55
.96
3
.631
.95
1.23
56
.91
6
.441
-.75
.85
-1.01
1.74
57
.83
4
.176
1.52
1.01
2.04
2.62
58
1.
3
.919
.22
1.23
59
.97
4
.822
.07
1.01
1.41
2.62
60
.88
6
.279
.79
.85
-1.13
1.74
.96
4
.771
.39
1.01
1.52
2.62
64
.9
3
.394
-1.41
1.23
65
.95
3
.587
1.05
1.23
34 35
38
61 62 63
354
Figure J-240. Frequency by 2015 SAGE % Mathematics Proficiency for Age = 34. This figure illustrates the number of school leaders whose age was 34 based on their school’s school-wide 2015 SAGE % mathematics proficiency.
Figure J-241. Frequency by 2015 SAGE % Mathematics Proficiency for Age = 36. This figure illustrates the number of school leaders whose age was 36 based on their school’s school-wide 2015 SAGE % mathematics proficiency.
355
Figure J-242. Frequency by 2015 SAGE % Mathematics Proficiency for Age = 37. This figure illustrates the number of school leaders whose age was 37 based on their school’s school-wide 2015 SAGE % mathematics proficiency.
Figure J-243. Frequency by 2015 SAGE % Mathematics Proficiency for Age = 38. This figure illustrates the number of school leaders whose age was 38 based on their school’s school-wide 2015 SAGE % mathematics proficiency.
356
Figure J-244. Frequency by 2015 SAGE % Mathematics Proficiency for Age = 39. This figure illustrates the number of school leaders whose age was 39 based on their school’s school-wide 2015 SAGE % mathematics proficiency.
Figure J-245. Frequency by 2015 SAGE % Mathematics Proficiency for Age = 40. This figure illustrates the number of school leaders whose age was 40 based on their school’s school-wide 2015 SAGE % mathematics proficiency.
357
Figure J-246. Frequency by 2015 SAGE % Mathematics Proficiency for Age = 41. This figure illustrates the number of school leaders whose age was 41 based on their school’s school-wide 2015 SAGE % mathematics proficiency.
Figure J-247. Frequency by 2015 SAGE % Mathematics Proficiency for Age = 42. This figure illustrates the number of school leaders whose age was 42 based on their school’s school-wide 2015 SAGE % mathematics proficiency.
358
Figure J-248. Frequency by 2015 SAGE % Mathematics Proficiency for Age = 43. This figure illustrates the number of school leaders whose age was 43 based on their school’s school-wide 2015 SAGE % mathematics proficiency.
Figure J-249. Frequency by 2015 SAGE % Mathematics Proficiency for Age = 44. This figure illustrates the number of school leaders whose age was 44 based on their school’s school-wide 2015 SAGE % mathematics proficiency.
359
Figure J-250. Frequency by 2015 SAGE % Mathematics Proficiency for Age = 45. This figure illustrates the number of school leaders whose age was 45 based on their school’s school-wide 2015 SAGE % mathematics proficiency.
Figure J-251. Frequency by 2015 SAGE % Mathematics Proficiency for Age = 46. This figure illustrates the number of school leaders whose age was 46 based on their school’s school-wide 2015 SAGE % mathematics proficiency.
360
Figure J-252. Frequency by 2015 SAGE % Mathematics Proficiency for Age = 47. This figure illustrates the number of school leaders whose age was 47 based on their school’s school-wide 2015 SAGE % mathematics proficiency.
Figure J-253. Frequency by 2015 SAGE % Mathematics Proficiency for Age = 48. This figure illustrates the number of school leaders whose age was 48 based on their school’s school-wide 2015 SAGE % mathematics proficiency.
361
Figure J-254. Frequency by 2015 SAGE % Mathematics Proficiency for Age = 49. This figure illustrates the number of school leaders whose age was 49 based on their school’s school-wide 2015 SAGE % mathematics proficiency.
Figure J-255. Frequency by 2015 SAGE % Mathematics Proficiency for Age = 50. This figure illustrates the number of school leaders whose age was 50 based on their school’s school-wide 2015 SAGE % mathematics proficiency.
362
Figure J-256. Frequency by 2015 SAGE % Mathematics Proficiency for Age = 51. This figure illustrates the number of school leaders whose age was 51 based on their school’s school-wide 2015 SAGE % mathematics proficiency.
Figure J-257. Frequency by 2015 SAGE % Mathematics Proficiency for Age = 52. This figure illustrates the number of school leaders whose age was 52 based on their school’s school-wide 2015 SAGE % mathematics proficiency.
363
Figure J-258. Frequency by 2015 SAGE % Mathematics Proficiency for Age = 53. This figure illustrates the number of school leaders whose age was 53 based on their school’s school-wide 2015 SAGE % mathematics proficiency.
Figure J-259. Frequency by 2015 SAGE % Mathematics Proficiency for Age = 54. This figure illustrates the number of school leaders whose age was 54 based on their school’s school-wide 2015 SAGE % mathematics proficiency.
364
Figure J-260. Frequency by 2015 SAGE % Mathematics Proficiency for Age = 55. This figure illustrates the number of school leaders whose age was 55 based on their school’s school-wide 2015 SAGE % mathematics proficiency.
Figure J-261. Frequency by 2015 SAGE % Mathematics Proficiency for Age = 56. This figure illustrates the number of school leaders whose age was 56 based on their school’s school-wide 2015 SAGE % mathematics proficiency.
365
Figure J-262. Frequency by 2015 SAGE % Mathematics Proficiency for Age = 57. This figure illustrates the number of school leaders whose age was 57 based on their school’s school-wide 2015 SAGE % mathematics proficiency.
Figure J-263. Frequency by 2015 SAGE % Mathematics Proficiency for Age = 58. This figure illustrates the number of school leaders whose age was 58 based on their school’s school-wide 2015 SAGE % mathematics proficiency.
366
Figure J-264. Frequency by 2015 SAGE % Mathematics Proficiency for Age = 59. This figure illustrates the number of school leaders whose age was 59 based on their school’s school-wide 2015 SAGE % mathematics proficiency.
Figure J-265. Frequency by 2015 SAGE % Mathematics Proficiency for Age = 60. This figure illustrates the number of school leaders whose age was 60 based on their school’s school-wide 2015 SAGE % mathematics proficiency.
367
Figure J-266. Frequency by 2015 SAGE % Mathematics Proficiency for Age = 61. This figure illustrates the number of school leaders whose age was 61 based on their school’s school-wide 2015 SAGE % mathematics proficiency.
Figure J-267. Frequency by 2015 SAGE % Mathematics Proficiency for Age = 62. This figure illustrates the number of school leaders whose age was 362 based on their school’s school-wide 2015 SAGE % mathematics proficiency.
368
Figure J-268. Frequency by 2015 SAGE % Mathematics Proficiency for Age = 63. This figure illustrates the number of school leaders whose age was 63 based on their school’s school-wide 2015 SAGE % mathematics proficiency.
Figure J-269. Frequency by 2015 SAGE % Mathematics Proficiency for Age = 64. This figure illustrates the number of school leaders whose age was 64 based on their school’s school-wide 2015 SAGE % mathematics proficiency.
369
Figure J-270. Frequency by 2015 SAGE % Mathematics Proficiency for Age = 65. This figure illustrates the number of school leaders whose age was 65 based on their school’s school-wide 2015 SAGE % mathematics proficiency.
Figure J-271. Normal Q-Q Plot of 2015 SAGE % Mathematics Proficiency for Age = 34. This figure illustrates the observed value versus the expected normal for school leaders whose age was 34 based on their school’s school-wide 2015 SAGE % mathematics proficiency.
370
Figure J-272. Normal Q-Q Plot of 2015 SAGE % Mathematics Proficiency for Age = 36. This figure illustrates the observed value versus the expected normal for school leaders whose age was 36 based on their school’s school-wide 2015 SAGE % mathematics proficiency.
Figure J-273. Normal Q-Q Plot of 2015 SAGE % Mathematics Proficiency for Age = 37. This figure illustrates the observed value versus the expected normal for school leaders whose age was 37 based on their school’s school-wide 2015 SAGE % mathematics proficiency.
371
Figure J-274. Normal Q-Q Plot of 2015 SAGE % Mathematics Proficiency for Age = 38. This figure illustrates the observed value versus the expected normal for school leaders whose age was 38 based on their school’s school-wide 2015 SAGE % mathematics proficiency.
Figure J-275. Normal Q-Q Plot of 2015 SAGE % Mathematics Proficiency for Age = 39. This figure illustrates the observed value versus the expected normal for school leaders whose age was 39 based on their school’s school-wide 2015 SAGE % mathematics proficiency.
372
Figure J-276. Normal Q-Q Plot of 2015 SAGE % Mathematics Proficiency for Age = 40. This figure illustrates the observed value versus the expected normal for school leaders whose age was 40 based on their school’s school-wide 2015 SAGE % mathematics proficiency.
Figure J-277. Normal Q-Q Plot of 2015 SAGE % Mathematics Proficiency for Age = 41. This figure illustrates the observed value versus the expected normal for school leaders whose age was 41 based on their school’s school-wide 2015 SAGE % mathematics proficiency.
373
Figure J-278. Normal Q-Q Plot of 2015 SAGE % Mathematics Proficiency for Age = 42. This figure illustrates the observed value versus the expected normal for school leaders whose age was 42 based on their school’s school-wide 2015 SAGE % mathematics proficiency.
Figure J-279. Normal Q-Q Plot of 2015 SAGE % Mathematics Proficiency for Age = 43. This figure illustrates the observed value versus the expected normal for school leaders whose age was 43 based on their school’s school-wide 2015 SAGE % mathematics proficiency.
374
Figure J-280. Normal Q-Q Plot of 2015 SAGE % Mathematics Proficiency for Age = 44. This figure illustrates the observed value versus the expected normal for school leaders whose age was 44 based on their school’s school-wide 2015 SAGE % mathematics proficiency.
Figure J-281. Normal Q-Q Plot of 2015 SAGE % Mathematics Proficiency for Age = 45. This figure illustrates the observed value versus the expected normal for school leaders whose age was 45 based on their school’s school-wide 2015 SAGE % mathematics proficiency.
375
Figure J-282. Normal Q-Q Plot of 2015 SAGE % Mathematics Proficiency for Age = 46. This figure illustrates the observed value versus the expected normal for school leaders whose age was 46 based on their school’s school-wide 2015 SAGE % mathematics proficiency.
Figure J-283. Normal Q-Q Plot of 2015 SAGE % Mathematics Proficiency for Age = 47. This figure illustrates the observed value versus the expected normal for school leaders whose age was 47 based on their school’s school-wide 2015 SAGE % mathematics proficiency.
376
Figure J-284. Normal Q-Q Plot of 2015 SAGE % Mathematics Proficiency for Age = 48. This figure illustrates the observed value versus the expected normal for school leaders whose age was 48 based on their school’s school-wide 2015 SAGE % mathematics proficiency.
Figure J-285. Normal Q-Q Plot of 2015 SAGE % Mathematics Proficiency for Age = 49. This figure illustrates the observed value versus the expected normal for school leaders whose age was 49 based on their school’s school-wide 2015 SAGE % mathematics proficiency.
377
Figure J-286. Normal Q-Q Plot of 2015 SAGE % Mathematics Proficiency for Age = 50. This figure illustrates the observed value versus the expected normal for school leaders whose age was 50 based on their school’s school-wide 2015 SAGE % mathematics proficiency.
Figure J-287. Normal Q-Q Plot of 2015 SAGE % Mathematics Proficiency for Age = 51. This figure illustrates the observed value versus the expected normal for school leaders whose age was 51 based on their school’s school-wide 2015 SAGE % mathematics proficiency.
378
Figure J-288. Normal Q-Q Plot of 2015 SAGE % Mathematics Proficiency for Age = 52. This figure illustrates the observed value versus the expected normal for school leaders whose age was 52 based on their school’s school-wide 2015 SAGE % mathematics proficiency.
Figure J-289. Normal Q-Q Plot of 2015 SAGE % Mathematics Proficiency for Age = 53. This figure illustrates the observed value versus the expected normal for school leaders whose age was 53 based on their school’s school-wide 2015 SAGE % mathematics proficiency.
379
Figure J-290. Normal Q-Q Plot of 2015 SAGE % Mathematics Proficiency for Age = 54. This figure illustrates the observed value versus the expected normal for school leaders whose age was 54 based on their school’s school-wide 2015 SAGE % mathematics proficiency.
Figure J-291. Normal Q-Q Plot of 2015 SAGE % Mathematics Proficiency for Age = 55. This figure illustrates the observed value versus the expected normal for school leaders whose age was 55 based on their school’s school-wide 2015 SAGE % mathematics proficiency.
380
Figure J-292. Normal Q-Q Plot of 2015 SAGE % Mathematics Proficiency for Age = 56. This figure illustrates the observed value versus the expected normal for school leaders whose age was 56 based on their school’s school-wide 2015 SAGE % mathematics proficiency.
Figure J-293. Normal Q-Q Plot of 2015 SAGE % Mathematics Proficiency for Age = 57. This figure illustrates the observed value versus the expected normal for school leaders whose age was 57 based on their school’s school-wide 2015 SAGE % mathematics proficiency.
381
Figure J-294. Normal Q-Q Plot of 2015 SAGE % Mathematics Proficiency for Age = 58. This figure illustrates the observed value versus the expected normal for school leaders whose age was 58 based on their school’s school-wide 2015 SAGE % mathematics proficiency.
Figure J-295. Normal Q-Q Plot of 2015 SAGE % Mathematics Proficiency for Age = 59. This figure illustrates the observed value versus the expected normal for school leaders whose age was 59 based on their school’s school-wide 2015 SAGE % mathematics proficiency.
382
Figure J-296. Normal Q-Q Plot of 2015 SAGE % Mathematics Proficiency for Age = 60. This figure illustrates the observed value versus the expected normal for school leaders whose age was 60 based on their school’s school-wide 2015 SAGE % mathematics proficiency.
Figure J-297. Normal Q-Q Plot of 2015 SAGE % Mathematics Proficiency for Age = 61. This figure illustrates the observed value versus the expected normal for school leaders whose age was 61 based on their school’s school-wide 2015 SAGE % mathematics proficiency.
383
Figure J-298. Normal Q-Q Plot of 2015 SAGE % Mathematics Proficiency for Age = 62. This figure illustrates the observed value versus the expected normal for school leaders whose age was 62 based on their school’s school-wide 2015 SAGE % mathematics proficiency.
Figure J-299. Normal Q-Q Plot of 2015 SAGE % Mathematics Proficiency for Age = 63. This figure illustrates the observed value versus the expected normal for school leaders whose age was 63 based on their school’s school-wide 2015 SAGE % mathematics proficiency.
384
Figure J-300. Normal Q-Q Plot of 2015 SAGE % Mathematics Proficiency for Age = 64. This figure illustrates the observed value versus the expected normal for school leaders whose age was 64 based on their school’s school-wide 2015 SAGE % mathematics proficiency.
Figure J-301. Normal Q-Q Plot of 2015 SAGE % Mathematics Proficiency for Age = 65. This figure illustrates the observed value versus the expected normal for school leaders whose age was 65 based on their school’s school-wide 2015 SAGE % mathematics proficiency.
385
Figure J-302. Boxplot of 2015 SAGE % Mathematics Proficiency for Age. This figure illustrates spread of school-wide 2015 SAGE % Mathematics Proficiency scores based on school leaders’ age.
386 Table J-19 MTL55: Tests for Normality Shapiro-Wilk ───────────── Variable MTL55
Statistic
df
Sig.
Skewness
Std. Error
Kurtosis
Std. Error
3
.94
13
.460
-.38
.62
-.67
1.19
4
.97
58
.235
.05
.31
-.24
.62
5
.93
19
.203
-.27
.52
-1.07
1.01
1 2
Figure J-303. Frequency by 2015 SAGE % Mathematics Proficiency for MTL55 = 2. This figure illustrates the number of school leaders who ranked MTL55 at 2 based on their school’s school-wide 2015 SAGE % mathematics proficiency.
387
Figure J-304. Frequency by 2015 SAGE % Mathematics Proficiency for MTL55 = 3. This figure illustrates the number of school leaders who ranked MTL55 at 3 based on their school’s school-wide 2015 SAGE % mathematics proficiency.
Figure J-305. Frequency by 2015 SAGE % Mathematics Proficiency for MTL55 = 4. This figure illustrates the number of school leaders who ranked MTL55 at 4 based on their school’s school-wide 2015 SAGE % mathematics proficiency.
388
Figure J-306. Frequency by 2015 SAGE % Mathematics Proficiency for MTL55 = 5. This figure illustrates the number of school leaders who ranked MTL55 at 5 based on their school’s school-wide 2015 SAGE % mathematics proficiency.
Figure J-307. Normal Q-Q Plot of 2015 SAGE % Mathematics Proficiency for MTL55 = 2. This figure illustrates the observed value versus the expected normal for school leaders who ranked MTL55 at 2 based on their school’s school-wide 2015 SAGE % mathematics proficiency.
389
Figure J-308. Normal Q-Q Plot of 2015 SAGE % Mathematics Proficiency for MTL55 = 3. This figure illustrates the observed value versus the expected normal for school leaders who ranked MTL55 at 3 based on their school’s school-wide 2015 SAGE % mathematics proficiency.
Figure J-309. Normal Q-Q Plot of 2015 SAGE % Mathematics Proficiency for MTL55 = 4. This figure illustrates the observed value versus the expected normal for school leaders who ranked MTL55 at 4 based on their school’s school-wide 2015 SAGE % mathematics proficiency.
390
Figure J-310. Normal Q-Q Plot of 2015 SAGE % Mathematics Proficiency for MTL55 = 5. This figure illustrates the observed value versus the expected normal for school leaders who ranked MTL55 at 5 based on their school’s school-wide 2015 SAGE % mathematics proficiency.
Figure J-311. Boxplot of 2015 SAGE % Mathematics Proficiency for MTL55. This figure illustrates spread of school-wide 2015 SAGE % Mathematics Proficiency scores based on school leaders’ ranking of MTL55.
391 Table J-20 Gr_T_2: Tests for Normality Shapiro-Wilk ───────────── Variable Gr_T_2
Yes
Statistic .90
df 22
Sig. .029
Skewness -.98
Std. Error .49
Kurtosis 1.73
Std. Error .95
No
.99
127
.542
-.18
.22
-.36
.43
Figure J-312. Frequency by 2015 SAGE % Mathematics Proficiency for Gr_T_2 = Yes. This figure illustrates the number of school leaders who ranked Gr_T_2 at Yes based on their school’s school-wide 2015 SAGE % mathematics proficiency.
392
Figure J-313. Frequency by 2015 SAGE % Mathematics Proficiency for Gr_T_2 = No. This figure illustrates the number of school leaders who ranked Gr_T_2 at No based on their school’s school-wide 2015 SAGE % mathematics proficiency.
Figure J-314. Normal Q-Q Plot of 2015 SAGE % Mathematics Proficiency for Gr_T_2 = Yes. This figure illustrates the observed value versus the expected normal for school leaders who ranked Gr_T_2 at Yes based on their school’s school-wide 2015 SAGE % mathematics proficiency.
393
Figure J-315. Normal Q-Q Plot of 2015 SAGE % Mathematics Proficiency for Gr_T_2 = No. This figure illustrates the observed value versus the expected normal for school leaders who ranked Gr_T_2 at No based on their school’s school-wide 2015 SAGE % mathematics proficiency.
Figure J-316. Boxplot of 2015 SAGE % Mathematics Proficiency for Gr_T_2. This figure illustrates spread of school-wide 2015 SAGE % Mathematics Proficiency scores based on school leaders’ teaching or not teaching 2nd grade.
394 Table J-21 Sub_T_Elec: Tests for Normality Shapiro-Wilk ───────────── Variable Sub_T_ Elec
Yes
Statistic .94
df 5
Sig. .681
No
.99
144
.238
Skewness -1.05 -.30
Std. Error .91
Kurtosis 1.36
.20
.06
Std. Error 2.00 .40
Figure J-317. Frequency by 2015 SAGE % Mathematics Proficiency for Sub_T_Elec = Yes. This figure illustrates the number of school leaders who ranked Sub_T_Elec at Yes based on their school’s school-wide 2015 SAGE % mathematics proficiency.
395
Figure J-318. Frequency by 2015 SAGE % Mathematics Proficiency for Sub_T_Elec = No. This figure illustrates the number of school leaders who ranked Sub_T_Elec at No based on their school’s school-wide 2015 SAGE % mathematics proficiency.
Figure J-319. Normal Q-Q Plot of 2015 SAGE % Mathematics Proficiency for Sub_T_Elec = Yes. This figure illustrates the observed value versus the expected normal for school leaders who ranked Sub_T_Elec at Yes based on their school’s school-wide 2015 SAGE % mathematics proficiency.
396
Figure J-320. Normal Q-Q Plot of 2015 SAGE % Mathematics Proficiency for Sub_T_Elec = No. This figure illustrates the observed value versus the expected normal for school leaders who ranked Sub_T_Elec at No based on their school’s school-wide 2015 SAGE % mathematics proficiency.
Figure J-321. Boxplot of 2015 SAGE % Mathematics Proficiency for Sub_T_Elec. This figure illustrates spread of school-wide 2015 SAGE % Mathematics Proficiency scores based on school leaders’ teaching or not teaching an elective subject.
397 Table J-22 Other_Math: Tests for Normality Shapiro-Wilk ───────────── Variable Other_ No Math Yes, Minor/ Special Emph.
Statistic .99
df 140
Sig. .120
Skewness -.36
Std. Error .21
Kurtosis .13
Std. Error .41
.99
8
.985
-.32
.75
.07
1.48
Figure J-322. Frequency by 2015 SAGE % Mathematics Proficiency for Other_Math = No. This figure illustrates the number of school leaders who ranked Math_Other at No based on their school’s school-wide 2015 SAGE % mathematics proficiency.
398
Figure J-323. Frequency by 2015 SAGE % Mathematics Proficiency for Other_Math = Yes, Minor/Sp.Emphasis. This figure illustrates the number of school leaders who ranked Math_Other at Yes, Minor/Sp. Emphasis based on their school’s school-wide 2015 SAGE % mathematics proficiency.
Figure J-324. Normal Q-Q Plot of 2015 SAGE % Mathematics Proficiency for Sub_T_Elec = No. This figure illustrates the observed value versus the expected normal for school leaders who ranked Sub_T_Elec at No based on their school’s school-wide 2015 SAGE % mathematics proficiency.
399
Figure J-325. Normal Q-Q Plot of 2015 SAGE % Mathematics Proficiency for Sub_T_Elec = Yes, Minor/Sp.Emphasis. This figure illustrates the observed value versus the expected normal for school leaders who ranked Sub_T_Elec at Yes, Minor/Sp.Emphasis based on their school’s school-wide 2015 SAGE % mathematics proficiency.
Figure J-326. Boxplot of 2015 SAGE % Mathematics Proficiency for Other_Math. This figure illustrates spread of school-wide 2015 SAGE % Mathematics Proficiency scores based on school leaders’ having or not having another math degree.
400 Table J-23 Inf_State_Leg2: Tests for Normality Shapiro-Wilk ───────────── Variable Inf_State _Leg2
1
Statistic .94
df 21
Sig. .176
Skewness -.84
Std. Error .50
Kurtosis 1.00
Std. Error .97
2
.97
33
.517
-.42
.41
.86
.80
3
.95
37
.125
-.74
.39
1.13
.76
4
.98
32
.882
.02
.41
-.52
.81
5
.97
17
.747
.42
.55
.06
1.06
6
.93
9
.456
-.34
.72
-1.1
1.4
Figure J-327. Frequency by 2015 SAGE % Mathematics Proficiency for Inf_State_Leg2 = 1. This figure illustrates the number of school leaders who ranked Inf_State_Leg2 at 1 based on their school’s school-wide 2015 SAGE % mathematics proficiency.
401
Figure J-328. Frequency by 2015 SAGE % Mathematics Proficiency for Inf_State_Leg2 = 2. This figure illustrates the number of school leaders who ranked Inf_State_Leg2 at 2 based on their school’s school-wide 2015 SAGE % mathematics proficiency.
Figure J-329. Frequency by 2015 SAGE % Mathematics Proficiency for Inf_State_Leg2 = 3. This figure illustrates the number of school leaders who ranked Inf_State_Leg2 at 3 based on their school’s school-wide 2015 SAGE % mathematics proficiency.
402
Figure J-330. Frequency by 2015 SAGE % Mathematics Proficiency for Inf_State_Leg2 = 4. This figure illustrates the number of school leaders who ranked Inf_State_Leg2 at 4 based on their school’s school-wide 2015 SAGE % mathematics proficiency.
Figure J-331. Frequency by 2015 SAGE % Mathematics Proficiency for Inf_State_Leg2 = 5. This figure illustrates the number of school leaders who ranked Inf_State_Leg2 at 5 based on their school’s school-wide 2015 SAGE % mathematics proficiency.
403
Figure J-332. Frequency by 2015 SAGE % Mathematics Proficiency for Inf_State_Leg2 = 6. This figure illustrates the number of school leaders who ranked Inf_State_Leg2 at 6 based on their school’s school-wide 2015 SAGE % mathematics proficiency.
Figure J-333. Normal Q-Q Plot of 2015 SAGE % Mathematics Proficiency for Inf_State_Leg2 = 1. This figure illustrates the observed value versus the expected normal for school leaders who ranked Inf_State_Leg2 at 1 based on their school’s school-wide 2015 SAGE % mathematics proficiency.
404
Figure J-334. Normal Q-Q Plot of 2015 SAGE % Mathematics Proficiency for Inf_State_Leg2 = 2. This figure illustrates the observed value versus the expected normal for school leaders who ranked Inf_State_Leg2 at 2 based on their school’s school-wide 2015 SAGE % mathematics proficiency.
Figure J-335. Normal Q-Q Plot of 2015 SAGE % Mathematics Proficiency for Inf_State_Leg2 = 3. This figure illustrates the observed value versus the expected normal for school leaders who ranked Inf_State_Leg2 at 3 based on their school’s school-wide 2015 SAGE % mathematics proficiency.
405
Figure J-336. Normal Q-Q Plot of 2015 SAGE % Mathematics Proficiency for Inf_State_Leg2 = 4. This figure illustrates the observed value versus the expected normal for school leaders who ranked Inf_State_Leg2 at 4 based on their school’s school-wide 2015 SAGE % mathematics proficiency.
Figure J-337. Normal Q-Q Plot of 2015 SAGE % Mathematics Proficiency for Inf_State_Leg2 = 5. This figure illustrates the observed value versus the expected normal for school leaders who ranked Inf_State_Leg2 at 5 based on their school’s school-wide 2015 SAGE % mathematics proficiency.
406
Figure J-338. Normal Q-Q Plot of 2015 SAGE % Mathematics Proficiency for Inf_State_Leg2 = 6. This figure illustrates the observed value versus the expected normal for school leaders who ranked Inf_State_Leg2 at 6 based on their school’s school-wide 2015 SAGE % mathematics proficiency.
Figure J-339. Boxplot of 2015 SAGE % Mathematics Proficiency for Inf_State_Leg2. This figure illustrates spread of school-wide 2015 SAGE % Mathematics Proficiency scores based on school leaders’ ranking of Inf_State_Leg2.
407 Table J-24 Sub_T_H_SS: Tests for Normality Shapiro-Wilk ───────────── Variable Sub_T_ H_SS
Yes
Statistic .98
df 82
Sig. .368
Skewness -.39
Std. Error .27
Kurtosis .14
Std. Error .53
No
.98
67
.200
-.29
.29
.32
.58
Figure J-340. Frequency by 2015 SAGE % Mathematics Proficiency for Sub_T_H_SS = Yes. This figure illustrates the number of school leaders who ranked Sub_T_H_SS at Yes based on their school’s school-wide 2015 SAGE % mathematics proficiency.
408
Figure J-341. Frequency by 2015 SAGE % Mathematics Proficiency for Sub_T_H_SS = No. This figure illustrates the number of school leaders who ranked Sub_T_H_SS at No based on their school’s school-wide 2015 SAGE % mathematics proficiency.
Figure J-342. Normal Q-Q Plot of 2015 SAGE % Mathematics Proficiency for Sub_T_H_SS = Yes. This figure illustrates the observed value versus the expected normal for school leaders who ranked Sub_T_H_SS at Yes based on their school’s school-wide 2015 SAGE % mathematics proficiency.
409
Figure J-343. Normal Q-Q Plot of 2015 SAGE % Mathematics Proficiency for Sub_T_H_SS = No. This figure illustrates the observed value versus the expected normal for school leaders who ranked Sub_T_H_SS at No based on their school’s school-wide 2015 SAGE % mathematics proficiency.
Figure J-344. Boxplot of 2015 SAGE % Mathematics Proficiency for Sub_T_H_SS. This figure illustrates spread of school-wide 2015 SAGE % Mathematics Proficiency scores based on school leaders’ teaching or not teaching history/social studies.
410 Table J-25 Saxon_Math: Tests for Normality Shapiro-Wilk ───────────── Variable Saxon_ Math
Yes
Statistic .87
df 6
Sig. .206
Skewness 1.41
Std. Error .85
No
.99
143
.144
-.30
.20
Kurtosis 3.15 .09
Std. Error 1.74 .40
Figure J-345. Frequency by 2015 SAGE % Mathematics Proficiency for Saxon_Math = Yes. This figure illustrates the number of school leaders who ranked Saxon_Math at Yes based on their school’s school-wide 2015 SAGE % mathematics proficiency.
411
Figure J-346. Frequency by 2015 SAGE % Mathematics Proficiency for Saxon_Math = No. This figure illustrates the number of school leaders who ranked Saxon_Math at Yes based on their school’s school-wide 2015 SAGE % mathematics proficiency.
Figure J-347. Normal Q-Q Plot of 2015 SAGE % Mathematics Proficiency for Saxon_Math = Yes. This figure illustrates the observed value versus the expected normal for school leaders who ranked Saxon_Math at Yes based on their school’s school-wide 2015 SAGE % mathematics proficiency.
412
Figure J-348. Normal Q-Q Plot of 2015 SAGE % Mathematics Proficiency for Saxon_Math = No. This figure illustrates the observed value versus the expected normal for school leaders who ranked Saxon_Math at No based on their school’s school-wide 2015 SAGE % mathematics proficiency.
Figure J-349. Boxplot of 2015 SAGE % Mathematics Proficiency for Saxon_Math. This figure illustrates spread of school-wide 2015 SAGE % Mathematics Proficiency scores based on school leaders’ teaching or not teaching history/social studies.
413
Table J-26 Gr_T_K: Tests for Normality Shapiro-Wilk ───────────── Variable Gr_T_K
Yes
Statistic .95
df 9
Sig. .728
Skewness .04
Std. Error .72
Kurtosis 1.56
No
.99
140
.219
-.33
.21
-.01
Std. Error 1.40 .41
Figure J-350. Frequency by 2015 SAGE % Mathematics Proficiency for Gr_T_K = Yes. This figure illustrates the number of school leaders who ranked Gr_T_K at Yes based on their school’s school-wide 2015 SAGE % mathematics proficiency.
414
Figure J-351. Frequency by 2015 SAGE % Mathematics Proficiency for Gr_T_K = No. This figure illustrates the number of school leaders who ranked Gr_T_K at No based on their school’s school-wide 2015 SAGE % mathematics proficiency.
Figure J-352. Normal Q-Q Plot of 2015 SAGE % Mathematics Proficiency for Gr_T_K = Yes. This figure illustrates the observed value versus the expected normal for school leaders who ranked Gr_T_K at Yes based on their school’s school-wide 2015 SAGE % mathematics proficiency.
415
Figure J-353. Normal Q-Q Plot of 2015 SAGE % Mathematics Proficiency for Gr_T_K = No. This figure illustrates the observed value versus the expected normal for school leaders who ranked Gr_T_K at No based on their school’s school-wide 2015 SAGE % mathematics proficiency.
Figure J-354. Boxplot of 2015 SAGE % Mathematics Proficiency for Gr_T_K. This figure illustrates spread of school-wide 2015 SAGE % Mathematics Proficiency scores based on school leaders’ teaching or not teaching kindergarten.
416 Table J-27 MTL36: Tests for Normality Shapiro-Wilk ───────────── Variable MTL36
Statistic
df
Sig.
Skewness
Std. Error
Kurtosis
Std. Error
3
.84
7
.090
.80
.79
3.17
1.59
4
.98
86
.247
-.02
.26
-.44
.51
5
.89
46
.000
-1.36
.35
2.68
.69
1 2
Figure J-355. Frequency by 2015 SAGE % Mathematics Proficiency for MTL36 = 3. This figure illustrates the number of school leaders who ranked MTL36 at 3 based on their school’s school-wide 2015 SAGE % mathematics proficiency.
417
Figure J-356. Frequency by 2015 SAGE % Mathematics Proficiency for MTL36 = 3. This figure illustrates the number of school leaders who ranked MTL36 at 3 based on their school’s school-wide 2015 SAGE % mathematics proficiency.
Figure J-357. Frequency by 2015 SAGE % Mathematics Proficiency for MTL36 = 5. This figure illustrates the number of school leaders who ranked MTL36 at 5 based on their school’s school-wide 2015 SAGE % mathematics proficiency.
418
Figure J-358. Normal Q-Q Plot of 2015 SAGE % Mathematics Proficiency for MTL36 = 3. This figure illustrates the observed value versus the expected normal for school leaders who ranked MTL36 at 3 based on their school’s school-wide 2015 SAGE % mathematics proficiency.
Figure J-359. Normal Q-Q Plot of 2015 SAGE % Mathematics Proficiency for MTL36 = 4. This figure illustrates the observed value versus the expected normal for school leaders who ranked MTL36 at 4 based on their school’s school-wide 2015 SAGE % mathematics proficiency.
419
Figure J-360. Normal Q-Q Plot of 2015 SAGE % Mathematics Proficiency for MTL36 = 5. This figure illustrates the observed value versus the expected normal for school leaders who ranked MTL36 at 5 based on their school’s school-wide 2015 SAGE % mathematics proficiency.
Figure J-361. Boxplot of 2015 SAGE % Mathematics Proficiency for MTL36. This figure illustrates spread of school-wide 2015 SAGE % Mathematics Proficiency scores based on school leaders’ ranking of MTL36.
420 Table J-28 MTL44: Tests for Normality Shapiro-Wilk ───────────── Variable MTL44
1
Statistic .71
df 6
Sig. .008
Skewness 2.10
2
.96
37
.158
-.22
3
.97
30
.645
4
.99
20
5
.77
3
Std. Error .85
Kurtosis 4.52
Std. Error 1.74
.39
-1.02
.76
-.31
.43
.44
.83
.999
-.08
.51
.39
.99
0.04
1.73
1.23
Figure J-362. Frequency by 2015 SAGE % Mathematics Proficiency for MTL44 = 1. This figure illustrates the number of school leaders who ranked MTL44 at 1 based on their school’s school-wide 2015 SAGE % mathematics proficiency.
421
Figure J-363. Frequency by 2015 SAGE % Mathematics Proficiency for MTL44 = 2. This figure illustrates the number of school leaders who ranked MTL44 at 2 based on their school’s school-wide 2015 SAGE % mathematics proficiency.
Figure J-364. Frequency by 2015 SAGE % Mathematics Proficiency for MTL44 = 3. This figure illustrates the number of school leaders who ranked MTL44 at 3 based on their school’s school-wide 2015 SAGE % mathematics proficiency.
422
Figure J-365. Frequency by 2015 SAGE % Mathematics Proficiency for MTL44 = 4. This figure illustrates the number of school leaders who ranked MTL44 at 4 based on their school’s school-wide 2015 SAGE % mathematics proficiency.
Figure J-366. Frequency by 2015 SAGE % Mathematics Proficiency for MTL44 = 5. This figure illustrates the number of school leaders who ranked MTL44 at 5 based on their school’s school-wide 2015 SAGE % mathematics proficiency.
423
Figure J-367. Normal Q-Q Plot of 2015 SAGE % Mathematics Proficiency for MTL44 = 1. This figure illustrates the observed value versus the expected normal for school leaders who ranked MTL44 at 1 based on their school’s school-wide 2015 SAGE % mathematics proficiency.
Figure J-368. Normal Q-Q Plot of 2015 SAGE % Mathematics Proficiency for MTL44 = 2. This figure illustrates the observed value versus the expected normal for school leaders who ranked MTL44 at 2 based on their school’s school-wide 2015 SAGE % mathematics proficiency.
424
Figure J-369. Normal Q-Q Plot of 2015 SAGE % Mathematics Proficiency for MTL44 = 3. This figure illustrates the observed value versus the expected normal for school leaders who ranked MTL44 at 3 based on their school’s school-wide 2015 SAGE % mathematics proficiency.
Figure J-370. Normal Q-Q Plot of 2015 SAGE % Mathematics Proficiency for MTL44 = 4. This figure illustrates the observed value versus the expected normal for school leaders who ranked MTL44 at 4 based on their school’s school-wide 2015 SAGE % mathematics proficiency.
425
Figure J-371. Normal Q-Q Plot of 2015 SAGE % Mathematics Proficiency for MTL44 = 5. This figure illustrates the observed value versus the expected normal for school leaders who ranked MTL44 at 5 based on their school’s school-wide 2015 SAGE % mathematics proficiency.
Figure J-372. Boxplot of 2015 SAGE % Mathematics Proficiency for MTL44. This figure illustrates spread of school-wide 2015 SAGE % Mathematics Proficiency scores based on school leaders’ ranking of MTL44.
426 Table J-29 Coll_Alg: Tests for Normality Shapiro-Wilk ───────────── Variable Coll_Alg
Yes
Statistic .99
df 121
Sig. .426
Skewness -.25
Std. Error .22
Kurtosis -.17
Std. Error .44
No
.96
28
.436
-.45
.44
.79
.86
Figure J-373. Frequency by 2015 SAGE % Mathematics Proficiency for Coll_Alg = Yes. This figure illustrates the number of school leaders who ranked Coll_Alg at Yes based on their school’s school-wide 2015 SAGE % mathematics proficiency.
427
Figure J-374. requency by 2015 SAGE % Mathematics Proficiency for Coll_Alg = No. This figure illustrates the number of school leaders who ranked Coll_Alg at No based on their school’s school-wide 2015 SAGE % mathematics proficiency.
Figure J-375. Normal Q-Q Plot of 2015 SAGE % Mathematics Proficiency for Coll_Alg = Yes. This figure illustrates the observed value versus the expected normal for school leaders who ranked Coll_Alg at Yes based on their school’s school-wide 2015 SAGE % mathematics proficiency.
428
Figure J-376. Normal Q-Q Plot of 2015 SAGE % Mathematics Proficiency for Coll_Alg = No. This figure illustrates the observed value versus the expected normal for school leaders who ranked Coll_Alg at No based on their school’s school-wide 2015 SAGE % mathematics proficiency.
Figure J-377. Boxplot of 2015 SAGE % Mathematics Proficiency for Coll_Alg. This figure illustrates spread of school-wide 2015 SAGE % Mathematics Proficiency scores based on school leaders’ taking or not taking of college algebra.
429 Table J-30 MTL39: Tests for Normality Shapiro-Wilk ───────────── Variable MTL39
Statistic
df
Sig.
Skewness
Std. Error
Kurtosis
Std. Error
2
.91
17
.110
-.47
.55
-1.06
1.06
3
.99
58
.886
-.17
.31
.10
.62
4
.95
41
.048
-.85
.37
.92
.72
5
.96
20
.046
.40
.51
-.80
.99
1
Figure J-378. Frequency by 2015 SAGE % Mathematics Proficiency for MTL39 = 1. This figure illustrates the number of school leaders who ranked MTL44 at 1 based on their school’s school-wide 2015 SAGE % mathematics proficiency.
430
Figure J-379. Frequency by 2015 SAGE % Mathematics Proficiency for MTL39 = 2. This figure illustrates the number of school leaders who ranked MTL44 at 2 based on their school’s school-wide 2015 SAGE % mathematics proficiency.
Figure J-380. Frequency by 2015 SAGE % Mathematics Proficiency for MTL39 = 3. This figure illustrates the number of school leaders who ranked MTL44 at 3 based on their school’s school-wide 2015 SAGE % mathematics proficiency.
431
Figure J-381. Frequency by 2015 SAGE % Mathematics Proficiency for MTL39 = 4. This figure illustrates the number of school leaders who ranked MTL44 at 4 based on their school’s school-wide 2015 SAGE % mathematics proficiency.
Figure J-382. Frequency by 2015 SAGE % Mathematics Proficiency for MTL39 = 5. This figure illustrates the number of school leaders who ranked MTL44 at 5 based on their school’s school-wide 2015 SAGE % mathematics proficiency.
432
Figure J-383. Normal Q-Q Plot of 2015 SAGE % Mathematics Proficiency for MTL39 = 1. This figure illustrates the observed value versus the expected normal for school leaders who ranked MTL39 at 1 based on their school’s school-wide 2015 SAGE % mathematics proficiency.
Figure J-384. Normal Q-Q Plot of 2015 SAGE % Mathematics Proficiency for MTL39 = 2. This figure illustrates the observed value versus the expected normal for school leaders who ranked MTL39 at 2 based on their school’s school-wide 2015 SAGE % mathematics proficiency.
433
Figure J-385. Normal Q-Q Plot of 2015 SAGE % Mathematics Proficiency for MTL39 = 3. This figure illustrates the observed value versus the expected normal for school leaders who ranked MTL39 at 3 based on their school’s school-wide 2015 SAGE % mathematics proficiency.
Figure J-386. Normal Q-Q Plot of 2015 SAGE % Mathematics Proficiency for MTL39 = 4. This figure illustrates the observed value versus the expected normal for school leaders who ranked MTL39 at 4 based on their school’s school-wide 2015 SAGE % mathematics proficiency.
434
Figure J-387. Normal Q-Q Plot of 2015 SAGE % Mathematics Proficiency for MTL39 = 5. This figure illustrates the observed value versus the expected normal for school leaders who ranked MTL39 at 5 based on their school’s school-wide 2015 SAGE % mathematics proficiency.
Figure J-388. Boxplot of 2015 SAGE % Mathematics Proficiency for MTL39. This figure illustrates spread of school-wide 2015 SAGE % Mathematics Proficiency scores based on school leaders’ ranking of MTL39.
435
Appendix K Correlations
.10 .07
-.12
.27** .40** -.07
-.01
-.02
-.10
.15
.12
-.13
.04
.17*
-.16
-.13
.04
.09 -.21** -.11 -.21** -.13 -.29** -.10
.12
.16
.16*
.00
-.04
-.10
-.17
.09
.03
-.21*
-.13
10
11
12
13
14
15
16
17
18
19
20
21
22
23
24
25
26
27
28
29
30
.12
.06
-.07
.08
.20* -.11
.12
.01
.04
.03
.05
.04 .01 .03
31
.02
.08
.09
.08
.00
-.03 -.13
.21*
-.03
.02
.09
.01
.01
.39**
.06
-.02 .27** .09 .11 .10 .13 .17* -.03 -.14 .24** -.14 a See next page for descriptions of each variable. * Correlation is significant at the 0.05 level (2-tailed). ** Correlation is significant at the 0.01 level (2-tailed).
.08 -.08
.07 -.05
.07 -.07
-.07
.15 .18*
.15
-
.19 -.08
.12
-.12
.08
-
17
.00 -.03
.10
.00
.08
.09 -.12
.21* .24** .21* -.15
.22**
-.05
-.08
.25**
-.17*
.18* .05
-.01 -.02 -.02 -.07
.00 -.02
.13
-.02 -.10
.05
.01 -.08
-.14
.03 -.08 .38** -.13 -.02
-.02
-.12 -.12
.21 .10 -.03
.07 .22**
.02
.10
-.12 -.21* -.06 .24** -.31**
.08
.06 -.07
.04 -.02
.01 -.10
-
16
.18* .21** .25** -.10 -.03
-.11
.03
.06
-.04 -.09
.08 -.28**
-.04 .04
.12 .20*
-.03
.18
.14
15
-.12 -.12 -.15
.18*
14
-.01 .25** .32**
.01
.09
.13
-.01 .27**
.03
-
13
.20* .67**
-.08
.02
.09 -.08
.09 -.01
.09 -.02
.10
.06
.14
.09 -.08
.04
-.07
.01
.04
.04
.01
.00
.08
-.10 -.07 -.16
.05
.03 -.02 -.18
.02 -.17* -.19* .19* -.09
.04
.18*
.01
.00
.23**
-.11
.10
-.08
.20*
.09
.07
.02
.42**
.16
-.09
-.10
.07
.03
.12* -.05
.19* -.06
.17* -.03
.06 -.12 -.06 .41**
.04
12
.03 -.18*
.11
.24*
-.14
-.09
.15 -.04 .22**
.07 -.04
-.01 -.06 -.18* .40**
.07
.11
11
.19
.09
.15
.21* .22*
-.14
.11
.18*
-.04
-.04
.01
.03
-.04
-.17
.06
.11
.11
.00
.06
-.06
-
.00 -.02 -.15
-.07
10
.10
.04
.11
.06
.06
-.03
.14
9
-.01
-.06
.05
-.03
.10
.21**
.05
-.01
.07
.06
.11
-.07 .33**
-.03
-.03 .12
-.05
.19
.06
.10
.15
-.03
.14
-.03
-.09
.23**
.09
.11
-.09
.07
.09
.09
.87** .32** .09
.03
.54** .35**
.16
.02
.05
.21**
.06
.15
.03
.11
.39** .23** -.01
-.05 -.05
.07
.15 .03
.02
-.15
.25* .04
.00
9
-.11
.12 .02
.03
8
.14
.10
.02
-.21**
.10
7
.00 .80**
.07
.14
.14
-.01
-.14
.04
.14
.31**
6 -
8
-.18 -
7
5 -
6
-.11 -
5
4
-
4
.11 -
3
.08
-
2
3
-
1
2
1
Variablea
-
19
-
20
-.06
-.04
.00
.20
.02
.03
.09
.10
.09
.19
.10
.08
.08
.11
-.09
-.06
-.01
.15
-.05
.07
-.09
-.04
.12
.17
-.05
.01
-.20
-.01
.11
-.08
-.17 -.19* -.29**
.36** .25*
.06
-
18
-.04
-.13
.18*
.05
-
22
.00
.01
.14 -.03
-
27
-
28
.06
.00
-
29
-
30 31
.00 .22** -.06 -.15 -
.04 -.09 -.07
.06 -.21*
.00 -.08
.06 -.06
.09
26
.05 .30** -.04 -.02
.08 -.17*
.06 -.03
.06
25
-.01 -.06 -.10 -.02
-.12
-
24
.18 -.01
.03
-
23
-.18* -.05 -.05
-.03
.09
-.36** -.07
.29** -.04
-.01
.12
.03
.11
-.08
-
21
Correlations Among the 30 Most Important Variables and the Independent Variable to Be Used in the Network Analysis
Table K-1
436
437 Table K.2 Key to Table K-1 Variable abbreviation
Description
1. 2015 SAGE mathematics % proficiency
School-wide average mathematics proficiency score of each school
2. ISAM18
School leader agreement with this statement: “The best way to increase student achievement in mathematics is to educate members of the legislature on the curriculum and research-based instructional strategies.”
3. ISAM12
School leader agreement with this statement: “The best way to increase student achievement in mathematics is to provide teacher/aide tutoring for students.”
4. Yrs_Last_Teach_Pos
Number of years the school leader was in their last teaching position.
5. MTL64
School leader agreement with this statement: “Discussion of mathematics (mathematical discourse) should be used at least 50% of the time in the 10-12 mathematics classroom.”
6. Tot_Yrs_Teach
Numbers of years the school leader taught in some capacity.
7. Inf_Teach3
School leader perception of the amount of influence of teachers over the instructional methods used in the mathematics classroom at their school.
8. Math_Ed
School leader earned a major, minor, or special emphasis in mathematics education
9. MTL12
School leader agreement with this statement: “The use of calculators in early grades impedes the development of automaticity with basic facts.”
10. ISAM3
School leader agreement with this statement: “The best way to increase student achievement in mathematics is to work with university researchers in a collaborative professional development.”
11. MTL35
School leader agreement with this statement: “In grades K-9, mathematics instruction should be teacher directed more than 50% of the time.”
12. Inf_Nat_Org2
School leader perception of the amount of influence of national organizations such as NCTM over the implementation of the mathematics curriculum at your school.
13. ISAM16
School leader agreement with this statement: “The best way to increase student achievement in mathematics is to educate parents on the curriculum and research-based instructional strategies.”
14. ISAM17
School leader agreement with this statement: “The best way to increase student achievement in mathematics is to educate board members on the curriculum and research-based instructional strategies.
15. Fam_PD_CI_Doc
Amount of school leader familiarity with professional development/materials/readings in mathematics curriculum and instruction.
(table continues)
438 Variable abbreviation
Description
16. Sec_Ed
School leader earned a major, minor, or special emphasis in secondary education.
17. ISAM13
School leader agreement with this statement: “The best way to increase student achievement in mathematics is to provide appropriate Tier II and Tier III instruction for students.”
18. MTL62
School leader agreement with this statement: “In 10-12, certain aspects of geometry and measurement are critical foundations of algebra.”
19. Age
School leader age
20. MTL55
School leader agreement with this statement: “In 10-12, explicit instruction for students who struggle in math is effective in increasing student performance with word problems and computation.”
21. Gr_T_2
School leader taught second grade at some point in their teaching career.
22. Sub_T_Elec
School leader taught elective subjects at some point in their teaching career.
23. Other_Math
School leader earned a major, minor, or special emphasis in some other mathematics related field.
24. Inf_State_Leg2
School leader perception of the amount of influence of the state legislature over the implementation of mathematics curriculum at your school.
25. Sub_T_H_SS
School leader taught history/social studies at some point in their teaching career.
26. Saxon_Math
The school uses Saxon Math curriculum resources as part of their mathematics program.
27. Gr_T_K
School leader taught kindergarten at some point in their teaching career.
28. MTL36
School leader agreement with this statement: “In grades K-9, questioning should be an important instructional practice in the mathematics classroom.”
29. MTL44
School leader agreement with this statement: “Rote practice (drill) should be an important instructional practice in the 10-12 mathematics classroom.”
30. Coll_Alg
School leader took college algebra.
31. MTL39
School leader agreement with this statement: “Cooperative work should be the primary instructional practice in the K-9 mathematics classroom.”
439
Appendix L Descriptive Statistics
440 Table L-1 Descriptive Statistics of Top 30 Most Important Characteristics of School Leader Variables in Order of Importance in Predicting a School-wide Average 2015 SAGE Mathematics Proficiency Score Variable
N
Range
Min.
Max.
M
SD
Descriptions of measure
ISAM18
151
4
1
5
3.24
1.08
1. Strongly Disagree 2. Disagree 3. Neutral 4. Agree 5. Strongly Agree
ISAM12
151
4
1
5
3.70
0.84
1. Strongly Disagree 2. Disagree 3. Neutral 4. Agree 5. Strongly Agree
Yrs_Last_Teach_Pos
158
24
0
24
8.33
5.31
MTL64
93
4
1
5
3.39
0.82
Tot_Yrs_Teach
157
43
0
43
11.91
7.60
Inf_Teach3
158
3
3
6
5.73
0.53
1. No Influence 2. Very small influence 3. Small Influence 4. Moderate Influence 5. Strong Influence 6. Very strong influence
Math_Ed
158
2
1
3
1.15
0.42
1. No 2. Yes, Minor/Sp. Emphasis 3. Yes, Major
MTL12
156
4
1
5
2.84
1.01
1. Strongly Disagree 2. Disagree 3. Neutral 4. Agree 5. Strongly Agree
ISAM3
152
4
1
5
3.73
0.87
1. Strongly Disagree 2. Disagree 3. Neutral 4. Agree 5. Strongly Agree
MTL35
144
4
1
5
2.80
0.94
1. Strongly Disagree 2. Disagree 3. Neutral 4. Agree 5. Strongly Agree
Inf_Nat_Org2
158
5
1
6
2.70
1.40
1. No Influence 2. Very small influence 3. Small Influence 4. Moderate Influence 5. Strong Influence 6. Very strong influence
ISAM16
151
4
1
5
3.39
0.89
1. Strongly Disagree 2. Disagree 3. Neutral 4. Agree 5. Strongly Agree
ISAM17
151
4
1
5
3.25
0.97
1. Strongly Disagree 2. Disagree 3. Neutral 4. Agree 5. Strongly Agree
1. Strongly Disagree 2. Disagree 3. Neutral 4. Agree 5. Strongly Agree
(table continues)
441 Variable
N
Range
Min.
Max.
M
SD
Descriptions of measure
Fam_PD_CI_Doc
156
5
1
6
3.76
1.25
1. Not familiar 2. Vaguely Familiar 3. Somewhat Familiar 4. Moderately Familiar 5. Mostly Familiar 6. Strongly Familiar
Sec_Ed
158
2
1
3
1.59
0.85
1. No 2. Yes, Minor/Sp. Emphasis 3. Yes, Major
ISAM13
152
3
2
5
4.34
0.61
1. Strongly Disagree 2. Disagree 3. Neutral 4. Agree 5. Strongly Agree
MTL62
94
3
2
5
3.82
0.55
1. Strongly Disagree 2. Disagree 3. Neutral 4. Agree 5. Strongly Agree
Age
156
37
30
67
49.11
8.32
MTL55
97
3
2
5
4.01
0.70
1. Strongly Disagree 2. Disagree 3. Neutral 4. Agree 5. Strongly Agree
Gr_T_2
158
1
1
2
1.85
0.35
1. Yes 2. No
Sub_T_Elec
158
1
1
2
1.97
0.18
1. Yes 2. No
Other_Math
158
2
1
3
1.07
0.28
1. No 2. Yes, Minor/Sp. Emphasis 3. Yes, Major
Inf_State_Leg2
158
5
1
6
3.11
1.40
1. No Influence 2. Very small influence 3. Small Influence 4. Moderate Influence 5. Strong Influence 6. Very strong influence
Sub_T_H_SS
158
1
1
2
1.45
0.50
1. Yes 2. No
Saxon_Math
158
1
1
2
1.95
0.22
1. Yes 2. No
Gr_T_K
158
1
1
2
1.94
0.23
1. Yes 2. No
MTL36
146
2
3
5
4.27
0.54
1. Strongly Disagree 2. Disagree 3. Neutral 4. Agree 5. Strongly Agree
MTL44
101
5
1
6
2.78
1.04
1. Strongly Disagree 2. Disagree 3. Neutral 4. Agree 5. Strongly Agree
Coll_Alg
158
1
1
2
1.19
0.40
1. Yes 2. No
MTL39
145
4
1
5
3.45
0.93
1. Strongly Disagree 2. Disagree 3. Neutral 4. Agree 5. Strongly Agree
442
Appendix M Multicollinearity Diagnostics
443 Table M-1 Coefficients Variable
Tolerance statistics
VIF
ISAM18
.138
7.272
ISAM12
.363
2.754
Yrs_Last_Teach_Pos
.219
4.557
MTL64
.545
1.834
Tot_Yrs_Teach
.178
5.604
Inf_Teach3
.472
2.118
Math_Ed
.571
1.750
MTL12
.633
1.579
ISAM3
.479
2.090
MTL35
.608
1.645
Inf_Nat_Org2
.423
2.366
ISAM16
.353
2.830
ISAM17
.108
9.251
Fam_PD_CI_Doc
.519
1.925
Sec_Ed
.480
2.085
ISAM13
.450
2.220
MTL62
.520
1.921
Age
.420
2.379
MTL55
.386
2.594
Gr_T_2
.302
3.308
Sub_T_Elec
.505
1.981
Other_Math
.654
1.529
Inf_State_Leg2
.337
2.970
Sub_T_H_SS
.567
1.763
Saxon_Math
.790
1.267
Gr_T_K
.559
1.790
MTL36
.563
1.776
MTL44
.584
1.711
Coll_Alg
0.623
1.605
MTL39
0.569
1.758
444 Table M.2 Eigenvalues Dimension
Eigenvalue
1
28.600
2
0.536
3
0.322
4
0.260
5
0.187
6
0.161
7
0.124
8
0.109
9
0.089
10
0.082
11
0.076
12
0.069
13
0.056
14
0.051
15
0.041
16
0.040
17
0.033
18
0.029
19
0.024
20
0.020
21
0.018
22
0.014
23
0.011
24
0.010
25
0.009
26
0.007
27
0.006
28
0.006
29
0.004
30
0.002
31
0.001
445 CURRICULUM VITAE
EMMA KATHLEEN PRICE BULLOCK Business Address: Utah State University College of Education & Human Services 2805 Old Main Hill Logan, UT 84321 (801) 808-6985 Email:
[email protected] Email:
[email protected]
Home Address: 135 W. 280 N. Providence, UT 84332
EDUCATION Ph.D.
May 2017 Education: Utah State University Specialization: Curriculum and Instruction Concentration: Mathematics Education and Leadership Dissertation: An Explanatory Sequential Mixed Methods Study of the School Leaders’ Role in Students’ Mathematics Achievement Through the Lens of Complexity Theory
M.M.
December 2016 Mathematics: Utah State University
M.Ed.
May 2010 Master of Education in Educational Leadership, Argosy University. Utah Professional Administrative License, K-12 (2011)
B.S.
April 2001 Mathematics with an Emphasis in Combinatorics Music with an Emphasis in Vocal Performance, Brigham Young University. Utah Professional Teaching Level I License, 6-12 with a Math Level IV endorsement (2001). Utah Professional Teaching Level II License, 6-12 with a Math Level IV endorsement (2007)
EMPLOYMENT HISTORY Sam Houston State University Assistant Professor, Mathematics Education (August 2017) Sam Houston State University, Department of Mathematics and Statistics, College of Science and Engineering Technology, Huntsville, TX Responsibilities will include teaching graduate and undergraduate courses in Mathematics Education (Elementary and Secondary) and Mathematics courses (such as Linear Algebra, etc.); assisting in the development and implementation of programs for students; advising students; supervising graduate assistants, and developing a professional agenda of teaching, citizenship, and scholarship within the university community.
446
Utah State University Graduate Research and Teaching Assistant (2013-present) Utah State University, College of Education & Human Services, Logan, UT Research responsibilities include assisting professors on various research projects in mathematics education such as fulfilling the role of project coordinator (i.e. all participant recruitment and interview scheduling), development of interview protocols and other relevant documentation such as demographic/parent surveys, informed consent and parent information sheets, interviewing participants, coding video observations of participant actions, performing all levels of quantitative and qualitative data analysis, and participating in group papers and presentations. Virtual Manipulatives Database, manager (2015-present), which includes the following: (a) Maintain research database and review of articles for inclusion therein; (b) Develop and organize review and coding procedures for contributors Teaching assistant responsibilities include teaching the Level III undergraduate mathematics methods course, supervising Level III practicum student teachers, collaborating with Edith Bowen Laboratory School teachers, and creating and teaching master’s level elementary endorsement courses (i.e. Geometry and Measurement, Algebraic Reasoning, modules for the Elementary Mathematics Teachers Academy (EMTA)). These include face-to-face, distance broadcast, online, and hybrid classroom settings.
EDUCATIONAL LEADERSHIP/ADMINISTRATIVE EXPERIENCE Mountainville Academy Executive Director/Superintendent (2013-2014). K-9 Utah Public Charter School, Alpine, Utah As executive director/superintendent, responsibilities include supervising all aspects of school operation, achieving the school’s mission of building leaders’, one student at a time, through personal and academic excellence, overseeing the entire academic program, professional development of staff, managing the school’s public relations efforts with the broader community, and ensuring legal compliance with public education laws and regulations. As the mathematics coordinator, responsibilities include initially assessing and placing all students, K-9, into appropriate math groups, managing movement between the groups based on data, throughout the school year, planning and conducting mathematics professional development for all math teachers, K-9, providing coaching, curriculum planning and ensuring the appropriate resources are available for students and teachers. Administrative Director/Principal (2009-2013). Mathematics Coordinator K-9 (2006-2014) K-9 Utah Public Charter School, Alpine, Utah As administrative director, responsibilities include supervising all aspects of school operation, achieving the school’s mission of building leaders’, one student at a time, through personal and academic excellence, overseeing the entire academic program, training and motivating all staff, managing the school’s public relations efforts with students, parents, and the broader community, and ensuring legal compliance with public education laws and regulations. As the mathematics coordinator, responsibilities include initially assessing and placing all students, K-9, into appropriate math groups, managing movement between the groups based on data, throughout the school year, planning and conducting mathematics professional development for all math teachers, K-9, providing coaching, curriculum planning and ensuring the appropriate resources are available for students and teachers.
447 PUBLIC SCHOOL TEACHING EXPERIENCE Mountainville Academy Teacher, Pre-Calculus, Algebra II, Algebra I, Pre-Algebra, 7th grade math, 6th grade math, 5th grade math (2006-2009). Middle School Department Chair/Lead Teacher (2008-2009) Mentor Teacher (2009-2014) K-8 Utah Public Charter School, Alpine, Utah Responsibilities included teaching classes in accordance with Utah professional teaching and mathematics standards, acting as the liaison between the middle school teachers and administration, conducting middle school team meetings, as needed, working with other teachers in various disciplines to coordinate and integrate curriculum and logistical needs, and any other duties, as required.
Georgetown High School Teacher, Algebra II Honors, Algebra II, Math Tech I, Student Council (2005-2006). Georgetown School District, Georgetown, South Carolina Responsibilities included teaching classes in accordance with South Carolina professional teaching and mathematics standards, acting as the advisor for the student counsel, and any other duties, as required.
John Hancock Charter School Teacher, Algebra II, Algebra I, Pre-Algebra, 8th grade Integrated Science, 7th grade Integrated Science, 6th grade Integrated Science, 7th-8th Choir, Student Council (2003-2005). K-8 Utah Public Charter School, Pleasant Grove, Utah Responsibilities included teaching classes in accordance with Utah professional teaching, mathematics, science, and music standards, acting as the advisor for the student counsel, and any other duties, as required.
Payson Junior High School Internship, Teacher, Algebra I, Pre-Algebra, Music Director for after school production of “Bye, Bye Birdie” (2000-2001). Nebo School District, Payson, Utah Responsibilities included teaching classes in accordance with Utah professional teaching and mathematics standards, acting as the music director for the after school musical production, and any other duties, as required.
AWARDS & PROFESSIONAL RECOGNITION
2017 Sherrie Reynolds Scholarship Award, Chaos and Complexity Theory SIG, AERA. (2017).
2016 Graduate Researcher of the Year, School of Teacher Education and Leadership (TEAL). (201516).
2016-17 Frederick Q. Lawson Fellowship Award. (2016-17).
2016-17 School of Graduate Studies Dissertation Fellowship Award. (2016-17).
448
Graduate Student Senate Enhancement Award. (2016-17).
Graduate Research and Creative Opportunities Grant Award. (2016).
Division A Senior Graduate Representative, American Education Research Association (AERA). (2016-2017).
Division A Junior Graduate Representative, American Education Research Association (AERA). (2015-2016).
Graduate Research and Teaching Assistant, Utah State University. (2013-present).
2013 National Promising Practice Award, LLS Learning and Leadership Strategies, as Principal of the Mountainville Academy, Character Education Partnership (2013). 2012-present Principal of the National School of Character, Mountainville Academy. Character Education Partnership (2012).
2012 National Promising Practice Award, Leadership Day, as Principal of the Mountainville Academy. Character Education Partnership (2012).
2011-13 Principal of the State School of Character, Mountainville Academy, Eunice Kennedy Shriver National Center for Community of Caring (2011).
2011-2014 Principal of the Lighthouse School Designation, Mountainville Academy, Franklin Covey (2011).
2011 Utah State Promising Practice Award, Legacy Hour, as Principal of Mountainville Academy, Eunice Kennedy Shriver National Center for Community of Caring (2011).
2011 Red Robin School of Merit, as Principal of the Mountainville Academy for random acts of service. Red Robin, Corp. (2011).
2011 and 2009 Honorable Mention—PTL Magazine as Principal of the Mountainville Academy for Mountainville’s Family School Organization (FSO), (2009; 2011).
2010 Innovating Practice Award, as Principal of the Mountainville Academy for Different Abilities Day, George Eunice Kennedy Shriver National Center for Community of Caring (2010).
2010 Charter School Innovations Excellence Award as Principal of the Mountainville Academy, Utah Association of Public Charter Schools (2010).
2010 Leader in Me School Designation as Principal of the Mountainville Academy Franklin Covey (2010).
2009 State Math Contest—2nd place 8th grade Team as Math Teacher/Principal of the Mountainville Academy.
RESEARCH PROJECTS Affordances of Virtual Manipulatives Touch-Screen Apps for Mathematics Learning. (2016-2018). Project Coordinator. Utah State University. (with PI Dr. Patricia Moyer-Packenham and the Virtual Manipulative
449 Research Group). My roll: Responsible for all participant recruitment and interview scheduling. Participating in all aspects of project development, implementation, analysis and publication of results including data collection, coding of data, and both qualitative and quantitative analysis. GreenWood Charter School: Growing GreenWood Teachers’ Mathematics Pedagogical Content Knowledge Through Action Research in the Classroom. (2015-2018). Program Director/Coordinator. Action research collaboration between Utah State University and GreenWood Charter School in Harrisville, UT. My roll: Oversee and develop all on-site professional development and support of teachers, coordinate all research support for teacher publications and presentations, manage day to day budget and operations. Captivated! Young Children’s Learning Interactions with iPad Mathematics Apps. (2013-2015). Code video observations of participant actions and find emerging themes and data analysis. Utah State University (with PI Dr. Patricia Moyer-Packenham and the Virtual Manipulatives Research Group). My roll: Quantitative analysis for affordances across apps, oversee and participate in qualitative analysis for affordances across apps. Lead author of preschool papers on affordances across apps, second author over analysis of data and major portions (methods/results/discussion) of across grade papers on affordances across apps. Conference presentation preparation.
PUBLICATIONS Journal Articles (Refereed) Bullock, E. P., Shumway, J. F., Watts, C., Moyer-Packenham, P. S. (2017). Affordance Access Matters: Preschool Children’s Learning Progressions While Interacting with Touch-Screen Mathematics Apps. Technology, Knowledge and Learning. Doi: 10.1007/s10758-017-9312-5 Moyer-Packenham, P. S., Bullock, E. P., Shumway, J. F., Tucker, S. I., Watts, C., Westenskow, A., Anderson-Pence, K. L., Maahs-Fladung, C., Boyer-Thurgood, J., Gulkilik, H., & Jordan, K. (2016). The role of affordances in children’s learning performance and efficiency when using virtual manipulative mathematics touch-screen apps. Mathematics Education Research Journal, 28(1), 1-27. Doi: 10-1007/s13394-015-0161-z Moyer-Packenham, P. S., Watts, C., Tucker, S. I., Bullock, E.P., Shumway, J. F., Westenskow, A., BoyerThurgood, J. M., Anderson-Pence, K. L., Mahamane, S., Jordan, K. (2016). An Examination of Children’s Learning Progression Shifts While Using Touch Screen Virtual Manipulatives Apps. Computers in Human Behavior, 64, 814-828. Bullock, E. P., Ashby, M.J., Spencer, B., Manderino, K., Myers, K. (2015). Saxon math in the middle grades: A content analysis. International Journal of Learning, Teaching, and Educational Research, 14 (1), 63-96. Bullock, E. P., Kidd. J., O’Driscoll, T., Reid, A. (2015). Bridging research and practice: Growing greenwood elementary teachers’ mathematics pedagogical content knowledge through action research in the classroom: The beginning. Utah Mathematics Teacher, 8, 40-45. Moyer-Packenham, P. S., Shumway, J. F., Bullock, E., Tucker, S. I., Anderson-Pence, K. L., Westenskow, A., Boyer-Thurgood, J., Maahs-Fladung, C., Symanzik, J., Mahamane, S., MacDonald, B., & Jordan, K. (2015). Young children’s learning performance and efficiency when using virtual manipulative mathematics iPad apps. Journal of Computers in Mathematics and Science Teaching, 34(1), 41-69.
450 Journal Articles (Invited) Bullock, E. (2014). Using the new SAGE assessment to increase student performance. Charterology, 4(1), 24-25. Conference Proceedings (Refereed) Bullock, E. P., Moyer-Packenham, P. S., Shumway, J. F., Watts, C., MacDonald, B. (2015, March). Effective teaching with technology: Managing affordances in iPad apps to promote young children’s mathematics learning. In D. Rutledge & D. Slykhuis (Eds.), Proceedings of the Society for Information Technology and Teacher Education International Conference (pp. 2357-2364), Las Vegas, Nevada. Moyer-Packenham, P. S., Westenskow, A., Shumway, J. F., Bullock, E., Tucker, S. I., Anderson-Pence, K. L., Boyer-Thurgood, J., Maahs-Fladung, C., Symanzik, J., Mahamane, S., MacDonald, B., & Jordan, K., The Virtual Manipulatives Research Group at Utah State University. (2014, September). The effects of different virtual manipulatives for second graders’ mathematics learning in the touch-screen environment. Proceedings of the 12th International Conference of the Mathematics Education into the 21st Century Project, (Vol. 1, p. 1-6). Herceg Novi, Montenegro. Boyer-Thurgood, J., Moyer-Packenham, P., Tucker, S., Anderson, K., Shumway, J., Westenskow, A., & Bullock, E. (2014, January). Kindergartener’s Strategy Development during Combining Tasks on the iPad. Proceedings of the 12th Annual Hawaii International Conference on Education (HICE), (pp. 1113-1114), Honolulu, Hawaii, ISSN# 1541-5880.
Moyer-Packenham, P. S., Anderson, K. L., Shumway, J. F., Tucker, S., Westenskow, A., Boyer-Thurgood, J., Bullock, E., Mahamane, S., Baker, J., Gulkilik, H., Maahs-Fladung, C., Symanzik, J., & Jordan, K., The Virtual Manipulatives Research Group at Utah State University. (2014, January). Developing research tools for young children’s interactions with mathematics apps on the iPad. Proceedings of the 12thAnnual Hawaii International Conference on Education (HICE), (pp. 1685-1694), Honolulu, Hawaii, ISSN# 1541-5880.
Tucker, S. I., Moyer-Packenham, P. S., Boyer-Thurgood, J. M., Anderson, K. L., Shumway, J. F., Westenskow, A., & Bullock, E., The Virtual Manipulatives Research Group at Utah State University. (2014, January). Literature supporting investigations of the nexus of mathematics, strategy, and technology in children’s interactions with iPad-based virtual manipulatives. Proceedings of the 12th Annual Hawaii International Conference on Education (HICE), (pp. 2338-2346), Honolulu, Hawaii, ISSN# 1541-5880. Other Publications Moyer-Packenham, P. S., Shumway, J. F., Bullock, E., Tucker, S. I., Anderson-Pence, K., Westenskow, A., Boyer-Thurgood, J., Maahs-Fladung, C., Symanzik, J., Mahamane, S., MacDonald, B., & Jordan, K., The Virtual Manipulatives Research Group at Utah State University. (2014, April). Young children’s learning performance and efficiency when using virtual manipulative mathematics iPad apps. Paper presented at the annual National Council of Teachers of Mathematics Research Conference (NCTM-R), New Orleans, Louisiana. Accepted with Revisions Moyer-Packenham, P.S., Litster, K., Bullock, E., Shumway, J.F. (under review, 2017). Using Video Analysis to Explain How Virtual Manipulative App Alignment Affects Children’s Mathematics Performance and Efficiency. TSG 41 monograph. Unpublished manuscript.
451 Revise and Resubmit Bartholomew, S., Nadelson, L.S., Bullock, E.P. (revise and resubmit, 2017). A Route Less Traveled: Principals’ Perceptions of Alternative Licensed CTE Teachers. Career and Technical Education Research. Unpublished manuscript. In Progress Bullock, E. P. (in progress). Teaching the Teachers: An International Literature Review on Effective Professional Development in Mathematical Discourse Through the Lens of Complexity Theory. Unpublished manuscript.
UNIVERSITY TEACHING Utah State University, Logan, Utah (2013-present) College of Education and Human Services Course Taught-Utah State University TEAL 6523/TEPD 5523—Mathematics for Teaching K-8: Algebraic Reasoning Graduate Course. Provides practicing teachers with a deeper understanding of algebraic expressions, equations, functions, real numbers and instructional strategies to facilitate the instruction of this content for elementary students. TEAL 6524/TEPD 5524/EMTH 5060—Mathematics for Teaching K-8: Geometry & Measurement Graduate Course. Provides practicing teachers with an in-depth understanding of measurement and geometry content correlated with the state core curriculum, and instructional strategies that facilitate the teaching of this content. Blended Format. ELED 4060—Teaching Mathematics and Practicum Level III Undergraduate Course. Relevant mathematics instruction in the elementary and middle-level curriculum; methods of instruction, evaluation, remediation, and enrichment. Included the six-week supervision of Level III practicum students in participating public school settings. Traditional Format.
CURRICULUM DEVELOPMENT
Utah State University, Logan, Utah (2013-present) Elementary Mathematics Teacher Academy - Developed course materials for master’s level courses for Utah State University’s Elementary Mathematics Teacher Academy (EMTA). Course designed to develop teachers’ mathematical knowledge for teaching aligned with the Common Core State Standards for Mathematics. Materials developed included readings, video lectures, application assignments, and assessments for online course delivery. Developed the following fourth-grade curriculum modules (with more in progress regarding mathematical practices): 4.G.A.1 (2015) 4.G.A.2 4.G.A.3 4.G.Big Idea
Drawing Points, Lines, and Angles and Identifying Them in Two-Dimensional Figures
4.OA.Big Idea
Arithmetic as a Context for Algebraic Thinking (2014)
Classifying Two-Dimensional Figures (2015) Lines of Symmetry (2015) Classifying Properties of Objects: Conjecturing, Solving, Explaining, and Proving (2015)
452 TEAL 6523/TEPD 5523/EMTH 5050—Mathematics for Teaching K-8: Algebraic Reasoning (2016) Taught the course in a blended interactive broadcast hybrid format, used feedback to create completely online course containing 9 modules which include video presentations, slides, readings, learning activities, solutions to worked out problems, discussions, homework help and assessments. Available now through Utah State University’s Elementary Mathematics Teacher Academy (EMTA) as an online course every term. TEAL 6524/TEPD 5524/EMTH 5060—Mathematics for Teaching K-8: Geometry & Measurement (2015) Taught the course in a blended interactive broadcast hybrid format, used feedback to create completely online course containing 9 modules which include video presentations, slides, readings, learning activities, solutions to worked out problems, discussions, homework help and assessments. Available now through Utah State University’s Elementary Mathematics Teacher Academy (EMTA) as an online course every term.
PAID CONSULTANCY Greenwood Charter School, Harrisville, Utah (2015-2018) Providing professional development services in K-6 elementary mathematics education for Greenwood charter comprising 22 K-6 teachers. Professional development includes mathematics content knowledge and pedagogical content knowledge in the areas of numbers & operations, rational numbers & proportional reasoning, and geometry and measurement. In addition, the project includes professional development in action research, lesson study, and support for teacher lead publications and local, state, and national conference presentations. Western Governors University, Salt Lake City, Utah (2013-2014) Online Teachers College Supervised administrative intern, Lisa Panek, as part of her Educational Leadership endorsement program.
GRANTS FUNDED (Over $155,000 Dollars in Total Grant Funding) Sherrie Reynolds Scholarship Award (Chaos and Complexity Theory SIG) ($500). Best Graduate Student Paper Presentation. (2017) American Educational Research Association (AERA) Travel Grant, School of Teacher Education and Leadership (TEAL) ($800). Presentations and Leadership Role at 101st American Educational Research Association (AERA) Conference. (2017) Utah State University. Graduate Student Travel Award, Office of Research and Graduate Studies ($300). Presentations and Leadership Role at 101st American Educational Research Association (AERA) Conference. (2017) Utah State University. Frederick Q. Lawson Fellowship Award ($9000). Emma Eccles Jones College of Education and Human Services. (2016-2017). Utah State University. School of Graduate Studies Dissertation Fellowship Award ($5000). Dissertation Funding. (20162017). Utah State University. Graduate Student Senate Enhancement Award ($4000). Utah State University Student Association (USUSA). (2016-2017). Utah State University.
453 Graduate Research and Creative Opportunities (GRCO) Grant ($1000). Utah State University Student Association (USUSA) Dissertation Funding. (2016). Utah State University. Graduate Research Assistant ($68,000). Captivated! Young Children’s Learning Interactions with iPad Mathematics Apps. (2013-2017). Utah State University. Project Goal: build theory and knowledge about the nature of young children’s ways of thinking and interacting with virtual manipulatives using touchscreen mathematics apps on the ipad. My role: code video observations of participant actions and find emerging themes. (with Principal Investigator Patricia Moyer-Packenham, Co-PI Cathy Maahs-Fladung, and the Virtual Manipulatives Research Group). Division A Senior Graduate Representative (AERA) ($1600). AERA 2017 Annual Meeting and Central Committee Meeting Travel Funding Stipend. (2016-17) American Educational Research Association (AERA). Division A Junior Graduate Representative (AERA) ($800). AERA 2016 Annual Meeting Travel Funding Stipend. (2015-16) American Educational Research Association (AERA). Travel Grant, School of Teacher Education and Leadership (TEAL) ($700). Presentation at 12th Annual Hawaii International Conference of Education (HICE). (2014) Utah State University. Research Travel Grant, Center for Women and Gender ($500). Presentation at 12th Annual Hawaii International Conference of Education (HICE). (2014) Utah State University. Lead Writer. ($49,450). Blue Sky Funding Award Mountainville Academy Solar Project. (2012-2013). Rocky Mountain Power. Project goal: community-based renewable energy project. This funds the installation of solar panels at Mountainville Academy. Co-Writer ($13,500). Technology in the Classroom Initiative. (2012). Daniel’s Fund. Project goal: Provide SMARTboard technology to seven middle school classrooms at Mountainville Academy. (with co-writer Becky Garzella, Grants and Donations Parent Volunteer) Co-Writer ($2,900). Storytelling Festival Initiative (2012). Ashton Foundation. Project goal: Instigate a cross-curriculum storytelling program. In conjunction with money from the parent organization, the grant will help provide textbooks, a storytelling library, and interaction with professional storytellers from the Timpanogos Storytelling Festival. (with co-writer - Becky Garzella, Grants and Donations Parent Volunteer).
PRESENTATIONS Invited Addresses Bullock, E. P. (2016, April). Discussant: Mathematics and Technology-Based Learning Environments. Paper Session, American Educational Research Association (AERA) Annual Meeting, Washington, D.C. International Presentations-Scholarship Bullock, E. P. (2016, July). Preliminary Results of an Explanatory Sequential Mixed Methods Study of the School Leader’s Role in Students’ Mathematics Achievement Through the Lens of Chaos and Complexity Theory. 25th Annual International Society for Chaos Theory in Psychology & Life Sciences (SCTPLS), Salt Lake City, Utah.
454 Moyer-Packenham, P. S., Shumway, J. F., Bullock, E., Anderson-Pence, K., Tucker, S. I., Westenskow, A., Boyer-Thurgood, J., Gulkilik H., Watts, C. M., & Jordan, K., The Virtual Manipulatives Research Group at Utah State University. (2016, July). Using Virtual Manipulatives on IPads to Promote Young Children’s Mathematics Learning. 13th International Congress on Mathematical Education (ICME), Hamburg, Germany. Moyer-Packenham, P.S., Bullock, E., Watts, C., Tucker, S. I., Shumway, J. F., Anderson-Pence, K. L., Westenskow, A., Boyer-Thurgood, J., Gulkilik, H. Jordan, K., (2015, April), The Relationship Between Affordances od Virtual Manipulatives Mathematics Apps and Young Children’s Learning Performance and Efficiency. Paper Presentation, International Conference on Education in Mathematics, Science, & Technology, Anatalya, Turkey. Bullock, E. P., Moyer-Packenham, P. S., Shumway, J. F., MacDonald, B., Watts, C. (2015, March). Effective teaching with technology: Managing affordances in iPad apps to promote young children’s mathematics learning. Paper Presentation, Society for Information Technology and Teacher Education International Conference 2015, Las Vegas, Nevada. Moyer-Packenham, P. S., Westenskow, A., Shumway, J. F., Bullock, E., Tucker, S. I., Anderson-Pence, K. L., Boyer-Thurgood, J., Maahs-Fladung, C., Symanzik, J., Mahamane, S., MacDonald, B., & Jordan, K., The Virtual Manipulatives Research Group at Utah State University. (2014, September). The Effects of Different Virtual Manipulatives for Second Graders’ Mathematics Learning and Efficiency in the Touch-Screen Environment. Paper Presentation, 12th International Conference of the Mathematics Education into the 21st Century Project, Herceg Novi, Montenegro. Moyer-Packenham, P. S., Shumway, J., Westenskow, A., Tucker, S., Anderson, K., Boyer-Thurgood, J., & Bullock, E. (2014, January). Young Children’s Mathematics Interactions with Virtual Manipulatives on iPads. Research Presentation, 12thAnnual Hawaii International Conference on Education (HICE), Honolulu, Hawaii.
Tucker, S. I., Moyer-Packenham, P. S., Boyer-Thurgood, J. M., Anderson, K. L., Shumway, J., Westenskow, A., & Bullock, E. (2014, January). The Nexus of Mathematics, Strategy, and Technology in Second-Graders’ Interactions with an iPad-Based Virtual Manipulative. Paper Session, 12th Annual Hawaii International Conference on Education (HICE), Honolulu, Hawaii.
Boyer-Thurgood, J., Moyer-Packenham, P. S., Shumway, J., Westenskow, A., Tucker, S., Anderson, K., & Bullock, E. (2014, January). Kindergartener’s Strategy Development during Combining Tasks on the iPad. Research Presentation, 12thAnnual Hawaii International Conference on Education (HICE), Honolulu, Hawaii. National Presentations-Scholarship Moyer-Packenham, P. S., Bullock, E. P., Shumway, J. S. (2017, April). The Impact of Technology Affordances in Children’s Mathematical Learning. Paper Presentation—Paper Session: Achieving the Promise in Digital Leadership. National Council of Teachers of Mathematics (NCTM) Research Conference and Annual Meeting, San Antonio, TX Bullock, E. P. (2016, November). The School Leaders’ Role in Students’ Mathematics Achievement Through the Lens of Complexity Theory. Paper Presentation. 30th Annual University Council for Educational Administration (UCEA) Convention, Detroit, Michigan. Bullock, E. P. (2016, November). GSS The School Leaders’ Role in Students’ Mathematics Achievement Through the Lens of Complexity Theory. Graduate Student Paper Presentation. 30th Annual University Council for Educational Administration (UCEA) Convention, Detroit, Michigan.
455 Moyer-Packenham, P. S., Bullock, E., Shumway, J. F., Tucker, S. I., Watts, C. M., Westenskow, A., Anderson-Pence, K., Maahs-Fladung, C., Boyer-Thurgood, J., Gulkilik H., & Jordan, K., The Virtual Manipulatives Research Group at Utah State University. (2016, April). Using Virtual Manipulatives on iPads to Promote Young Children’s Mathematics Learning. American Educational Research Association (AERA) Annual Meeting, Washington, D.C. Bullock, E. P. (2015, Nov.). Growing Teachers’ Mathematics Pedagogical Content Knowledge Through the Expectation of Action Research in the Classroom, Graduate Student Abstract Exchange Round Table Session, Graduate Student Summit, University Council for Educational Administration (UCEA), San Diego, CA Moyer-Packenham, P. S., Shumway, J. F., Bullock, E., Tucker, S. I., Anderson-Pence, K., Westenskow, A., Boyer-Thurgood, J., Maahs-Fladung, C., Symanzik, J., Mahamane, S., MacDonald, B., & Jordan, K., The Virtual Manipulatives Research Group at Utah State University. (2014, April). Young children’s learning performance and efficiency when using virtual manipulative mathematics iPad apps. Paper presented at the annual National Council of Teachers of Mathematics Research Conference (NCTM), New Orleans, Louisiana. Moyer-Packenham, P. S., Shumway, J., Tucker, S., Boyer-Thurgood, J., Hunt, J., & Bullock, E. (2014, April). Children’s Mathematics Interactions with Virtual Manipulatives on iPads. Paper Presentation, National Council of Teachers of Mathematics (NCTM) Research Conference, New Orleans, Louisiana. State & Regional Presentations Bullock, E.P. (2016, November). Addressing the Standards Equitably in a Multi-Grade Expeditionary Setting. Workshop Presentation. The Utah Council of Teachers of Mathematics (UCTM) Annual Conference, Salt Lake City area, Utah. Bullock, E. P. (2016, June). Effective Teaching with Technology: Managing Affordances in IPad Apps to Promote Young Children’s Mathematics Learning. 10th Annual Utah Association of Public Charter Schools (UAPCS) Conference, Layton, Utah. Bullock, E.P. (2016, June). Teaching Algebraic Reasoning Through the Criteria for Representation-Based Proof. 10th Annual Utah Association of Public Charter Schools (UAPCS) Conference, Layton, Utah. Bullock, E.P & Kidd, J. (2015, Nov.). A Model of Principles to Actions: Growing GreenWood Teachers’ Mathematics Pedagogical Content Knowledge Through Action Research—Results so Far, Workshop Presentation, Utah Council of Teachers of Mathematics Annual State Conference (UCTM), Lehi, Utah. Bullock, E.P. and Kidd, J. (2015, June). Growing GreenWood Elementary Teachers’ Mathematics Pedagogical Content Knowledge Through Saxon Math and Action Research in the Classroom, Workshop Presentation, Utah Association of Public Charter Schools (UAPCS) Annual Conference, Provo, Utah. Bullock, E., (2014, November) Orchestrating Whole Class Discourse as Part of a Problem-Solving Intervention Group in a 5th grade Classroom: One Practitioner/Researcher’s Experience. Workshop Presentation, Utah Council of Teachers of Mathematics Annual State Conference (UCTM), Layton, Utah. Bullock, E., (2014, November) Subitizing and Counting: Foundations for Pattern Building and Algebraic Reasoning. Workshop Presentation, Utah Council of Teachers of Mathematics Annual State Conference (UCTM), Layton, Utah.
456 Bullock, E.P. (2014, June). Don’t Throw the Baby Out with the Bath Water: A School Leader’s Guide to Developing Elementary Teachers’ Mathematics Capacity and Pedagogy to Meet the Needs of the CCSSM, Workshop Presentation, Utah Association of Public Charter Schools (UAPCS) Annual State Conference, Layton, Utah. Bullock, E.P., Spencer, B., Ashby, J., Myers, K, & Manderino, K. (2014, June). Saxon Math in the Middle Grades: A Content Analysis, Workshop Presentation, Utah Association of the Public Charter Schools (UAPCS) Annual State Conference, Layton, Utah. Bullock, E.P. (2012). Saxon Math and the Common Core, Workshop Presentation, Utah Association of Public Charter Schools (UAPCS) Annual State Conference, Sandy, Utah. Bullock, E.P. and Fountaine, C. (2008, June). Ability Grouping: The Good, the Bad, and the Ugly: Mathematics Ability Grouping at Mountainville Academy: A Case Study, Workshop Presentation, Utah Association of Public Charter Schools (UAPCS) Annual State Conference, Provo, Utah. Professional Presentation Presenter, (2012, June), Why Do You Want To Be a Charter School Principal? Principal’s Candidate Seminar, USOE, Provo, Utah. Professional Presentations - Panels Panelist, (2016, September). Welcome to AERA Division A: Who We Are, What We Do, And How to Get Involved. Connect Series Panel, Online, Live Interactive Broadcast, Division A, American Educational Research Association (AERA). La Londe, P. G., Bullock, E. (2016, April). Division A Fireside Chat—Politics and Power in Community Policing and Community Schooling. Co-chair Panel Presentation Special Session, American Educational Research Association (AERA) Annual Meeting, Washington, D.C. Rivera, M. D., DeMartino, L., La Londe, P. G. & Bullock, E.P. (2015, Nov.). AERA Division A & L Graduate Student Breakfast: Publish and “Live”: Taking the Fear out of Publishing, Co-chair Panel Presentation Special Session, University Council for Educational Administration (UCEA), San Diego, CA. Panelist, (2015, November), What Are Utah Charter Schools? Utah State University Charter School Panel, USU, Logan, Utah. Panelist, (2015, October), Sharing PhD Experiences Division A. Connect Series Panel, Online, Live Interactive Broadcast, Division A, American Educational Research Association (AERA). Panelist, (2015, July), What Are Utah Charter Schools? Utah State University Charter School Panel, USU, Logan, Utah. Panelist, (2010, May). Principal Training Panel. Brown Bag Panel Discussion, USOE, Salt Lake City, Utah. National Presentations-Scholarship (Pending) Bullock, E. P. (2017, April). The School Leaders’ Role in Students’ Mathematics Achievement Through the Lens of Complexity Theory. Roundtable Paper Presentation—Roundtable Session: Teaching, Learning and Educational Leadership from a Complexity Perspective. American Educational Research Association (AERA) Annual Meeting, San Antonio, TX.
457 Moyer-Packenham, P. S., Bullock, E. P., Shumway, J. S., Tucker, S. I., Watts, C. M., Westenskow, A., Anderson-Pence, K. L., Boyer-Thurgood, J. Jordan, K. (2017, April). Affordances of Virtual Manipulative Math Apps: How They Help and Hinder Young Children’s Learning. Paper Presentation. American Educational Research Association (AERA) Annual Meeting, San Antonio, TX Watts, C., Moyer-Packenham, P.S., Tucker, S.I., Bullock, E.P., Shumway, J.F., Westenskow, A., BoyerThurgood, J., Anderson-Pence, K., Mahamane, S., Jordan, K. (2017, April). Learning Progression Shifts: How Touch-Screen Virtual Manipulative Mathematics App Design Promotes Children’s Productive Struggle. Poster Presenttion—Poster Session: Expanding the Scope of Learning with Innovative Technologies. American Educational Research Association (AERA) Annual Meeting, San Antonio, TX. Bullock, E. P. (2017, April). Chair: Leadership in High-Poverty Schools. Roundtable Session. American Educational Research Association (AERA) Annual Meeting, Washington, D.C. Professional Presentations - Panels (Pending) Bullock, E., Sun, W.L. (2017, April). Division A Fireside Chat— STEM Education and School Leadership: Equitably Accessing the Playing Field. Co-chair Panel Presentation Special Session, American Educational Research Association (AERA) Annual Meeting, San Antonio, TX. Panelist, (2017, April). Graduate Student Orientation: Navigating AERA’s Multiple Offerings. Invited Speaker Session. American Educational Research Association (AERA) Annual Meeting, San Antonio, TX.
SOFTWARE SKILLS Proficient in the following mathematics/statistical analysis software/code: SPSS NVIVO MatLab LaTek Wolfram Mathematica Geometer’s SketchPad R
STATE SERVICE—LEADERSHIP ACTIVITIES Board Trustee (2014-present)
Thomas Edison Charter Schools—North and South Campus. (Academic Achievement Committee) Help oversee the fidelity of charter implementation, ensure fiscal responsibly, practice sound governance, and ensure adherence to laws and charter requirements regarding employees, students, and the school environment. Protect the public’s interests and ensure that the schools are organizationally stable. Chair: Academic Excellence Committee
Committee Member Utah State Office of Education Policy Advisory Committee on Assessment. (2013-2014) Represent Utah Public Charter Schools at state meetings. Collaborate with traditional public school representatives, state office representatives, and political representatives in the development and implementation of state-wide assessment systems. Meet monthly, or as needed to advise on state standardized assessment needs and/or changes.
458 Professional Affiliations & Leadership Roles AMERICAN EDUCATIONAL RESEARCH ASSOCIATION (AERA)
Division A Senior Graduate Representative/AERA Graduate Student Council Member (2016-2017) Responsibilities include: Collaborating with the Division A Graduate Student Committee to strengthen and broaden the graduate school experience for Division A students by disseminating information about annual AERA and UCEA conference sessions, inviting participation in the Connect Series webinars, and informing of various scholarships and awards through the AERA Graduate Student listserv and social media outlets. AERA Division A conference sessions and the Connect Series are planned to help fellow graduate students navigate academic life, to provide opportunities for networking with fellow graduate students, faculty, and practitioners in the field, and to offer guidance in transitioning from graduate student life to careers as professional scholars and researchers. Division A Junior Graduate Representative (2015-2016) Division C Learning and Instruction Division K Teaching and Teacher Education Division L Educational Policy and Politics SIG Chaos and Complexity Theory SIG Research in Mathematics Education SIG Charters and School Choice SIG Leadership for School Improvement SIG Mixed Methods SIG Professional Development SIG Supervision and Leadership Member (2014-present)
SOCIETY FOR CHAOS THEORY IN PSYCHOLOGY & LIFE SCIENCES (SCTPLS) Member (2016-present) NATIONAL COUNCIL OF TEACHERS OF MATHEMATICS (NCTM) Member (2001-present) UTAH COUNCIL OF TEACHERS OF MATHEMATICS (UCTM) Member (2009-present) UTAH ASSOCIATION OF PUBLIC CHARTER SCHOOLS (UAPCS) Member (2009-present) SOCIETY FOR INFORMATION TECHNOLOGY AND TEACHER EDUCATION (SITE) Member (2015-present)


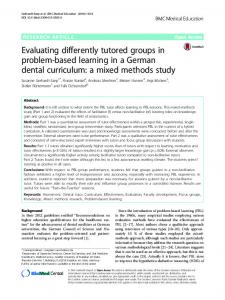


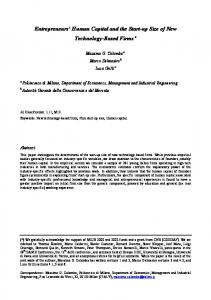
![1 The Future of Mixed Methods - Mixed Methods International ... [PDF]](https://m.moam.info/img/260x300/1-the-future-of-mixed-methods-mixed-methods-intern_6479d875098a9e961c8b45d9.jpg)


