changes in unemployment can lead to changes in crime. A focus on “local
patterns” can help identify the conditions under which unemployment and crime
are ...
The author(s) shown below used Federal funds provided by the U.S. Department of Justice and prepared the following final report: Document Title:
An Exploratory Spatial Data Approach to Identify the Context of Unemployment-Crime Linkages
Author(s):
Sanjeev Sridharan, Jon’a Meyer
Document No.:
208937
Date Received:
March 2005
Award Number:
2002-IJ-CX-0010
This report has not been published by the U.S. Department of Justice. To provide better customer service, NCJRS has made this Federallyfunded grant final report available electronically in addition to traditional paper copies.
Opinions or points of view expressed are those of the author(s) and do not necessarily reflect the official position or policies of the U.S. Department of Justice.
This document is a research report submitted to the U.S. Department of Justice. This report has not been published by the Department. Opinions or points of view expressed are those of the author(s) and do not necessarily reflect the official position or policies of the U.S. Department of Justice.
NIJ Grant #2002-IJ-C X -0010
An Exploratory SpatialD ata Approach to Identify the C ontext of U nem ploym entC rim e Linkages
June 30, 2004
Sanjeev Sridharan, W estat
Jon’a M eyer, R utgers U niversity, C am den
Subm itted to:
Subm itted by:
N ationalInstitute of Justice
WESTAT 1650 Research Boulevard Rockville, M aryland 20850 (301) 251-1500
This document is a research report submitted to the U.S. Department of Justice. This report has not been published by the Department. Opinions or points of view expressed are those of the author(s) and do not necessarily reflect the official position or policies of the U.S. Department of Justice.
ABSTRACT
In this grant, we develop and implement an exploratory spatial approach to identify the contexts of unemployment-crime (U-C) relationships. To date, the U-C literature has focused primarily on global explanations of U-C linkages. There has been limited research on “local” conditions under which changes in unemployment can lead to changes in crime. A focus on “local patterns” can help identify the conditions under which unemployment and crime are likely to be linked. The methodological approach is developed within the Cantor-Land (1985) framework of U-C linkages. The Cantor-Land framework stresses a viewpoint derived from the human ecology school of sociology (Hawley, 1950) and integrates both opportunity and motivational theories of crime. Criminal activity within such a viewpoint is a result of the interplay of motivated offenders, suitable targets, and absence of effective guardians (Cantor and Land, 1985; Cohen and Felson, 1979). This interplay of motivational and opportunity factors leads to a dynamic relationship between unemployment and crime rates. Using a routine activity framework, Cantor-Land hypothesize that (1) initially, an increase in unemployment may result in a contemporaneous drop in crime due to reduced opportunities to commit crime and (2) over time, as the motivational effects of crime “kick-in,” crime will increase. Our methodological focus is on examining the utility of Exploratory Spatial Data Analysis (ESDA) (Anselin, 1994,1998,1999) techniques in exploring unemployment crime linkages. We are specifically interested in the utility of ESDA in identifying the community contexts of U-C linkages. We describe a method that integrates ESDA approaches with a multilevel modeling (Bryk and Raudenbush, 2002) approach. The substantive focus is on the role of resource deprivation in moderating the motivational and opportunity linkages between unemployment and crime. We believe that there is a need to explore the role of resource deprivation in moderating the U-C linkages because, when viewed theoretically from a framework that balances motivated offenders, suitable targets, and increased guardianship, the effects of resource deprivation on U-C linkages are not clear. Clearly, the number or proportion of suitable targets should be much lower in locations characterized by high levels of resource deprivation. Another point is that, during times of high unemployment, it can be argued that poorer communities may see an increase in guardianship networks. Because there is very limited research on changes in guardianship between good and bad times, one rather speculative point is that unemployment may have more pronounced negative effects in poorer communities, leading them to “rally around” more for support; this “rallying around” may not occur or may be downplayed in much wealthier areas, due in part to the structure of income on those areas (e.g., including financial investments in addition to—or in
iii
This document is a research report submitted to the U.S. Department of Justice. This report has not been published by the Department. Opinions or points of view expressed are those of the author(s) and do not necessarily reflect the official position or policies of the U.S. Department of Justice.
place of—employment) and the larger potential for savings accounts, credit availability, and other planned methods of coping with income loss. Our key findings include the following: ¢
¢
¢
¢
¢
Weak relationships were obtained between the average values of unemployment and crime rates (averaged between 1995 and 2000). In the multilevel models, with the exception of larceny, the global effect of unemployment on crime rates was not statistically significant. A positive contemporaneous effect of unemployment on crime was found for larceny. Strong “global” spatial patterns were found for the unemployment-crime coefficient for larceny, motor vehicle theft, and robbery and index crimes. No global patterns were found for burglary. Local patterns were obtained for the unemployment-crime coefficient for each of the crimes. The local patterns of the unemployment-crime coefficient for larceny, motor vehicle theft, and index crimes were related. The local patterns of burglary and robbery were not related to the other crimes. A negative relationship was obtained between the unemployment coefficient and resource deprivation for burglary, larceny, motor vehicle theft and index crimes. The spatial pattern was especially significant in the affluent areas closest to Washington, DC.
iv
This document is a research report submitted to the U.S. Department of Justice. This report has not been published by the Department. Opinions or points of view expressed are those of the author(s) and do not necessarily reflect the official position or policies of the U.S. Department of Justice.
TABLE OF CONTENTS
Chapter
Page
ABSTRACT .........................................................................................................................
iii
1
INTRODUCTION ...........................................................................................
1
2
THEORIES OF UNEMPLOYMENT-CRIME LINKAGES...........................
5
3
THE NEED FOR AN EXPLORATORY SPATIAL DATA APPROACH.....
8
4
SUBSTANTIVE FOCUS ................................................................................
11
4.1
Differences in Unemployment-Crime Linkages Across Types
of Property Crimes.............................................................................. Resource Deprivation as a Potential Moderator of
Unemployment-Crime Linkages.........................................................
15
METHODOLOGICAL APPROACH..............................................................
18
5.1 5.2 5.3
Data..................................................................................................... Measures ............................................................................................. Methods ..............................................................................................
18
18
19
5.3.1 5.3.2 5.3.3 5.3.4 5.3.5 5.3.6
ESDA Methods ................................................................... ESDA Tools ........................................................................ The Moran Scatterplot Map ................................................ The Moran Scatterplot......................................................... The Moran Significance Map.............................................. Spatial Weights Matrix .......................................................
19
21
21
22
22
22
Exploratory Spatial Data Analysis with Raw Data............................. ESDA of County-Level Coefficients from the Multilevel Models..... Multilevel Models...............................................................................
23
23
23
5.6.1 5.6.2
Level-1 Model ..................................................................... Level-2 Model .....................................................................
24
26
Summary of Process ...........................................................................
27
RESULTS ........................................................................................................
28
6.1 6.2
28
4.2 5
5.4 5.5 5.6
5.7 6
ESDA with Raw Data ......................................................................... ESDA of Unemployment-Crime Coefficients Obtained from
the Multilevel Model ..........................................................................
v
11
31
This document is a research report submitted to the U.S. Department of Justice. This report has not been published by the Department. Opinions or points of view expressed are those of the author(s) and do not necessarily reflect the official position or policies of the U.S. Department of Justice.
TABLE OF CONTENTS (CONTINUED)
Chapter
Page 6.3
Relationship Between Unemployment-Crime Coefficient and
Resource Deprivation .........................................................................
38
DISCUSSION AND FINDINGS.....................................................................
41
7.1 7.2 7.3 7.4 7.5
Findings .............................................................................................. Dynamic Contexts of Crime: The Need for Exploratory Methods..... Extending the Cantor-Land Framework ............................................. Limitations .......................................................................................... Next Steps ...........................................................................................
41
42
43
44
45
REFERENCES .....................................................................................................................
46
7
List of Tables
Table
1
Global Moran’s I for averaged unemployment and crime rates from
1995 to 2000 ....................................................................................................
29
2
Correlations between average levels of unemployment rates (1995
to 2000) and crime rates (1995 to 2000)..........................................................
31
3
Correlations between the local Moran’s I of average unemployment
rates (1995-2000) and average crime rates (1995-2000) .................................
31
4
Unemployment coefficient for crime rates ......................................................
32
5
Global Moran’s I for unemployment coefficient .............................................
35
6
Correlations between Local Moran’s I of U-C coefficients............................
37
List of Figures
Figure
1
Structural model proposed by Cantor-Land (1985) .........................................
6
2
The standard approach to testing U-C linkages ...............................................
8
3
Integrating context with the C-L framework ...................................................
10
vi
This document is a research report submitted to the U.S. Department of Justice. This report has not been published by the Department. Opinions or points of view expressed are those of the author(s) and do not necessarily reflect the official position or policies of the U.S. Department of Justice.
TABLE OF CONTENTS (CONTINUED)
List of Figures (continued) Figure 4
The challenge of defining a neighbor ..............................................................
20
5
Index crime rates—1995-2000 ........................................................................
25
6
Unemployment rate—1995-2000 ....................................................................
25
7
Process of integrating Multilevel models with ESDA .....................................
27
8
Local Moran Significance Map for average unemployment rate from 1995 to 2000 ....................................................................................................
29
9
Local Moran Significance Map for average burglary crime rates from 1995 to 2000 ....................................................................................................
29
10
Local Moran Significance Map for averaged larceny crime rates from 1995 to 2000 ....................................................................................................
29
11
Local Moran Significance Map for average motor vehicle crime rates from 1995 to 2000............................................................................................
30
12
Local Moran Significance Map for average robbery crime rates from 1995 to 2000 ....................................................................................................
30
13
Local Moran Significance Map for average index crime rates from 1995 to 2000 ....................................................................................................
30
14
Distribution of county-specific empirical Bayes estimates of the U-C coefficient for burglary ....................................................................................
33
15
Distribution of county-specific empirical Bayes estimates of the U-C coefficient for larceny ......................................................................................
33
16
Distribution of county-specific empirical Bayes estimates of the U-C coefficient for motor vehicle theft ...................................................................
34
17
Distribution of county-specific empirical Bayes estimates of the U-C coefficient for robbery .....................................................................................
34
18
Distribution of county-specific empirical Bayes estimates of the U-C coefficient for index crimes .............................................................................
35
vii
This document is a research report submitted to the U.S. Department of Justice. This report has not been published by the Department. Opinions or points of view expressed are those of the author(s) and do not necessarily reflect the official position or policies of the U.S. Department of Justice.
TABLE OF CONTENTS (CONTINUED)
List of Figures (continued)
Figure
19
Local Moran’s I for the U-C coefficient of burglary .......................................
36
20
Local Moran’s I for the U-C coefficient of larceny .........................................
36
21
Local Moran’s I for the U-C coefficient of motor vehicle theft ......................
36
22
Local Moran’s I for the U-C coefficient of robbery ........................................
37
23
Local Moran’s I for the U-C coefficient of index crimes ................................
37
24
Smoothed relationship between resource deprivation and the U-C
coefficient for burglary ...................................................................................
38
25
Smoothed relationship between resource deprivation and the U-C
coefficient for larceny ......................................................................................
39
26
Smoothed relationship between resource deprivation and the U-C
coefficient for motor vehicle theft ...................................................................
39
27
Smoothed relationship between resource deprivation and the U-C
coefficient for robbery .....................................................................................
40
28
Smoothed relationship between resource deprivation and the U-C
coefficient for index crimes .............................................................................
40
viii
This document is a research report submitted to the U.S. Department of Justice. This report has not been published by the Department. Opinions or points of view expressed are those of the author(s) and do not necessarily reflect the official position or policies of the U.S. Department of Justice.
AN EXPLORATORY SPATIAL DATA APPROACH TO IDENTIFY THE CONTEXT OF UNEMPLOYMENT-CRIME LINKAGES
1. INTRODUCTION
The relationship between unemployment and crime has been an area of much creative theorizing and debate for almost a century. Nearly nine decades ago, Bonger (1916) wrote: "When we sum up the results that we have obtained it becomes plain that economic conditions occupy a more important place in the etiology of crime than most authors have given." The research on unemployment and crime was fairly one-sided for decades, arguing that increased crime was the natural outcome when unemployment rates rose. In 1979, Cohen and Felson completed their oft-reprinted article in which they presented the routine activity approach. Deceptively simple at first glance, the basic premise behind the theory is that predatory violations are most likely to occur when (1) motivated offenders (i.e., would-be criminals) and (2) suitable targets are brought together in the (3) absence of capable guardians (who serve to deter offending). Although Cohen and Felson focused on the effects of societal changes that have changed how Americans engage in schooling, work, and leisure (e.g., spending more time out of their homes around non-housemates) and thus affected the distribution of capable guardians, they suggested that future scholars more carefully examine the other two elements of their theory: “Without denying the importance of factors motivating offenders to engage in crime, we have focused specific attention upon violations themselves and the prerequisites for their occurrence. However, the routine activity approach might in the future be applied to the analysis of offenders and their inclinations as well” (1979, p. 605). The introduction of routine activity theory complicated discussions of the connections between unemployment and crime by noting that unemployment, through increasing guardianship of possessions among the former-employed, could actually decrease crime. Not long after Cohen and Felson' s article, Cantor and Land (1985) reexamined the unemployment – crime linkages in light of the basic tenets of routine activity theory. Their analysis found what Cohen and Felson predicted would happen: crime rates were not merely directly related to unemployment rates. Instead, they found that crime and unemployment rates were involved in a complex interplay in which the direction of the effects depended on both motivation and opportunity factors. Their findings helped explain the sometimes contradictory findings from prior scholars by incorporating the
1
This document is a research report submitted to the U.S. Department of Justice. This report has not been published by the Department. Opinions or points of view expressed are those of the author(s) and do not necessarily reflect the official position or policies of the U.S. Department of Justice.
effects of both motivation (i.e., the distribution of motivated offenders) and opportunity (i.e., the distribution of suitable targets and capable guardians). Cantor and Land (1985, p. 330) concluded their influential work by noting: “In brief, the theory and analyses described above imply that the relationship between unemployment rates and crime rates can be positive, negative or null, depending on the type of crime and whether one focuses on the effects on criminal opportunity or criminal motivation.” The Cantor-Land framework was developed using an aggregated national-level time series framework. Similarly, most existing studies have focused on aggregated national-level or state-level approaches to study the linkage between unemployment and crime. In this study, we examine county/citylevel contemporaneous U-C linkages between 1995 and 2000. Our focus on the county and city (as opposed to state or national) levels of analysis allows us to examine the spatial processes at a more disaggregated level. This project is among the first works that has simultaneously utilized spatial and temporal variations to study the linkages between unemployment and crime rates. Prior research has focused on aggregate descriptors of an area (i.e., city, state, or country) or on comparisons among limited numbers of jurisdictions. Despite the advent of new technology and research methods that allow for complex spatial analyses, research comparing substantial numbers of geographic areas has not yet become common. This type of research is needed and may better clarify the complex interplay between unemployment and crime. The focus of this grant is on both methodological and substantive issues. Methodologically, we examine the utility of Exploratory Spatial Data Analysis (ESDA) (Anselin, 1994; 1998;1999) techniques in exploring unemployment-crime linkages. We are specifically interested in the utility of ESDA in identifying the county-level contexts of U-C linkages. We describe a method that integrates ESDA approaches with a multilevel modeling (Raudenbush and Bryk, 2002) approach. A focus on spatial patterns of crime is consistent with a routine activity perspective. Crime "hot spots," for example, may result from the geographic clustering of crime opportunities (Felson and Clarke, 1998, p. 15). In fact, it is likely that all factors related to the routine activity approach are spatially clustered—employment opportunities tend to be located near one another and in certain geographic areas (for example, in the central business district of a city) and it is conventional wisdom that the rates of motivated offenders vary by communities (making certain communities more desirable for residence or the location of a new business). The addition of such spatial elements to the routine activity approach underscores the importance of examining U-C linkages in an exploratory spatial context.
2
This document is a research report submitted to the U.S. Department of Justice. This report has not been published by the Department. Opinions or points of view expressed are those of the author(s) and do not necessarily reflect the official position or policies of the U.S. Department of Justice.
The strength of the approach discussed here is that a county-specific U-C coefficient is obtained for each of Virginia’s counties/cities. Obtaining county-specific U-C coefficients permits us to address the following substantive questions: Do the county-specific U-C coefficients have a spatial pattern? The approach discussed in this grant allows us to examine both the global and local spatial patterns of unemployment-crime relationships. Global spatial patterns examine the average spatial relationship across all of Virginia’s counties and cities. Local spatial patterns examine the spatial patterning in certain regions of Virginia – a focus on local spatial patterns helps identify if the U-C relationship is more pronounced in certain areas of Virginia. If employment opportunities cluster in certain locations within cities or counties, for example, unemployment effects may be more pronounced in the communities near those centers of employment activity, thus creating a unique incentive for crime. Do the spatial patterns of U-C linkages differ by type of property crime? The differences in the spatial patterns of unemployment-crime linkages are examined by the type of property crimes. The following property crimes are examined: burglary, larceny, motor vehicle theft, and robbery. Does resource deprivation moderate the linkages between unemployment and crime? The role of resource deprivation in moderating the motivational and opportunity linkages between unemployment and crime is examined. Community levels of resource deprivation are relatively easy to estimate using ecological measures collected by many government and service agencies/organizations and may significantly add to the understanding of U-C linkages. Spatial approaches are especially relevant for sociological problems. As described by Abbott (1997a): “Social facts are located.… Every social fact is situated, surrounded by other contextual facts and brought into being by a process relating it to past contexts.” Conceptually, the approach discussed in this study may be useful because it can contribute to an understanding of the conditions under which U-C linkages are likely to be strongest. However, it is important to stress that we are at a very early stage of development in using spatial approaches to advance the criminological field. As discussed by Anselin et al. (2000, pp. 213-214): “The promise of using spatial data and analysis for crime control still remains to be demonstrated and depends on the nature of the relationship between crime and place. If spatial features serve as actuating factors for crime, either because of the people or facilities located there, interventions designed to alter those persons and activities might well affect crime.” This grant is organized as follows. Chapter 2 discusses the motivation and opportunity theories of U-C linkages. Chapter 3 discusses the need for exploratory spatial data approaches in studying
3
This document is a research report submitted to the U.S. Department of Justice. This report has not been published by the Department. Opinions or points of view expressed are those of the author(s) and do not necessarily reflect the official position or policies of the U.S. Department of Justice.
U-C linkages. Chapter 4 discusses why unemployment-crime patterns are likely to differ by type of property crimes and the potential substantive role of resource deprivation in a theory of U-C linkages. Chapter 5 discuses the methods—both the multilevel models and ESDA approaches. Chapter 6 presents the results followed by the implications of those results in Chapter 7.
4
This document is a research report submitted to the U.S. Department of Justice. This report has not been published by the Department. Opinions or points of view expressed are those of the author(s) and do not necessarily reflect the official position or policies of the U.S. Department of Justice.
2. THEORIES OF UNEMPLOYMENT-CRIME LINKAGES
Over time, U-C linkages have been studied by two broad groups of scholars: motivational theorists and opportunity theorists. Motivational theorists contend that individuals are more likely to commit crimes when they are unable to achieve their goals through legitimate means. The motivation to commit a crime may result from a wide range of factors ranging from a desire to maintain or improve s economic conditions, to following a rational utilitarian calculus in which the perceived benefits of one' committing a crime outweigh the perceived costs of the crime. Some of the theories included within the rubric of motivational theories are strain theory (e.g., Cloward and Ohlin, 1960), utilitarian or rationalchoice theory (e.g., Becker, 1968), and conflict or Marxist theory (e.g., Hughes and Carter, 1981). Motivational theories hypothesize a positive relationship between unemployment and crime rates; that is, crime increases with raised unemployment because would-be offenders should be more motivated to engage in deviance during difficult times. Opportunity theories, on the other hand, contend that motivational forces are tempered by another important ingredient in the mix, opportunity, so that even motivated offenders cannot commit crimes without the opportunity to do so (e.g., Cantor and Land, 1985; Cohen and Felson, 1979; Cohen et al. 1980; Felson and Cohen, 1980). Opportunity theories recognize that crime is more than simply the convenient union of a motivated offender and a victim/target. Indeed, Cohen and Felson (1979, p. 589; Felson and Cohen, 1980, p. 392) argue that the unfortunate merger also requires a lack of guardians who can effectively prevent offenses from happening. The distribution of these guardians is based, in part, on the routine activities that fill our days and the physical design of our living environments. All of these factors combine to create opportunities for crime. Opportunity theorists argue that unemployment may actually reduce property crime (at least in the short term) because the unemployed are more likely to be at home where they can serve as watchmen over their own possessions (Cohen and Felson, 1979; Cohen et al. 1980; Felson and Cohen, 1980). Over time, however, erosion of resources such as unemployment payments and financial support from networks of family and friends may mean that unemployment ultimately results in increased crime. The routine activity approach stresses a viewpoint derived from the human ecology school of sociology (Hawley, 1950) and integrates both opportunity and motivational theories of crime. As discussed earlier, criminal activity within such a viewpoint is a result of the interplay of motivated offenders, suitable targets, and absence of effective guardians (Cantor and Land, 1985; Cohen and Felson,
5
This document is a research report submitted to the U.S. Department of Justice. This report has not been published by the Department. Opinions or points of view expressed are those of the author(s) and do not necessarily reflect the official position or policies of the U.S. Department of Justice.
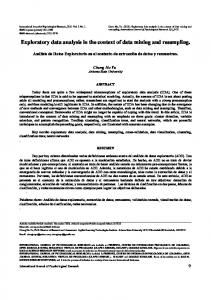
1979). This interplay of motivational and opportunity factors leads to a dynamic relationship between unemployment and crime rates. Cantor and Land (1985, p. 322) conceptualize the opportunity effect as instantaneous: “Thus, it can be expected that the opportunity impacts of unemployment on crime— through both the system activity and guardianship effects— are contemporaneous.” However, the motivational effects take time to act: “Thus, it cannot be argued that the financial stresses created by slowdowns in economic activity are likely to be so severe as to immediately motivate persons to commit criminal offenses. But, as benefits and other sources of financial and psychological support decline and/or stop during a recession, individuals may be more likely to engage in criminal offenses” (Cantor & Land, 1985, p. 322). Thus, initially, an increase in unemployment may result in a drop in crime, although over time, as the motivational effects of crime “kick in,” crime will increase. As described by Cantor and Land (1985), identification of motivational and opportunity components of the unemployment-crime linkages presents formidable methodological challenges. For example, the structural model they developed to study unemployment-crime linkages (see Figure 1) is “hopelessly” underidentified (Cantor and Land, 1985, p. 320). Guided by theory, Cantor and Land imposed temporal assumptions to “partially identify” these effects. As described above, they identified the relationships in Figure 1 by assuming that the opportunity effects will be instantaneous, although the motivational impact will take much longer (specifically a 1-year lag).
Motivation Effect
+
+
Unemployment Rate
Crime Rate
-
+
Opportunity Effect
Figure 1. Structural model proposed by Cantor-Land (1985)
6
This document is a research report submitted to the U.S. Department of Justice. This report has not been published by the Department. Opinions or points of view expressed are those of the author(s) and do not necessarily reflect the official position or policies of the U.S. Department of Justice.
Cantor and Land' s (1985) contribution to the literature was not without its critics. Hale and Sabbagh (1991) and Greenberg (2001), for example, have argued that the Cantor-Land model was "misspecified." Part of the challenge in specifying and identifying the U-C linkages resulted from the complexities associated with time series modeling. In a recent issue of the Journal of Quantitative Criminology (2001, no. 4), some of the issues relating to the specifications and estimations of U-C linkages within a time series framework were discussed. One of the more important ideas emerging from this special volume was the need for alternative methodologies and research designs in identifying unemployment-crime linkages (Levitt, 2001). In our judgment, there is a need to move beyond time series approaches in studying U-C linkages. In this light, we believe that an exploratory spatial approach is ideal. We propose an approach that integrates multilevel approaches using hierarchical linear models (HLM; Raudenbush and Bryk, 2002) with ESDA.
7
This document is a research report submitted to the U.S. Department of Justice. This report has not been published by the Department. Opinions or points of view expressed are those of the author(s) and do not necessarily reflect the official position or policies of the U.S. Department of Justice.
3. THE NEED FOR AN EXPLORATORY SPATIAL DATA APPROACH
Although there is a rich body of criminological research linking unemployment to crime rates, most of this work has occurred within a confirmatory setting. Typically, this involves beginning with a theory detailed enough to provide a clear specification for one or more statistical models. When one begins with an initial theory, the researcher’s primary task is to specify and test a model derived from the initial theory (see Figure 2). Such approaches seldom focus on using the data to develop more elaborate theories. In addition, the focus of such investigations is usually on testing global explanations of crime. Rarely, if ever, is there a focus on local contexts of crime.
Initial Theory
Model
Substantive Effects
Figure 2. The standard approach to testing U-C linkages In our view, as evidenced by the recent debates in the Journal of Quantitative Criminology (2001, 4), there is a need to go beyond a focus on theory testing to theory building. The strength of an exploratory approach is its ability to elaborate U-C theories. A preoccupation with global explanations of crime has both substantive and methodological implications. Substantively, why should we expect the opportunity and motivation components to be the similar across all communities? Clearly, a global approach is appropriate when examining highly aggregate time series data such as those used by Cantor and Land (1985). However, newer developed methodological approaches give the opportunity to explore the context of U-C linkages using finer levels of data. In the absence of a well-specified theory for understanding local contexts, scholars must rely on an exploratory approach to study such linkages. The methodological problems with such a global explanation have been critiqued by Maltz (1994, p. 448-449), who was concerned about the “unimodal” assumptions inherent in regression models: Regression models implicitly assume that there is a mean value for each of the variables and that the individual cases cluster around this mean in a multivariate normal distribution. This formulation of the model implies that only one
8
This document is a research report submitted to the U.S. Department of Justice. This report has not been published by the Department. Opinions or points of view expressed are those of the author(s) and do not necessarily reflect the official position or policies of the U.S. Department of Justice.
mechanism is working, that the cases under study represent variations on a single theme, ignoring the possibility that "important subsets are inappropriately being merged as though they represented homogeneous populations" (McCord, 1993, p. 413).…. Regression analyses produce coefficients for a single equation that "explains" the contribution of each variable. These tests purport to show which single value of coefficient is best according to some criterion (e.g., minimum mean square error, maximum likelihood), irrespective of the fact that there may be two distinct values corresponding to two different types of individual… In other words, the assumption is implicitly made that the data are unimodal, that there is one "grand unified theory" of crime or criminal behavior. (Italics in original) Maltz’s argument about the “reification” of such a global mean approach made at the level of the individual is also true at the county level. The approach adopted in this paper integrates countylevel multilevel models with exploratory spatial models. Rather than a single global coefficient, our interest is in an unemployment-crime coefficient for each county/city. Specifically, we focus on linking county-specific trajectories of crime rates to unemployment rates. Once county-specific coefficients are obtained, ESDA techniques are used to study the “local” patterns of such coefficients. There are two key aspects to our proposed exploratory approach: a.
Areas in need of elaboration within such a theory: Most of the discussions of the Cantor-Land framework (i.e., the “C-L framework”) have taken place within a theorytesting framework. For example, several critiques of the C-L framework (e.g., Hale and Sabbagh, 1991; Greenberg, 2001) have focused on problems of specification and time series methods— problems associated with testing theories. There have been limited critical discussions of the areas in need of elaboration within the C-L framework and we believe that one of the key needs is to move the framework away from its global focus to better understand the local conditions under which motivation and opportunity components are likely to be observed. There needs to be greater discussion on the contexts under which motivation and opportunity effects are likely to be strongest. Figure 3 describes the type of elaboration of the C-L framework we propose. As one can see, we add consideration of the community context to the Cantor-Land framework. It is likely, for example, that the specific dynamics present in individual communities create unique circumstances that directly affect both the motivation and opportunity effects for those communities. Without including the community context, we are forced to make generalized assumptions about the effects of unemployment and to assume that changes in unemployment rates affect all communities equally. The idea that unemployment effects are constant across communities is unrealistic and does not consider the unique context of individual cities and counties and how those
9
This document is a research report submitted to the U.S. Department of Justice. This report has not been published by the Department. Opinions or points of view expressed are those of the author(s) and do not necessarily reflect the official position or policies of the U.S. Department of Justice.
ity un mm ext o C nt Co
Motivation Effect
+
?
Unemployment Rate
Crime Rate
? Co mm Co unit y nte xt
+
Opportunity Effect
Figure 3. Integrating context with the C-L framework contexts affect community beliefs and outcomes. Because we expect the community context to alter the motivation and opportunity effects in significantly different ways, we cannot include the predicted direction of effects and instead label them with question marks. b.
Implementing methods to identify county-level contexts of unemployment-crime linkages: In our view, exploratory spatial methods can be useful to identify the “contexts” in which unemployment-crime linkages are likely to vary across time and space. The key question is: How does one identify temporal and spatial contexts of U C linkages? In a time series setting, Issac and Griffin (1989) have noted that the majority of applied time series work involves the standard assumption (often implicit) that the results obtained through time series models are valid over the entire time period in the study. As Issac and Griffin note (1989, p. 876): “Here, history is conceived to be the continual unfolding of the same underlying historical communality. Such a preoccupation with the continuity between past and present tends to homogenize or average away the difference between ‘then and there’ and ‘here and now.’” Our focus in this grant is on identifying the potential spatial context of U-C relationships. Similar to Issac and Griffin’s comments about the temporal context, it is important to avoid assuming that any relationship between unemployment and crime will be uniform across an entire state. Most criminological theories focus on global explanations of crime— for the most part, one requires datadriven approaches to better understand the local contexts of crime. As a first step, we propose to use ESDA to examine the spatial contexts of U-C linkages.
10
This document is a research report submitted to the U.S. Department of Justice. This report has not been published by the Department. Opinions or points of view expressed are those of the author(s) and do not necessarily reflect the official position or policies of the U.S. Department of Justice.
4. SUBSTANTIVE FOCUS
We implement ESDA methods to focus on two substantive issues: (a) Differences in unemployment-crime relationships among four property crimes – burglary, larceny, motor vehicle theft, and robbery. As we argue below, there are substantive reasons to anticipate that the U-C relationships will differ by type of crime. (b) We explore the role of resource deprivation as a moderating factor in the connection between unemployment and crime. Each of these two issues is discussed below. 4.1
Differences in Unemployment-Crime Linkages Across Types of Property Crimes An important research question is whether the dynamic response of crime rates to
unemployment rates differs for various types of property crime. The basic intuition is that the basic sociological, psychological and economic forces that may govern the interplay of opportunity and psychological factors could vary for different crimes. We explore whether there are differences in the spatial patterning of the U-C coefficient across the different types of property crimes. Among property criminals (i.e., burglars, larcenists, auto thieves and robbers), robbers are the easiest to link to their acts due to the legal necessity that the crime happen in the presence of the victim. Notwithstanding the limitations to eyewitness testimony, victims often see and can at least vaguely describe the perpetrators who took their property. Because of their inherently violent nature (even robberies that do not result in injuries are typically frightening to victims), robberies are fairly likely to be reported when they do occur because the victims feel "injured, frightened, and financially hurt by the crime" (Gove, Hughes and Geerken, 1985). Robberies typically take place in businesses or against individuals who are not in their homes. This dynamic indicates that increases in unemployment rates could actually serve to decrease robbery rates in the short term because individuals (i.e., potential victims) are less likely to be outside of their homes where they can be targeted by robbers. Because of their violent nature, robberies represent a higher level of commitment to crime than do other thefts. Of the four types of property crimes, robberies represent the most risk to an offender because of the high likelihood that the offense will be reported to police, the increased chance that the victim may be able to identify the offender, and the prospects of a harsh sentence due to the violent nature of robberies. It is for this reason that one would expect any eventual increases (of robbery to increases in unemployment) to occur further in the future than the other property crimes.
11
This document is a research report submitted to the U.S. Department of Justice. This report has not been published by the Department. Opinions or points of view expressed are those of the author(s) and do not necessarily reflect the official position or policies of the U.S. Department of Justice.
As described in Chapter 5, the methodological focus is on the summed value of both components of crime (motivation and opportunity) for each crime type. For robbery, the opportunity component should decrease as unemployment increases (due to the reduced number of easily available victims), while the motivation effect should increase. It seems logical that the motivation increases will be minimal for robberies due to the higher risk to offenders of detection, apprehension, and punishment when compared with other, less risky, forms of theft. In addition, robberies of strangers are unpredictable in terms of net gain for offenders who may find it difficult to ascertain the amount of money or goods that an individual target may have on his/her person or whether a victim will injure the robber in an effort to protect him or herself during the crime. So, the final anticipated effects of unemployment on crime should be relatively minimal for robberies and any effects seen should be negative due to the lower motivation. Unlike robberies, burglaries are among the hardest crimes to solve because they typically take place outside the presence of any witnesses. Burglaries may go unreported if they go undiscovered by the victim or if the amount stolen is insufficient to influence the victim to report the crime. Some burglary victims believe that their property will not be returned to them or that the bother of reporting the crime and possibly having to take a day off work to testify is not worth involving the criminal justice system. According to routine activities theory, increases in unemployment should reduce burglaries because individuals spend more time at home and are able to better serve as watchmen over their own possessions. Because of their "anonymous" nature, burglaries should be a more attractive option to would-be offenders when financial circumstances are driving them into crime to support themselves; thus, increases in burglaries are feasible once unemployment insurance and other financial supports are exhausted. Burglaries still present some risks to offenders, however. While individual burglars may feel they are skillful enough to break into a home and avoid detection by residents, there is always a chance that a burglar will encounter an irate homeowner with a weapon. Even homeowners who do not confront burglars could quietly call police without the burglar knowing that his/her risk of apprehension just went up exponentially. Another factor is the typical lack of knowledge beforehand about what “goods” will be inside the entered building. Unless cash is found, the burglar must decide which items to take; large items, for example, will be harder to carry while avoiding suspicion outside the burglarized building. Young men carrying television sets through the streets during the wee hours of the morning tend to attract attention from neighbors and the authorities. In the end, the proceeds from “successful” burglaries often include used merchandise that must be sold, fenced, or pawned, representing yet an additional chance for
12
This document is a research report submitted to the U.S. Department of Justice. This report has not been published by the Department. Opinions or points of view expressed are those of the author(s) and do not necessarily reflect the official position or policies of the U.S. Department of Justice.
apprehension and a potentially low financial payoff (one must pawn quite a number of VCRs at five dollars each to net any substantial gain).1 The anticipated sum effect on crime for burglaries should be higher than for robberies, but still relatively low because the number of potential targets (unattended homes) will decrease as unemployment increases and those decreases will not be fully offset by increased motivation (due in part to the riskiness of burglary to offenders in terms of apprehension and punishment, retaliation by the victim, and/or low financial gain). As motivation increases, however, the rate of burglaries may well increase as offenders become more and more financially desperate and that increased motivation tilts the scale in favor of a violation (and as offenders develop sales/fencing networks to help them dispose of the proceeds from their burglaries). In addition, it is unknown what threshold values for home protection are optimal for crime prevention purposes. Are there increases in home protection as more and more members of a given household become unemployed, for example, or is the optimum protection achieved by only one or two individuals remaining at home to serve as watchmen over their possessions? What happens when additional family members lose their jobs; do they solidify the defense of the home or are they driven to become potential thieves themselves? Due to the existence of insurance policies and the value of automobiles to their owners, auto thefts are likely to be reported, which increases the chances of detection and sanctioning of the offender. Auto theft rates are logically tied to unemployment rates because of the financial aspects of the crime, but routine activities linkages are less clearly defined. Low unemployment rates may influence auto theft rates because working people bring their cars to parking lots that offer a greater selection of vehicles (that cannot be watched over by the owner or his/her neighbors), while simultaneously offering potential auto s point of thieves some anonymity as they select and abscond with cars. From the would-be criminal' view, however, two problems with purloining vehicles are that doing so requires specialized skills in stealing the car and then selling it without being caught, and that high unemployment may mean a reduced market for stolen autos. Because of these difficulties, we would expect decreases in auto thefts, followed by increases much later (e.g., to give offenders time to develop theft skills and networks in which to dispose of the stolen vehicles). In the end, the effects of unemployment on crime should be negative at first (due to decreased access to easily stolen vehicles and increased guardianship of vehicles
1 One of the authors witnessed the pawning of a likely stolen VCR in Gallup, NM. The shop owner offered the scruffy-looking man who brought it in five dollars, noting that the last one he had brought in was still in the shop. Probably knowing that he would not get much more for the gadget, the fellow surrendered it and left with the paltry fee.
13
This document is a research report submitted to the U.S. Department of Justice. This report has not been published by the Department. Opinions or points of view expressed are those of the author(s) and do not necessarily reflect the official position or policies of the U.S. Department of Justice.
by the unemployed), then increase as motivation increases and offenders develop adequate auto theft skills and networks. Finally, we turn our attention to larceny, an offense category that encompasses many types of theft. From a routine activities standpoint, larcenies differ from the other three forms of property crime in that a larger proportion of larcenies can be considered "crimes of opportunity." Robbers, burglars, and auto thieves seldom act on the spur of the moment as their offenses typically require some sort of planning (e.g., the foresight to bring along "work tools"). Would-be offenders can literally "walk into" larcenies, however, committing them whenever an appropriate situation presents itself (i.e., whenever a suitable target and absence of guardians occur together). Also, larcenies include items that offenders seek for themselves (e.g., shoplifting) or items that offenders feel they can easily liquidate, including jewelry and electronics in addition to cash. The targets for larcenies seldom include used merchandise that burglars and robbers acquire, so the value to the larcenist is higher. Unlike autos, the goods acquired during larcenies can be easily hidden until they are converted into cash. Larcenies are stealth crimes, but seldom involve the risks of burglaries, and offenders can target large businesses which allow them to rationalize their behavior by believing that the theft will not harm the victim. Finally, larcenies represent a lower commitment to crime than the other forms of property crime. Ironically, larcenies may be less likely than other property crimes to decline due to increases in unemployment rate because unemployment means fewer workers to protect a store' s stock and property (despite the increased numbers of potential offenders). Larcenies, then, seem to be a preferable means of dealing with financial exigencies imposed by unemployment. They are lower in terms of physical risk to the offender (retaliation by victims, for example, seldom involves serious bodily harm) and the risk of apprehension can be regulated somewhat by the offender simply by moving to more desirable theft locations (e.g., to avoid security personnel or devices). That the goods obtained through larceny are typically new and can be assessed before (versus after) the crime increases the offender’s ability to predict the specific gain from any particular larceny. For these reasons, we expect the motivation effect to be much larger than the opportunity effect-- slight decline initially, followed by an increase well before the other three property crimes experience an increase. As argued above, as the anticipated interplay of motivation and opportunity factors differs by type of property crimes, we would also expect the unemployment-crime linkages to vary across the types of crimes. The research question explored is whether there are differences in the spatial patterns of unemployment crime linkages across these four property crimes. The expectations discussed above are
14
This document is a research report submitted to the U.S. Department of Justice. This report has not been published by the Department. Opinions or points of view expressed are those of the author(s) and do not necessarily reflect the official position or policies of the U.S. Department of Justice.
essentially speculative – there is very little known about the differences in response of crimes to changes in unemployment across type of crime. This is why we need an exploratory approach.
4.2
Resource Deprivation as a Potential Moderator of Unemployment-Crime Linkages One neglected factor in studies of the connections between unemployment and crime is the
potentially important role played by resource deprivation. Although it seems logical that unemployment and crime rates are related, U-C linkages may differ between communities based on the varying levels of resource deprivation present in those communities. Although our focus in this grant is on resource deprivation, there may be a number of other community contextual factors (e.g., prevalent industry type, level of religiosity, population density) that form part of the social explanation for crime. The most logical indicator of community context for the purposes of predicting crime, however, is resource deprivation because it is directly tied to both economic motivation and opportunity. It is important to note that each community has a unique tolerance level that reflects the degree of resource deprivation, crowding, safety nets, and other social factors already present in the community before unemployment rates are considered. The role of safety net thresholds must also be understood in order to fully comprehend the role of resource deprivation in U-C linkages. Safety net programs or organizations can prevent or delay the negative effects of unemployment in those communities that have them. Increased unemployment, although potentially devastating to some communities, may have minimal effects in communities characterized by strong social safety nets (and low levels of resource deprivation) that assist the recently unemployed with basic living costs. These safety nets may be societal, for example, agencies that provide short-term funding for financial s rent or pay for emergency medical needs), job location emergencies (e.g., an immediate need to pay one' services, job retraining, or a host of other services. Safety nets also include more individualized factors, s savings account balance and the amount of short-term assistance the such as an individual worker' worker can expect from family and friends. The specific safety net thresholds will vary by location, meaning that some communities will be better able to accommodate their recently unemployed; the distribution of safety nets is far from random, tied instead to the social descriptors and dynamics of individual communities. All communities have some safety net(s) in place, but each can tolerate only so many clients before it collapses or is unable to serve everyone who is in need of assistance.
15
This document is a research report submitted to the U.S. Department of Justice. This report has not been published by the Department. Opinions or points of view expressed are those of the author(s) and do not necessarily reflect the official position or policies of the U.S. Department of Justice.
In communities with at least some safety net to cushion the deleterious effects of unemployment, crime increases may be delayed as former workers are not motivated into crime until their resources are depleted and they become more desperate. Communities with stable safety nets may effectively prevent most, if not all, crime increases from unemployment if they are able to buoy their recently unemployed citizens for the entire term of their unemployment. Resource deprivation and community poverty are not entirely new factors in the routine activity diorama. Wilcox, Land, and Hunt (2003, pp. 89-90), for example, note the injurious effects of increased community-level poverty and other factors related to social disorganization. One view is that communities characterized by increased social disorganization are less able to form adequate networks of capable guardians. Wilcox, Land, and Hunt (2003, p. 89) note that social ecological factors (several of which could be considered measures of resource deprivation) can help explain criminality in communities: “Social disorganization scholars, for instance, have suggested that factors such as community-level poverty rates, community-level ethnic heterogeneity, community-level mobility rates, and community-level family disruption (e.g., percentage of divorced, percentage of female-headed households) are related to higher rates of community crime because such characteristics impede the formation of communitywide values, social ties, and informal control practices.” Such a viewpoint argues for the direct impact of resource deprivation on crime rates. However, this does not imply that the motivation effects in “disorganized” communities are necessarily higher during times of high unemployment. Instead, though they may certainly weather the deleterious effects of increased unemployment rates, socially disorganized communities have fewer self-protection mechanisms in place to shield themselves from negative economic circumstances. Such communities would have to draw on other resources (e.g., by strengthening their local faith-based communities) to help them survive unemployment rate increases. In communities characterized by higher levels of resource deprivation, the motivation effect may occur due to the loss or erosion (e.g., due to increased stress) of existing social support networks. On the other hand, the “additional” motivation effect in communities with extremely high levels of resource deprivation may not be especially strong because under “normal” conditions (i.e., before any increase in unemployment rates), the motivation to commit crime may already be high. It is not clear whether the motivation effect can increase in such communities because of a possible ceiling effect; research on the magnitude of change in motivation effect for communities with varying levels of resource deprivation has not yet been undertaken. However, there is limited empirical work on the relationship between resource
16
This document is a research report submitted to the U.S. Department of Justice. This report has not been published by the Department. Opinions or points of view expressed are those of the author(s) and do not necessarily reflect the official position or policies of the U.S. Department of Justice.
deprivation and motivation and this body of research shows that increases in resource deprivation generally result in increased motivation to commit crimes. The more intriguing theoretical question concerns the opportunity effect: Do poorer communities have a more pronounced reduction in crime rates following the opportunity effect? We believe that there is a need to explore this question because, when viewed theoretically from a framework that balances motivated offenders, suitable targets and increased guardianship, this may not be a straightforward proposition. Clearly, the number or proportion of suitable targets should be much lower in locations characterized by high levels of resource deprivation. Another point is that, during times of high unemployment, it can be argued that poorer communities may see an increase in guardianship networks. Because there is very limited research on changes in guardianship between good and bad times, one rather speculative point is that unemployment may have more negative consequences in poorer communities, leading them to “rally around” more for support. This “rallying around” may not occur or may be downplayed in much wealthier areas, due in part to the structure of income on those areas (e.g., including financial investments in addition to— or in place of— employment) and the larger potential for savings accounts, credit availability, and other planned methods of coping with income loss. A general speculative idea is that guardianship is both dynamically and contextually driven. Thus, during bad times, it may be poorer communities that might see the most increases in guardian networks. Under these circumstances, it is possible that the juxtaposition of a low supply of motivated offenders, low supply of targets, and high guardianship (see context 4 in Wilcox, Land, and Hunt, p. 116) corresponds to a relatively unfavorable environment for criminal acts to occur. The opportunity effect is driven by both low supply of targets and high guardianship. Poorer communities initially have both of these; thus, during times of high unemployment, changes in unemployment should have an initial strongly negative effect on crimes in poorer places.
17
This document is a research report submitted to the U.S. Department of Justice. This report has not been published by the Department. Opinions or points of view expressed are those of the author(s) and do not necessarily reflect the official position or policies of the U.S. Department of Justice.
5. METHODOLOGICAL APPROACH
5.1
Data The information on unemployment rates was obtained from the U.S. Department of Labor’s
Bureau of Labor Statistics web site. Annual data were available for unemployment rates for 1995 to 2000. Information on reported crime rates was obtained from the Geospatial and Statistical Data Center of the University of Virginia from data collected by the United States Department of Justice – Federal Bureau of Investigation. While the FBI’s Uniform Crime Reports have been criticized for being an invalid indicator of the true amount of crime, they can, “for most purposes,” be considered a valid measure of non-minor offending such as index crimes, especially those committed by strangers (Gove et al., 1985, p. 451). Finally, information on both age distributions and measures used in the resource deprivation scale was obtained from the county-level census files of the Geospatial and Statistical Data at the University of Virginia.
5.2
Measures Following Land, McCall, and Cohen (1990), a principal components scale was developed to
measure resource deprivation/affluence component (RDAC). Using census data from 1990, following the approach utilized by Land et al .(1990), this measure was created from a combination of the following measures: logged median family income, percentage of families living below the poverty line, and percentage of African-American residents. Land et al., (1990) also implemented a principal component scale to develop a measure of RDAC that includes the following measures: median family income (logged), a Gini index of family income, percentage of African-American residents, percent of families below poverty, and percent of female-headed families. The differences and the choice of our measures for the RDAC scale were driven by data availability. Given the substantive focus of this grant, we focus on crimes classified as property crimes under the Uniform Crime Reports (burglary, larceny, motor vehicle theft, and robbery). We also focus on total index crimes. The Crime Index total is the sum of selected serious offenses including murder and non-negligent manslaughter, rape, robbery, aggravated assault, and three property crimes (i.e., burglary, larceny-theft, and motor vehicle theft). This additional focus on index crimes is justified because the
18
This document is a research report submitted to the U.S. Department of Justice. This report has not been published by the Department. Opinions or points of view expressed are those of the author(s) and do not necessarily reflect the official position or policies of the U.S. Department of Justice.
reporting rates are most valid for index crimes; reporting rates decline rapidly as offenses become less serious, making accurate model estimation more and more difficult.2
5.3
Methods We begin the discussion with some concepts from ESDA. Both global and local measures of
spatial association are described. Then we describe the ESDA applications with raw data and multilevel models.
5.3.1
ESDA Methods ESDA techniques were used to study both the global and the local context of unemployment
rates, index crimes, and resource deprivation. One of the difficulties in studying space is defining spatial proximity. Defining proximity is not a trivial issue and poses considerable methodological challenges. For example, consider Figure 4 --defining the neighbors of the cell labeled “5” is a significant problem because one can arrive at a different definition of “neighbors” depending on the criteria one uses. To illustrate, if one likens Figure 4 to a chessboard, movement of different levels of chess pieces can lead to very different definitions of neighbors; entirely different subsets of “neighbors” exist for a rook versus a bishop chess piece. The concern is further compounded by the fact that, in most research problems, there are both a large number of units of analysis and far more irregular shapes than occur in Figure 4. Given such difficulties, geographical information systems have been especially useful in defining proximity. A variety of proximity measures including contiguity, distance-based, and nearest neighbor measures of proximity (Anselin, 1995) may be implemented within the ESDA framework. ESDA is implemented using the GeoDa software (Anselin, 2003). GeoDa provides a very user-friendly environment to implement ESDA methods and is freely downloadable off the Internet.
2
The reporting rates for crimes tend to be low, especially for nonserious crimes. Only 35 percent of all crimes and fewer than half of felonies are reported to authorities (Bureau of Justice Statistics, 2000, p. 94).
19
This document is a research report submitted to the U.S. Department of Justice. This report has not been published by the Department. Opinions or points of view expressed are those of the author(s) and do not necessarily reflect the official position or policies of the U.S. Department of Justice.
What are the neighbors of 5?
1
2
3
4
5
6
7
8
9
Rook Cr iter ia : 2 , 4 , 6 , 8 Bis h op Cr it er ia : 1 , 3 , 7 , 9 Qu een Cr it er ia : 1 , 2 , 3 , 4 , 6 , 7 , 8 , 9
Figure 4. The challenge of defining a neighbor Both global and local measures of spatial association are used in ESDA. Global measures of association, such as the Moran’s I, provide an average measure of spatial association (a single measure is obtained for all of the counties/cities). Local measures of spatial association provide a measure of association for each county/city—these are implemented using the so-called Local Indicators of Spatial Association (LISA; Anselin, 1995). The Local Moran’s I coefficient is used as an indicator of local spatial association. As described below, this measure can be used as a measure of indicator of local spatial clusters and as a diagnostic for local instability. The global measure of Moran’s I is defined as:
I = ƒi
ƒ
j
wij .( xi − µ ).( x j − µ ) / ƒi (xi − µ ) 2
where wij is the row-standardized contiguity matrix, xi is the measure at county i, and xj is the measure at neighboring county j, and µ is the average level of risk.
20
This document is a research report submitted to the U.S. Department of Justice. This report has not been published by the Department. Opinions or points of view expressed are those of the author(s) and do not necessarily reflect the official position or policies of the U.S. Department of Justice.
The local measure of Moran’s I at county i is defined as:
I =
( xi − µ ) ƒ (xi − µ ) 2
ƒ w .( x ij
j
− µ)
j
Note that the global Moran’s I provides a single value of association across all of the counties and cities. However, a unique value of spatial association is obtained for the local Moran for each county “i.”
5.3.2
ESDA Tools Although multiple tools are available within the ESDA approach, we focus on three tools
that are especially useful in our study: the Moran scatterplot map, the Moran scatterplot, and the Moran significance map. We also describe the spatial weights matrix and the steps involved in the proposed methodology. Our treatment of each of these tools is brief; Anselin (1995; 1998) provides a far more detailed discussion of these concepts.
5.3.3
The Moran Scatterplot Map The Moran scatterplot map incorporates information from individual counties, neighboring
counties, and a global average of the measure. A typology of four clusters of counties is developed in the Moran scatterplot map. Note that the terms “high” and “low” are defined relative to the global mean. “High” implies higher than the average, while “low” implies lower than the average. In this grant, the term “counties” includes both counties and cities as these are independent entities in Virginia.3 The typology consists of the following four clusters: ¢
¢
High-High – high value of a measure surrounded by counties that have high values of the measure (positive association); Low-High – low value of a measure surrounded by counties that have high values of the measure (negative association);
3 As an example see the USGenWeb Census Project website: “Virginia is the only state with independent cities. They are independent of the county or counties in which they are geographically located. Independent cities have existed in Virginia since 1722, though the degree of independence has varied. In the past some cities were enumerated separately from their adjoining counties; others with earlier dates of town status have no surviving censuses prior to 1900 that are separate from their adjoining counties. “
21
This document is a research report submitted to the U.S. Department of Justice. This report has not been published by the Department. Opinions or points of view expressed are those of the author(s) and do not necessarily reflect the official position or policies of the U.S. Department of Justice.
¢
¢
5.3.4
Low-Low – low value of a measure surrounded by counties that have low values of the measure (positive association); and High-low – high value of a measure surrounded by counties that have low values of the measure (negative association).
The Moran Scatterplot The Moran scatterplot adds more information to the Moran scatterplot map discussed above.
In the Moran scatterplot, the standardized value of a measure (e.g., unemployment rate) is plotted against the weighted average of the standardized value of the measure among the neighboring counties. The point’s location in the quadrant determines whether it is located in the “high-high,” “low-low,” “high low,” or “low-high” categories in the Moran scatterplot map.4
5.3.5
The Moran Significance Map The Moran significance map builds on the Moran scatterplot and incorporates information
about which of the clusters are statistically significant. Complex permutation methods (Anselin, 1994) are used to conduct the tests of significance. In practice, this is achieved by randomly permuting the observed values over all the locations and calculating the local Moran statistic for each new permutation (Anselin, 1995). The significance of the local Moran statistic is determined by generating a reference distribution using 999 random permutations.
5.3.6
Spatial Weights Matrix The effects of spatial proximity are operationalized through the spatial weights matrix (see
Anselin, 1995; Messner et al., 1999). A number of spatial matrices were considered in the present application.5 The results are conditional on one’s choice of the spatial weights matrix. We chose the six nearest neighbors’ spatial weights matrix. The six neighbors reflect the average for the country: counties in the United States have an average of five to six neighbors. We chose the nearest neighbor criterion in 4
The slope of the Moran scatterplot is the global Moran’s I.
5
These matrices included the rook criteria, queen criteria, distance-based contiguity with distance between center less than 35 miles, and four and six nearest neighbors.
22
This document is a research report submitted to the U.S. Department of Justice. This report has not been published by the Department. Opinions or points of view expressed are those of the author(s) and do not necessarily reflect the official position or policies of the U.S. Department of Justice.
developing the spatial weights matrix because Virginia has 23 counties that have only one neighbor. This can significantly disrupt the spatial analysis if we consider only the contiguity criteria. Allowing a fixed number of counties avoids methodological problems that could arise when the number of neighboring counties is allowed to vary. The robustness of the results was checked by considering multiple spatial matrices including four nearest neighbors, the rook contiguity, and queen contiguity matrices.
5.4
Exploratory Spatial Data Analysis with Raw Data As a first step, we implement ESDA techniques to study the spatial distributions of crimes
and unemployment rates. This allows us to identify locations of spatial clusters of significant excess incidence of crimes and unemployment rates. The ESDA analysis of the raw data does not allow us to study the unemployment-crime linkages; in order to study those components, we examine the spatial properties of the county-level coefficients obtained from the multilevel models.
5.5
ESDA of County-Level Coefficients from the Multilevel Models As described below, the multilevel models are implemented to study U-C linkages. The
ESDA methods are then implemented to study the spatial distributions of the county-level coefficients. The implemented ESDA consisted of the following steps:
5.6
1.
Obtain county-specific unemployment-coefficients for each of the crimes.
2.
Study Global and Local Moran properties of each of the above coefficients.
3.
Explore correlations between resource deprivation and each of the county-specific unemployment-crime coefficients for each of the crimes.
Multilevel Models The multilevel models are implemented using hierarchical linear models (HLM; Raudenbush
and Bryk, 2002). The multilevel models focus on both within-county variations (over time) and between-
county linkages between unemployment and crime rates. The analytical focus is on modeling the trajectories of crime rates as a function of unemployment rates. Annual data from Virginia’s 135
23
This document is a research report submitted to the U.S. Department of Justice. This report has not been published by the Department. Opinions or points of view expressed are those of the author(s) and do not necessarily reflect the official position or policies of the U.S. Department of Justice.
counties/cities for unemployment and index crimes for 1995-2001 were used in the computations. Given our exploratory focus, we did not attempt to disentangle the motivation and opportunity components. Note that other more complex multilevel models could also have been estimated using multilevel models – as an example, following Cantor and Land, both a lagged unemployment and contemporaneous effect could also have been estimated. However, given our exploratory focus, we attempted to keep the multilevel model as simple as possible. The implemented approach allows us to find a county-specific contemporaneous effect of unemployment on the various crimes for each of Virginia’s counties and cities. The global and local spatial patterning in the county-specific coefficient is then examined for each of the property and index crimes.
5.6.1
Level-1 Model
Using the language of multilevel models (Raudenbush and Bryk, 2002), the analysis focuses on two levels. At level 1, we were interested in examining the strength and direction of the relationship between unemployment and crime for each county “i” (i=1,135). For each county, the time-varying unemployment rate was used to explain changes in the crime rate over time. A trend variable was used to model the trajectory of index crime rates. The trends in unemployment and index crime rates show a similar pattern. A downward trend is seen between 1995 and 2000 (see Figures 5 and 6). The trajectory of crime rates included an intercept term (the model was parameterized such that the intercept was the adjusted crime level in 1995), a trend term, and a time-varying unemployment rate to measure the contemporaneous effect of unemployment on crime. Following standard practice in multilevel models (Raudenbush and Bryk, 2002), the contemporaneous effect of unemployment in each county was modeled as a deviation from its own mean (the county-level mean) between 1995 and 2001. The level 1 equation for county “i” (i=1,…135) and time “t” is: Cit = � o,i + �1,i.Trend + �2,i.(Ui,t - Ui,mean)+ �i
24
(1)
This document is a research report submitted to the U.S. Department of Justice. This report has not been published by the Department. Opinions or points of view expressed are those of the author(s) and do not necessarily reflect the official position or policies of the U.S. Department of Justice.
�o,i is a measure of the baseline adjusted (1995) index crime rate after controlling for other variables in the model in county “i”; �1,i is a measure of the trend in index crimes; �2,i is a measure of the contemporaneous unemployment crime linkage (as we are not trying to disentangle the motivation and opportunity coefficient, it may pick up on a summed motivational and opportunity effects of employment). Our primary analytical objective is to understand the spatial properties of �2,i. Note from equation (1), 135 �o,i, and �2,i coefficients (one each for each of Virginia’s counties/cities) are obtained. 3000.00
Mean Index Crime Rate
2900.00
2800.00
2700.00
2600.00
2500.00
2400.00
2300.00 1995
1996
1997
1998
1999
2000
year
Figure 5. Index crime rates—1995-2000 6.00
5.50
Unemployment
5.00
4.50
4.00
3.50
3.00 1995
1996
1997
1998
1999
2000
year
Figure 6. Unemployment rate—1995-2000
25
This document is a research report submitted to the U.S. Department of Justice. This report has not been published by the Department. Opinions or points of view expressed are those of the author(s) and do not necessarily reflect the official position or policies of the U.S. Department of Justice.
5.6.2
Level-2 Model At the second level (also called level-2 model in HLM terminology), the county-level 1 (�o,i)
intercept coefficient was linked to fixed predictors (primarily demographic variables). Specifically, following Bryk and Raudenbush (2002), including such level-2 measures provides controls for betweencounty differences at the baseline due to structural or demographic characteristics. The level-2 model has the following structure:
�0,i = �0,0 + ∑ �0,i.Wi + u0 where Wi includes the following measures: ¢ ¢
¢
¢ ¢
6
Mean unemployment rates for county “i” between 1995 and 2000; Population structure: Nonlinear principal component analysis6 was used to develop a population structure scale comprising the following measures: logged population size from 1997, logged population density from 1997, and jurisdiction type (i.e., whether a jurisdiction was a city or a county); Age distributions: Percentage population under age 5, percent population between 5 and 17 years of age, percent population between 18 and 20 percentage; percent population between 21 and 24 years of age; and Resource deprivation. Region: The state is divided into three administrative regions by the Virginia Department of Juvenile Justice—western region, which is primarily rural; the northern, which includes the high density regions around Washington, DC that are primarily suburban; and the eastern region, which includes both rural and high density regions around Norfolk and Virginia Beach. Dummy measures for region are also included.
Nonlinear principal component analysis was used instead of linear principal component analysis because the measures were at mixed levels of measurement—the population and population measures were numeric, while the city measure was nominal.
26
This document is a research report submitted to the U.S. Department of Justice. This report has not been published by the Department. Opinions or points of view expressed are those of the author(s) and do not necessarily reflect the official position or policies of the U.S. Department of Justice.
The trend term is modeled as fixed across the counties.
�1,i = �10 �2 is modeled as randomly varying across the counties. �20 is an estimate of the “global” contemporaneous effect of unemployment on crime.
�2,i = �20 + u2 Note that other important covariates could also be used to model �2,i. However, given our exploratory focus, the primary goal is to understand the spatial patterns of the coefficients. We do not include other between-county covariates to model this coefficient.
5.7
Summary of Process The overall process by which the multilevel models and ESDA are integrated is described in
Figure 7. First, multilevel models are implemented to obtain county-level coefficients linking unemployment to crime. Then the spatial properties of such county-level coefficients (both local and global) are examined. Finally, the correlations between the obtained unemployment-crime coefficient and resource deprivation are examined for each of the crimes.
Multilevel Models
Global Moran's I Contemporaneous Effect
Local Moran's I Correlations with Resource Deprivation
Figure 7. Process of integrating multilevel models with ESDA
27
This document is a research report submitted to the U.S. Department of Justice. This report has not been published by the Department. Opinions or points of view expressed are those of the author(s) and do not necessarily reflect the official position or policies of the U.S. Department of Justice.
6. RESULTS
The results are discussed in three sections: (6.1) ESDA with raw data; (6.2) ESDA of unemployment-crime coefficients obtained from the multilevel model; and (6.3) relationship between unemployment-crime coefficient and resource deprivation.
6.1
ESDA with Raw Data The spatial patterns of the average levels of unemployment and each of the crimes between
1995 and 2000 were first examined separately. Table 1 presents the global Moran’s I for average levels of unemployment and crimes. The global association for each of these measures was significant at the 0.05 level, using the six nearest neighbor spatial weight. Statistically significant global associations were also obtained with other spatial weights matrices including the four nearest neighbors, queen and rook contiguity weights (results not shown). This indicates that the distribution of unemployment and crime rates is not random and has a spatial structure. The spatial patterning is especially discernible by examining the local spatial patterns for each of the measures (see Figures 8 to 13). Figure 8 shows the spatial pattern of average unemployment rates. Most of the “low-low” unemployment rate areas are in the northern region close to Washington, DC, while the “high-high” unemployment areas are in the southwestern areas, close to the Kentucky and Tennessee borders. Figures 9 to 12 show the local spatial patterns for each of the property crimes. Figure 13 presents the spatial pattern of index crimes -- most of the “high-high” crime areas are in the southeastern region of the state around Norfolk and Richmond. The “low-low” areas of crime are in western and central Virginia. The other crimes follow a somewhat similar pattern with some exceptions: for larceny (Figure 10) and motor vehicle theft (Figure 11), a high-high pattern is also present near the Washington, DC area.
28
This document is a research report submitted to the U.S. Department of Justice. This report has not been published by the Department. Opinions or points of view expressed are those of the author(s) and do not necessarily reflect the official position or policies of the U.S. Department of Justice.
Table 1.
Global Moran’s I for average unemployment and crime rates from 1995 to 2000 Unemployment Rate Burglary Larceny Motor Vehicle Theft Robbery Index Crimes
0.52** 0.24** 0.22** 0.30** 0.31** 0.24**
** p