ical in the case of Agile Global Software Development (AGSD) in ..... short meetings and on-line or audio conference calls were often used. Korkala and Maurer have ... used to support GSD communication should be specific, because teams ... in five steps: study design, preparation for data collection, collecting evidence ...
If referenced, this paper should be cited as
Agustin Yagüe, Juan Garbajosa, Jessica Díaz, Eloy González, An exploratory study in communication in Agile Global Software Development, Computer Standards & Interfaces, Volume 48, November 2016, Pages 184-197, ISSN 0920-5489, http://dx.doi.org/10.1016/j.csi.2016.06.002. (http://www.sciencedirect.com/science/article/pii/S09205489 16300381) @article{Yagüe2016184, title = "An exploratory study in communication in Agile Global Software Development ", journal = "Computer Standards & Interfaces ", volume = "48", number = "", pages = "184 ‐ 197", year = "2016", note = "Special Issue on Information System in Distributed Environment ", issn = "0920‐5489", doi = "http://dx.doi.org/10.1016/j.csi.2016.06.002", url = "http://www.sciencedirect.com/science/article/pii/S0920548916300381", author = "Agustin Yagüe and Juan Garbajosa and Jessica Díaz and Eloy González", keywords = "Global Distributed Software Development", keywords = "Agile", keywords = "Exploratory research", keywords = "Tools and technologies", keywords = "Infrastructure ", }
������� �� �� �� An exploratory study in communication in Agile Global Software Development Agustin Yag¨ue, Juan Garbajosa, Jessica D´ıaz, Eloy Gonz´alez PII: DOI: Reference:
S0920-5489(16)30038-1 doi: 10.1016/j.csi.2016.06.002 CSI 3113
To appear in:
Computer Standards & Interfaces
Received date: Revised date: Accepted date:
31 March 2015 18 May 2016 5 June 2016
Please cite this article as: Agustin Yag¨ ue, Juan Garbajosa, Jessica D´ıaz, Eloy Gonz´ alez, An exploratory study in communication in Agile Global Software Development, Computer Standards & Interfaces (2016), doi: 10.1016/j.csi.2016.06.002
This is a PDF file of an unedited manuscript that has been accepted for publication. As a service to our customers we are providing this early version of the manuscript. The manuscript will undergo copyediting, typesetting, and review of the resulting proof before it is published in its final form. Please note that during the production process errors may be discovered which could affect the content, and all legal disclaimers that apply to the journal pertain.
An Exploratory Study in ACCEPTED MANUSCRIPT
Communication in Agile Global Software Development Agustin Yague ¨ and Juan Garbajosa
IP
Abstract
T
and Jessica D´ıaz and Eloy Gonzalez ´
AC CE P
TE
D
MA
NU S
CR
Global software development (GSD) is gaining ever more relevance. Although communication is key in the exchange of information between team members, multi-site software development has introduced additional obstacles (different time-zones and cultures, IT infrastructure, etc.) and delays into the act of communication, which is already problematic. Communication is even more critical in the case of Agile Global Software Development (AGSD) in which communication plays a primary role. This paper reports an exploratory study of the effects of tools supporting communication in AGSD. More precisely, this paper analyses the perception of team members about communication infrastructures in AGSD. The research question to which this study responds concerns how development teams perceive the communication infrastructure while developing products using agile methodologies. Most previous studies have dealt with communication support from a highly technological media tool perspective. In this research work, instead, observations were obtained from three perspectives: communication among team members, communication of the status of the development process, and communication of the status of the progress of the product under development. It has been possible to show that team members perceive advantages to using media tools that make them feel in practice that teams are co-located, such as smartboards supported by efficient video-tools, and combining media tools with centralized repository tools, with information from the process development and product characteristics, that allow distributed teams to effectively share information about the status of the project/process/product during the development process in order to overcome some of the still existing problems in communication in AGSD.
1. Introduction Global software development (GSD) is gaining in relevance and importance. Although communication is key in the exchange of information between team members, multi-site software development has introduced additional obstacles (different time-zones and cultures, IT infrastructure, etc.) and delays into the act of communication, which is already problematic [1]. Mishra et al. [2] reported that a project developed by distributed teams may take up 2.5 times more effort than one developed by co-located teams. None of these obstacles are new, and several were reported as early as 2003 [3]; however, recent studies and reviews have shown that they are still cause of concern [1, 4]. Communication is even more critical in the case of Agile Global Soft-
IP
Abstract
T
ACCEPTED MANUSCRIPT
AC CE P
TE
D
MA
NU S
CR
Global software development (GSD) is gaining ever more relevance. Although communication is key in the exchange of information between team members, multi-site software development has introduced additional obstacles (different time-zones and cultures, IT infrastructure, etc.) and delays into the act of communication, which is already problematic. Communication is even more critical in the case of Agile Global Software Development (AGSD) in which communication plays a primary role. This paper reports an exploratory study of the effects of tools supporting communication in AGSD. More precisely, this paper analyses the perception of team members about communication infrastructures in AGSD. The research question to which this study responds concerns how development teams perceive the communication infrastructure while developing products using agile methodologies. Most previous studies have dealt with communication support from a highly technological media tool perspective. In this research work, instead, observations were obtained from three perspectives: communication among team members, communication of the status of the development process, and communication of the status of the progress of the product under development. It has been possible to show that team members perceive advantages to using media tools that make them feel in practice that teams are co-located, such as smartboards supported by efficient video-tools, and combining media tools with centralized repository tools, with information from the process development and product characteristics, that allow distributed teams to effectively share information about the status of the project/process/product during the development process in order to overcome some of the still existing problems in communication in AGSD.
1. Introduction Global software development (GSD) is gaining in relevance and importance. Although communication is key in the exchange of information between team members, multi-site software development has introduced additional obstacles (different time-zones and cultures, IT infrastructure, etc.) and delays into the act of communication, which is already problematic [1]. Mishra et al. [2] reported that a project developed by distributed teams may take up 2.5 times more effort than one developed by co-located teams. None of these obstacles are new, and several were reported as early as 2003 [3]; however, recent studies and reviews have shown that they are still cause of concern [1, 4]. Communication is even more critical in the case of Agile Global Soft-
T
ACCEPTED MANUSCRIPT
AC CE P
TE
D
MA
NU S
CR
IP
ware Development (AGSD) in which communication plays a primary role. According to the Agile Manifesto, “Business people and developers must work together daily throughout the project”[5]. Communication problems in AGSD have also been broadly addressed in the literature [4, 6, 7], which has shown that distributed teams, particularly agile teams, strongly depend on tools for communication [4, 7, 8]. Although the optimal technological tool for supporting efficient communication in AGSD has been explored in several studies, it is still an unresolved issue [1, 4, 7, 8, 9]. This paper reports an exploratory study of the effects of communication elements in AGSD. More precisely, this paper analyses communication infrastructures and how they impact AGSD. Here, the term “communication infrastructure” refers to the software, hardware, development process and installations needed to enable communication among distributed sites. The research question that this study responds concerns how the development team perceives the communication infrastructure while developing products using agile methodologies. Most of the previous studies have dealt with the support of communication with a media tool from a technological perspective. In this research work, however, observations were obtained from three perspectives: communication among team members, communication of the status of the development process, and communication of the status of the progress of the product under development, in accordance with Usman’s [10] recommendation. It has been possible to show that, to overcome some of the obstacles to communication in order to create a common ground (a concept deeply studied in [11]), it is advantageous to combine media tools (e.g. a continuously operating smartboard that displays the workplace while the team is working) with tools that allow distributed teams to share information about the status of the project during the development process; further, the discussions of the development process must always be evidencebased and data driven. This article is an extended version of [12]. The paper [12] has been fundamentally updated here by producing a much more detailed background regarding the communication and supportive tools in AGSD (Section 2) and extending the description of the research methodology and environment (Sections 3 and 4). Additional empirical data from observations have been also included. Section 5 describes the case study and provides details of developed projects and tables with data needed to support the more consolidated discussion in Section 7. Finally, Section 8 presents the conclusions and the work planned for the future.
T
ACCEPTED MANUSCRIPT
IP
2. Related research
AC CE P
TE
D
MA
NU S
CR
Communication is the process of imparting or exchanging of information by speaking, writing, or using some other medium such as video or pictures [13]. Communication is central in collaborating to exchange information among team members. Collaboration in the software development process is essential, as reported in [14]. Communication has been classified in many ways: spontaneous, informal versus formal, and synchronous versus asynchronous [8]. Synchronous and asynchronous means of communication are useful and complementary [8, 15]; however each method has different problems, as reported in various studies [16]. Communication has also been classified according to whether it is performed face-to-face or using technology (e.g., electronic media or the telephone). Face-to-face meetings facilitate spontaneous, bi-directional and synchronous communication. How to address spontaneous communication in projects developed in distributed environments is one challenge identified by Herbsleb et al [3]. In 1997, Carmel [17] pointed out that rich communication channels, mainly video and audio, are necessary in global software development in order to perform several activities such as problem-solving, architecting and design. Rich communication is defined as a two-way interaction involving more than one sensory channel. In global organizations, the implementation of communication to foster collaboration has been addressed in various ways, from the traditional, regular distribution of project information by electronic mail to the application of new technologies based on voice-over Internet Protocol (VoIP) or instant messaging to provide spontaneous communication [18]. Synchronous communication can be managed by enforcing regular meetings, but in the case of multi-site software development, it can introduce additional delays in terms of timely response, variations in time-zones and constraints on telecommunication bandwidth [19]. Thus, synchronous communication can require much longer periods of time than single-site development, which poses a challenge to this type of communication: regular meetings reduce many of the positive effects of informal meetings performed by co-located teams that initiate conversations without any special arrangements or schedule. In the case of distributed teams, such meetings could not be arranged as easily: tools are needed to provide the same, or at least similar, functionalities to enable remote members to participate in open discussions [20, 21]. To overcome the identified challenges, Herbsleb stated in 2003 that GSD should combine different communication media, such as telephone calls, teleconferences, emails, and instant messaging [3]. Niinimaki et al. [22] reviewed the way in which communication problems had been addressed in global
T
ACCEPTED MANUSCRIPT
AC CE P
TE
D
MA
NU S
CR
IP
organizations that used different media and systems by applying theories of media richness and media synchronicity. A comprehensive study on tools for GSD can be found in [18]. It revealed that communication tools based on Internet and VoIP protocols (e.g. Skype, or Google Hangout) enabled both one-to-one and one-to-many communication modes. A remaining challenge is the integration of communication tools to provide more or less the same services that are available in single-site projects. Johnston et al. [23] highlighted that Information and Communication Technologies (ICT) restrict communication because they are less rich than face-to-face communication. This explains why when development is distributed, the off-site members of a team tend to feel the lack of access to all information, while on-site members have direct access to information [23]. The impact of cloud infrastructure in agile distributed teams was reported in [24], the results of which showed that technical and cultural obstacles overlapped. Cultural obstacles refer not only to obvious issues, such as differences between Western and Eastern cultures, but also to different ways of understanding practices. Cultural differences have been also addressed in [25], and in [7]; this last reference is specially focused on agile. As explained in [8], communication grows in relevance when the software process model is agile. AGSD has drawn researchers’ attention because of the added complexity of combining agile and GSD [7], as informal and spontaneous communications plays a significant role in agile software development [7, 8]. Shrivastava [9] pointed out that one of the potential risks for distributed agile projects is the lack of communication between the team members, which could be addressed through team members’ use of tools, such as video conferencing and desktop sharing; and the use of scrum-of-scrum meetings between teams and the use of tools that support formal and non-verbal communication. The lack of communication infrastructure could be addressed by providing the team with multiple rich sources of communication. In the case of agile, many efforts have also focused on media tools and selection of media tools. One study on the impact of media selection [26] on AGSD reported that previous findings regarding media availability, media familiarity and infrastructure capabilities need to be considered. The media synchronicity theory was applied to select communication media in a global software company that used Scrum. The theory proved helpful in highlighting the important factors in choosing an appropriate electronic medium for conveying and converging communications; however, the theory did not manage to cover all important factors. Several other studies also addressed the effects of media on the team communication [27, 28]. Paredes et al. [29] reported the results of their systematic mapping study of the existing literature on information visualization techniques used by agile
T
ACCEPTED MANUSCRIPT
AC CE P
TE
D
MA
NU S
CR
IP
software development teams. The results showed that information radiators were common and effective for knowledge sharing in agile teams. Information radiators display relevant information about a managed project. A benefit of using information radiators is that the team needs little effort to create and understand visualizations, which helps to maintain a big picture of the project when teams are immersed in development activities. A recent study [30] presents the results of a survey that found that face-to-face conversations and email communications were the most popular communication channels among agile teams; these are similar to traditional development approaches. The findings also showed that short meetings and on-line or audio conference calls were often used. Korkala and Maurer have recently reported on the ”lack of involvement, lack of shared understanding, outdated information, restricted access to information and finally scattered information” [8]. In addition, Kropp et al. [11] recently confirmed that decorated tools alone did not enhance communication, as the quality of the communication during meetings depended on the person speaking and the message conveyed. Looking for alternative proposals to those that address communication mainly from a media perspective, K¨aa¨ ri¨ainen [31] addressed communication by focusing on centralized infrastructures, finding that these were useful in AGSD frameworks for sharing information, which facilitates team communication. However, K¨aa¨ ri¨ainen [31] also pointed out that some tools used to support GSD communication should be specific, because teams are not physically co-located. Recently, Usman [10] reported that it was necessary to address the following challenges that affected different phases of software development: i) to monitor the processing of software to enhance relationships among teams and customers; ii) to support the needs of communication at different stages of software development (from management to implementation); iii) to monitor the status of the product during the problem-solving and design phases of the project. The conclusion that can be drawn from this review is that work thus far has mainly focused on media tools and has not fundamentally solved the communication problems in AGSD. Therefore, exploratory studies that address new approaches, not exclusively focused on media tools, are required to advance communication if AGSD.
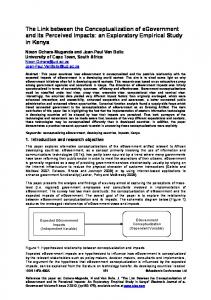
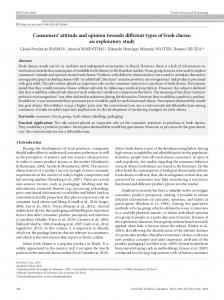
3. Research methodology This research was designed following the guidelines and steps proposed by Runeson and Host ¨ [32] for conducting case studies. It was structured in five steps: study design, preparation for data collection, collecting evidence, data analysis and reporting (see Clip 1).
CR
IP
T
ACCEPTED MANUSCRIPT
NU S
Clip 1: Research design process
MA
The following subsections describe how this research was designed, how data were collected and, how the data were analyzed. 3.1. Research design
AC CE P
TE
D
Section 2 discussed how, in the case of distributed teams, off-site members perceived a lack of communication when developing software in distributed environments. It was also reported that this lack of communication was more serious in the case of AGSD. Whereas most of the previous studies tackled communication from a mainly technological media perspective, the present research is focused on identifying the perceptions of developers, as an initial step, and before assuming a fixed and controlled context. Software Engineering perceptions have been recently considered in [33]. Years before, Vroom [34] developed the Expectancy Theory and Adams [35] the Equity Theory. Both theories indicate that a positive perception results in better performance, as recently discussed in [36]. To implement this approach, the work by Usman et al. [10], with the three perspectives of communication, was set as the starting context (Subsection 2). The research goal can be formulated as “How development teams perceive the communication infrastructure while developing products using agile methodologies”. It is intended with this research to determine whether the communication infrastructure is perceived as a driver to reduce the existing communication gap between team members along Usman’s dimensios in AGSD. Considering the three perspectives of communication, this general research goal was split into the following research questions: “How do off-site members in an Agile project perceive that communication infrastructure enhances team relationships?(RQ1)”, “How is the communication infrastructure perceived to support the development process at different stages in an agile project?(RQ2)” and “How is communication infrastructure perceived to support project status information-sharing in an agile project? (RQ3)”. Due to the nature of the research topic and the objectives, the research team agreed to conduct the research using an exploratory sequential mixed approach following the Cresswell’s recommendations [37, pag. 266–274]. An exploratory sequential mixed
T
ACCEPTED MANUSCRIPT
AC CE P
TE
D
MA
NU S
CR
IP
methods first begins by exploring with qualitative data and analysis and later uses the findings in a second quantitative phase. In our research the first phase was focused on reviewing the role of communication infrastructures through an extensive literature study to identify reported measures, and software applications that enable communication from each analyzed perspective. This review resulted in a list of measures with different targets. Details about the measures can be found in Subsection 3.3. The second phase was based on obtaining quantitative measures about perceptions on and use of communication infrastructures to identify findings about the topic under research. The study of the usefulness of communication infrastructures in AGSD was conducted as an embedded case study in the way described by Yin [38] (a fixed context and different units of analysis conforming to the same case study). The units of analysis in this research were software projects implemented under the same context. This context was represented by communication infrastructures, where each element of the infrastructure was represented as independent variables as defined by Creswell [37] and the perception of the usefulness of these infrastructures for communication represented the dependent variables of this study; i.e., communication was influenced by infrastructures. The data collection strategy was based on the schema proposed by Lethbridge et al’. [39]. The observations made in this research were classified as first, second and third degree, following the classification system of Lethbridge et al. [39]. First-degree measures represent values obtained directly from teams, and therefore, they require direct access to teams; second-degree measures represent values provided by the context, requiring access to the environment where teams are working but with low interaction with teams; and third-degree measures represent complex values that require additional processing activities, requiring access to the developed artifacts. First-degree measures were collected through questionnaires answered by each team member. Focus group meetings were also used to complement data gathered from questionnaires. Second-degree measures were collected from tools (e.g., SonarQuBe) populated with data obtained from development. Third-degree measures were developed through processing the artifacts generated in each project, such as meeting duration or number of participants. Subsection 3.3 provides an in-depth explanation of how data were collected for each type of observation.
3.2. Types of measures Two types of measures were considered in this research: i) measures that helped the development team know the status of the project and the development process, and if needed, take corrective actions to make
T
ACCEPTED MANUSCRIPT
CR
IP
a project successful, and ii) measures needed to obtain accurate information on the perceptions of team members about the communication infrastructures and the overall development period. 3.2.1. Measures on project status
Measure
Type
Freq.
Redmine
Number of user stories
SD
Iteration
Redmine
Deployed user stories
SD
Iteration
SonarQuBe Lines of code
SD
Iteration
SonarQuBe Number of alerts
SD
Iteration
SonarQuBe Class complexity
SD
Iteration
SonarQuBe Test coverage
SD
Iteration
SVN
SD
Iteration
AC CE P
Tool
TE
D
MA
NU S
Measures about the status of the product and the process enable team members to know how the development team is working and whether the development methodology is properly applied. Herbsleb et al. [3, 40] highlighted the relevance of tracking information in projects where code is developed in more than one site, increasing the visibility of the work in progress [4]. In agile software development, Brede et al. [41] used agile artifacts, such as product backlogs, sprint backlogs, and burn-down charts to measure the level of work performed by a team. These measures, based on McCall’s model [42], Boehm [43] and international standards such as ISO 25000 [44], provide quantitative evidence of the status and quality of the product and the process and were taken from software tools like SonarQuBe, SVN and Redmine.
Number of commits
Table 1: Measures classified by tool. Tool gives the source of the measure. Measure describes the kind of data obtained. Type is SD = Seconddegree [39]. Column Freq = Frequency (when the measure is gathered). Some examples of these measures are: “lines of code”, “number of commits” (SVN), “average class complexity”, “number of builds”, “percentage of tasks done”, “number of errors”. In addition, to track how much additional information related to the product under development was shared by team members and to identify the most frequently used mechanisms, the following measures were used: “number of wiki inputs”, “number of news” and “number of shared documents”. Additionally, to monitor the process and to track how often team members
T
ACCEPTED MANUSCRIPT
MA
NU S
CR
IP
met during the project, the following measures were collected: “number of meetings” (daily, sprint planning, sprint review and retrospective), “meeting duration” (time) and “meeting participants”. Table 1 shows measures gathered to monitor the product under development and to provide evidence of the product during the development process. Table 2 shows a subset of the measures, classified by dimension, collected in this research to evaluate the use of the communication infrastructure through measures about process and product. Each row describes the measure, its type, the source of the measure, frequency (indicating how often it was collected) and the sources from which the measure was derived. The meaning of types of measures (first-degree, second-degree and third-degree) are explained in Subsection 3.3. Type Source
Freq.
Refs.
D
Dimension Measure
No. of meetings: daily, planning, ... Meeting duration (time) Meeting participants
AC CE P
Team commu nication
TE
Measures about process and product TD
Video
Iteration [41]
TD
Video
Meeting [41]
TD
Video
Meeting [41]
Develop ment Process
No. of artefacts cre- SD ated No. of Wiki inputs SD No. of News SD No. of documents SD
Redmine Project Redmine Project Redmine Project
[19] [19] [19, 41]
Product status
No. of SVN revisions No. of builds
SVN Jenkins
[19] [19]
SD SD
Redmine Iteration [19]
Project Project
Table 2: Measures classified by dimension. The Dimension represents the classes defined by Usman [10]. Measure describes the kind of data obtained. Type follows the classification by Lethbridge et al. [39] where FD = First-degree, SD = Second-degree and TD = Third-degree. Column Freq = Frequency (when the measure is gathered). Quest = questionnaire. Refs = references (indicates literature supporting the measure). 3.2.2. Measures on team perception Measures to determine how the team perceived the usefulness of the communication infrastructures and the overall development period were identified from the literature. These measures were applied to get findings to answer the following proposed research question: “How develop-
T
ACCEPTED MANUSCRIPT
D
MA
NU S
CR
IP
ment teams perceive the communication infrastructure while developing products using agile methodologies?” These measures were structured according to three dimensions (see Subsection 3.1): team member communication, communication of the development process, and communication of the product status. Team member communication measures addressed the effect of the communication infrastructure on team information-sharing and its effectiveness in AGSD. Kamaruddin et all [19] reported that many issues affect communication models, such as communication tools, communication of requirements and communication about product quality. Brigss et al. [45] concluded that satisfaction with meetings is an important measure of the effectiveness of collaboration technologies. They argued that this satisfaction can be influenced by the procedures and tools used in meetings. Therefore, satisfaction was considered at different levels.
TE
Dimension Measure
Develop ment Process Product status
Source
Freq.
Refs.
Measures about perceptions
Meeting satisfaction level Communication channels rate Communication channels usefulness
FD
Quest
Project [45]
FD
Quest
Project [19, 22]
FD
Quest
Project [22]
Comm. mechanism satisfaction Communication mechanism rate Comm. mechanism usefulness
FD
Quest
Project [45]
FD
Quest
Project [45, 46]
FD
Quest
Project [45, 47]
Communication mechanism rate Comm. mechanism usefulness
FD
Quest
Project [22, 45]
FD
Quest
Project [45]
AC CE P Team commu nication
Type
Table 3: Measures classified by dimension. Dimension represents the classes defined by Usman [10]. Measure describes the kind of data obtained. Type follows the classification by Lethbridge et al. [39] where FD = First-degree, SD = Second-degree and TD = Third-degree. Column Freq = Frequency (when the measure is gathered). Quest = questionnaire. Refs = references (indicates literature supporting the measure).
T
ACCEPTED MANUSCRIPT
AC CE P
TE
D
MA
NU S
CR
IP
Communication of the development process addresses the effect of the infrastructure on the development process and information-sharing and the usefulness of these infrastructures to support the development process in AGSD. Following the vision proposed by Brigss et al. [45], it is important to focus on those mechanisms used by teams to communicate: how the development process is run and how feedback is received, as well as the effectiveness of each mechanism. In this research, this dimension analyzed these factors: measures of communication mechanism satisfaction, communication mechanism rate of use; and communication mechanism usefulness were collected from scrum teams. Finally, related to communication of the product status, the focus was on the effect of the infrastructure required to communicate the status of the project using tools providing indicators about the product status (mainly quality characteristics). In agile software development, Brede et al. [41] used agile artifacts combined with the results of the analysis of data collected in interviews and observations to measure the level of work by a team. The following measures were applied: communication mechanism rate and communication mechanism usefulness. Table 3 shows a subset of the measures, classified by dimension, collected in this research to evaluate the perception of the communication infrastructure. Each row describes the measure, its type, the source of the measure, frequency (indicating how often it was collected) and the sources from which the measure was derived. Table 3 shows measures collected from team members to evaluate the perception of the usefulness of the infrastructures at different levels of communication.
3.3. Data collection process This process was comprised of three main steps: i) select measures to be collected, ii) establish how to collect them, and iii) establish when to collect them. Measures were selected by reviewing the literature on ASD and AGSD related to the research questions. As a result of the review, a set of 41 measures was selected, as described in Subsection 3.2. Each measure was documented by specifying its nature, description, range of values, and usefulness, as well as how and when it should be collected. These measures were organized into the three dimensions mentioned in Subsection 3.1 and presented in Table 1, Table 2 and Table 3. First-degree measures include classification surveys and focus group meetings. Runeson [32] and Creswell [37] recommended classification surveys to obtain information from team members. The classification surveys were designed following the guidelines provided by Fink [48] and Runeson [32]. The survey questions were identified in the literature related to software measurement in agile processes [4, 46, 49, 50]. The questionnaires were structured in seven sections covering the
T
ACCEPTED MANUSCRIPT
AC CE P
TE
D
MA
NU S
CR
IP
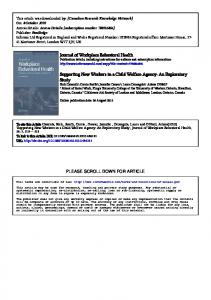
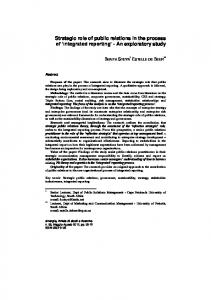
three dimensions mentioned above. The questionnaire is available at https://es.surveymonkey.com/s/7MYJJLL. Complementary to questionnaires and to triangulate the obtained values and answers in questionnaires, focus group meetings, following the guidelines provided by Krueger and Casey’s [51], were conducted at the end of all projects. For second-degree measures, data gathering automation was implemented following the idea of “one button” proposed by Hartmann et al. [49]. In this way, guidelines provided by Runeson [32] on minimizing the interaction with the team were applied so as not to disturb the teams normal behavior. Second-degree data were mainly obtained from agile artifacts, such as product backlogs, sprint backlogs, and burn-down charts. Measures were generated by software development and management tools such as Redmine and SonarQuBe. Third-degree data were obtained by studying project outputs and their generated documentation (including meeting minutes, video and audiorecorded meetings). Third-degree measures consisted of extracting measures that could not be obtained directly, such as those extracted from recorded sessions, such as the duration of or number of participants in each meeting. Concerning when data were collected, six measurement points were established to monitor communication in the Scrum processes. Clip 2 depicts where and how often first-degree, second-degree and third-degree measures were integrated in the development process. The time-line of the measurement process is represented at the bottom of Clip 2 to illustrate when and where each measure was taken. Table 1, Table 2 and Table 3 contain the list of measures and when each measure was taken. For every sprint, data collection started when the sprint planning was completed (see Clip 2 label 1). During the development process (see Clip 2 label 2), measures concerning the development process and the product were collected. Daily meetings (see Clip 2 label 3) were recorded to obtain measures of the duration, participants and infrastructure used to conduct the meeting. Some of the measures collected in the meeting enabled researchers to triangulate and gauge whether first-degree measures were consistent with what happened in the project. After the review and retrospective meetings (at the end of each iteration), more first-degree and second-degree measures were collected (see Clip 2 labels 4 and 5). Finally, at the end of the project, focus groups were conducted to collect further first-degree measures (see Clip 2 label 6). The results related to the analysis of data collected from the focus groups have been previously published [24]. In parallel, researchers processed different sources to obtain third-degree measures such as meetings duration, the number of sprint planning and daily meetings, and the number of participants in each meeting. Other
T
ACCEPTED MANUSCRIPT
AC CE P
TE
D
MA
NU S
CR
IP
measures, such as the number of sprint review and retrospective meetings, were collected from Redmine. These third-degree measures provided further data on information-sharing and communication during the project.
Clip 2: Measurement process. Label 1: No. of artifacts scheduled for a sprint or duration of meetings. Label 2: No. of commits, No. of builds in Hudson, No. of classes, test coverage or complexity. Label 3: Duration, participants and infrastructure used on each meeting. Label 4: No. artifacts finished, No. of wiki pages, No. documents. Label 5: Usefulness and levels of satisfaction with meetings and infrastructures. Label 6: Communication usefulness, infrastructure perceptions.
3.4. Data analysis process The objective of this analysis was to extract findings that showed a chain of evidence. A systematic data analysis was carried out in parallel with data collection. Data analysis was guided by interpreting the three types of collected measures and indicators in order to understand the use of communication infrastructure and its effects on teams and developed products. The mixed-methods approach of this research as outlined by Cresswell [37] requires the use of both qualitative and quantitative data. Qualitative data were used to define the nature of the problem and to identify quantitative measures on communication infrastructures. Surveys provided a perception of the usefulness of tool infrastructures; the nature of this perception is qualitative, but it was transformed into discrete values to be processed. Later, quantitative data were obtained from software tools used to monitor the development process, the product status and the code quality. Quantitative data from tools were used to
T
ACCEPTED MANUSCRIPT
AC CE P
TE
D
MA
NU S
CR
IP
cross-check how the development process was evolving and to gather evidence of the product status. These data were applied to triangulate the results gathered from the surveys related to communication. For discrete values from surveys, and following the recommendations of Tsai [52], the criterion scale was scored as 1, 2, 3, 4, and 5, where 1 equaled the lowest degree of impact and 5 equaled the highest degree of impact. These discrete values provided sufficient information for evaluating measures. Data analysis was performed following the guidelines suggested by Runeson [32] and Fink et al. [48]. The data acquisition process is described in Subsection3.3. In our case, because of the source of each dataset, and because data were automatically generated by tools, all data were considered valid. Data were processed using spreadsheets and descriptive statistics (average, standard deviation) to compare the results for each project, which were displayed on charts. A qualitative interpretation of these data was produced after the descriptive analysis. Qualitative measures were collected after project completion using focus group. Focus groups were conducted following the guidelines provided by Krueger and Casey’s [51]. Briefly, the focus groups interviews asked participants to express their personal perceptions of the effects of the communication tools. This meeting was audio- and video-recorded and then transcribed. When the data from the recorded meetings were transcribed, codes were defined using an open code method [51] and then annotated into a codebook. Each statement in the transcribed text was coded and classified separately by two researchers, who also performed triangulation in the coding process. Researchers and team members signed confidentiality and anonymity agreements. The focus groups were analyzed following Runeson’s recommendations [32]. Findings of the data obtained from the focus groups were used to triangulate, justify and support the findings obtained from the analysis of the qualitative/quantitative data.
3.5. Threats to validity Threats to validity of the collected data were addressed following Yin’s recommendations [53], which identify construct validity, internal validity, external validity and reliability as potential threats. Construct validity, which seeks to identify that correct operational measures for concepts have been studied, was achieved. Several multiple data sources and measurement processes were used, and searching for a chain of evidence, discussing conclusions and introducing triangulation where required [53, 54] to assess whether the construct was valid were achieved. Several projects were performed with different teams so that the effects could be verified. Having complementary data sources such as surveys and focus group interviews, allowed us to address ambigui-
T
ACCEPTED MANUSCRIPT
AC CE P
TE
D
MA
NU S
CR
IP
ties first at the research team level and second at the focus group level. Triangulation, as described in [55], was applied. As far as the research reported within this paper has been approached as an exploratory study, internal validity (which seeks to establish causal relationships as distinguished from spurious relations) has not been addressed in depth, since Yin [53] explained that internal validity is meaningful for explanatory or causal studies only, and not meaningful for descriptive or exploratory studies, such as the present study. Concerning external validity (which seeks to define the domain to which a study’s findings can be generalized), the limitation of having the same context applies. The results, in a case study are obtained from a given context. Within this study, the context and important components of case studies [56] were determined and the manner in which the project was organized, including the industrial partner, while some other parameters were not fixed due to the nature of the projects and the number of distributed nodes. Therefore, while it should be noted that according to [57] interpretive case studies do not seek generalizability, it is possible to generalize the results obtained to some extent. Reliability (which seeks to demonstrate that the operations of a study, such as the data collection procedures, can be repeated with the same results) was the final measure. The research process included a careful specification of the procedures for data-gathering depending on the kind of data (first degree, second degree, or third degree). While automated tools were used for some of the data gathering, once the measures and tools were decided upon, the rest of the process depended on accurate tool operation. For other kinds of data, detailed and careful documentation (a compilation of all the documents, and coding) was performed when required. Concerning reliability, theoretical saturation of data can be reached if new themes or insights do not arise [58]. The problem lies in applying this in practice, since guidelines are often missing, and the number of interviews, for instance, is a difficult issue [59]. Researchers must also consider the recognized constrained availability of personnel in this field [39]. Within this research interviewees were all professionals with experience in the field; therefore, it can be expected that saturation concerning reliability was achieved.
4. Research environment Subsection 3.1 referred to a fixed context composed of communication infrastructure and the development process applied to implementing software. Section 4 describes both of the elements used on all the units of analysis of this case study. Subsection 4.1, Infrastructure, presents the environment in which software products were developed. Subsection
T
ACCEPTED MANUSCRIPT
CR
IP
4.2, describes Scrum which was the methodology applied to manage the development process. 4.1. Infrastructure
AC CE P
TE
D
MA
NU S
This research was performed in an experimental research facility [60] (SSF). SSF is a type of software engineering research and education laboratory. SSF was initially located at the University of Helsinki (UH1 ), and then installed at the Technical University of Madrid (UPM2 ). It was also established at Indra Software Labs (ISL3 ), a subsidiary of Indra, a global engineering company. Subsequently further settings were established. The infrastructure was designed to support data collection related to communication in the three directions explained in Subsection 3.1: team communication, communication at different stages of the development process, and communication related to the status of the developed product. The tools used at SSFs were simple in comparison with other commercial and closed tools like Webex video-conference system or JIRA for project management. Efficiency came from the combination of tools used to address different directions (i.e., team, process, and product) with facilitation by an efficient Scrum Master rather than from the sophistication of the tools. To foster communication in distributed environments, video (corner, ceiling and desktop cameras) and audio (ambient and individual microphones) facilities were provided. Images taken by these cameras were displayed on a smartboard using VSee, a software application. Audio and video facilities enabled development teams to talk with each other and to have visual contact with the part of the team that was not co-located. Corner and ceiling cameras and ambient microphones provided a landscape for each SSF, which helped teams to see the activity in other distributed SSFs. In addition, desktop cameras facilitated communication during product development when required by developers. Video-conferencing tools (VSee) supporting bi-directional communication (face-to-face and/or one-to-many) also played a relevant role in facilitating team-building, to increase the feeling of working as a team and to make distributed teams feel as if they are in the same room. The smartboard in combination with VSee was the cornerstone of the communication between SSFs. VSee4 is a voice-over Internet protocol service (VoIP), and software application that allows groups of users to communicate by voice, video, and instant messaging over Internet. VSee also provides facilities such as drag and drop, file transfer, application1
http://www.helsinki.fi/university/ http://www.upm.es/internacional 3 http://www.indracompany.com/en 4 http://vsee.com/ 2
T
ACCEPTED MANUSCRIPT
AC CE P
TE
D
MA
NU S
CR
IP
and desktop-sharing and AES encryption security. The smartboard (a large screen) displayed VSee, allowing teams to reduce the distance between the sites. Finally, using Webcam 7, audio and video were mixed and recorded on network disk drives, facilitating the gathering of thirddegree measures related to communication between SSFs. Recording work sessions enabled meetings to be monitored (duration, frequency, attendance, use of infrastructures). Recorded sessions provided data that were analyzed to determine whether information about the process was received by team members in different SSFs. Smartboard capabilities to share desktops and screen and being able to write to the same board from different sites let distributed teams organize meetings where people at different sites could actively participate. VSee + smartboards provided a window to share among sites and reduce barriers (e.g., distance and visualization), making communication between different teams as natural as possible. Project activities were managed using software applications such as Redmine, Hudson or SonarQuBe. Redmine5 is a flexible project management web application that can be extended with plugins. Some plugins, like Redmine Charts or Workload, were used to increase the visibility of the project-development progress by visualizing burndown charts. A burndown chart is used to analyze work scheduled versus the work implemented in order to confirm that estimations were aligned with the results. The Workload plugin was used to confirm whether estimations were aligned with the amount of time spent on each task. It displayed the time each team member took to complete each task. Therefore, Redmine and its plugins provided instant communication about the status of the process (i.e., delayed, on time or ahead). SonarQuBe6 is an open platform used to manage code quality. SonarQuBe provides code analysis, hunts for defects and shows the evolution of the time-line of the project development. These features helped the Scrum Team and Scrum Master to communicate objective evidence of the status and quality of the project. Centralized repositories (in the sense of centrally managed, not centrally installed), managed with Apache Subversion (SVN)7 , helped the distributed teams share project resources, such as source code and technical documentation. The automation of data gathering from software under development was provided by Hudson8 , a continuous integration server, and Maven9 . By using Hudson in combination with Maven, the Scrum Team was not in charge of the data5
http://www.redmine.org/ http://www.sonarqube.org/ 7 https://subversion.apache.org/ 8 http://hudson-ci.org 9 http://maven.apache.org/ 6
T
ACCEPTED MANUSCRIPT
MA
NU S
CR
IP
gathering process. Whenever the centralized repository was updated, Hudson launched a process to build the source code, perform code analysis and present reports to the Scrum Team. These reports helped teams get a fast feedback about the project status. In addition, to provide support to the research team, Survey Monkey10 , an on-line survey system, provided the infrastructure to collect data directly from the participants in the projects: the Product Owner, the Scrum Master and the Scrum Team. Data concerned personal perceptions about communication and the usefulness of infrastructure. All the participants filled out on-line questionnaires. Data collected from all SSFs were used in the analysis process to obtain the main findings of this research. 4.2. Development process
AC CE P
TE
D
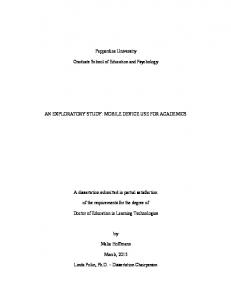
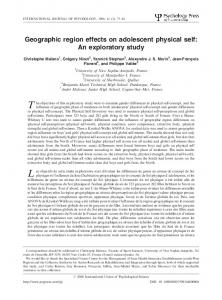
The development process was managed by Scrum [61] which is used to implement an iterative and incremental lifecycle that focuses on individuals and interactions. Scrum is open for adaptation to specific teams’ characteristics. In this research, the three roles defined in Scrum [62] were adopted: Product Owner, Scrum Master and Scrum Team. A senior engineer from the industrial partner was the Product Owner, another senior engineer was the Scrum Master, and engineers having at least two years of experience in software development from the industrial partner and the UPM comprised the Scrum Team. Projects were scheduled for six or seven weeks in short iterations of two weeks, which are called “sprints” in Scrum. The last iteration in sevenweek projects took only one week. At the end of each sprint, all team members involved in the project gathered for two meetings: the sprint review and retrospective. The sprint review was intended to validate the work performed and the retrospective review was intended to evaluate the outcomes from the distributed development process and, if necessary, improve them. Clip 3 shows the Scrum framework, its artifacts and the tools used to support it. At the beginning of each project, prior to beginning the development activities, the Product Owner and the Scrum Team identified requirements during the inception meeting. The list of requirements, which was represented in features and user stories, was stored using Redmine, described in Subsection 4.1, which supported the Product Backlog. Subsequently, with the goal of delivering as much value as possible, features and user stories stored in the Product Backlog were prioritized and organized into sprints. Each sprint had clear objectives. Redmine was used as a process and product support tool after the inception meeting. VSee and a smartboard were used as media tools. The smartboard in combination with 10
https://www.surveymonkey.com/
T
ACCEPTED MANUSCRIPT
AC CE P
TE
D
MA
NU S
CR
IP
VSee and its ability to share information on desktops were used to draw pictures cooperatively and to represent the shared vision of each project, providing an open door to the space where the other team worked. Both tools enhanced teams opportunities to work together, such as ensuring that a unique board was visible in all SSFs.
Clip 3: Scrum life cycle and tools supporting the process.
The workload was planned during the sprint planning meeting. Redmine, VSee and the smartboard were also used for planning. Redmine drove the planning meeting by providing the list of features and user stories to be visualized on the smartboard using VSee, which enabled open discussions in which the scope of the project was clarified. During the sprint execution, the Scrum team conducted short daily meetings (less than 15 minutes) to track the progress of the project supported by VSee. The use of VSee allowed the Scrum Team to perform highly efficient distributed stand-up meetings around the smartboard. Quality measures of the development process and the product architecture were determined while software was implemented. As described in Subsection 4.1, tools, such as SonarQuBe integrated with Hudson, Maven, Subversion (SVN), and Redmine, in addition to Scrum and Kanban plugins, enabled the automation of the data-gathering process. All the activities carried out at SSFs were audio- and video-recorded to support session observations and data gathering, as described in Section 3. For instance, the duration of daily meetings was obtained by analyzing the audio and video recordings. Hence, the Scrum master or
T
ACCEPTED MANUSCRIPT
MA
NU S
CR
IP
any other team member did not need to be in charge of recording the time spent at each meeting. At the end of each sprint, the Scrum Team performed a sprint review and conducted a retrospective meeting. In the sprint review, the Scrum Team demonstrated the developed product to the Product Owner, who accepted or rejected the user stories that were developed. Finally, in the retrospective meeting, all of the project participants evaluated the process regarding what went well, what went wrong and what could be improved upon in the next sprints. These two meetings were conducted using VSee, Redmine and Survey Monkey.
5. Case study description
AC CE P
TE
D
This research is a single-case study following the classification described by Yin[53], that is, the SSF infrastructures provide the opportunity to observe communication in AGSD and without these infrastructures observations are not feasible. It is also considered an embedded case study with four units of analysis (software projects) because the goal of the research generally concerns communication in AGSD and not specifically each project or application domain. All these units of analysis were implemented in the controlled context described in Section 4. Each project had different characteristics in terms of functionality, teams and size; therefore, the conclusions are not be dependent on project-specific characteristics. All of the projects were industry-driven. The following subsections present each project in detail. Two projects, Optimeter I and Optimeter II were part of larger projects requiring deep code maintenance. The other two projects, Research4us and Habeo Ideam required code changes and maintenance of products built by third parties. Two very different programming languages (Java and PHP) and development environments were used. All of the projects were distributed. Two sites were involved in three projects, and one project was developed at three sites. Team size at each site was aligned with Schwaber’s [61] recommendations. Project details can be found in Section 6. The research reported in this paper is aligned with challenges presented by Usman et al. [10]; therefore, communication was observed in all projects according to three dimensions: team member communication, communication about the development process and monitoring the status of the developed product.
5.1. Optimeter I Optimeter I implemented use cases in the domain of power energy networks related to the validation of raw data coming from the field. It
T
ACCEPTED MANUSCRIPT
AC CE P
TE
D
MA
NU S
CR
IP
was used as a benchmark in processing and distributed storage of massive amount of data gathered from power networks by using Apache R Hadoop and NoSQL databases. The main goal of Optimeter I was to build a system to optimize the search and management of massive data in the Smart Grid domain. Optimeter I supported traversal activities to two European ITEA2 projects: IMPONET11 (127 person years) and NEMO&CODED12 (112 person years), and a third large Spanish project called ENERGOS13 (budget 24.3 million euros). These three projects focused on supporting power smart grids. Optimeter I was implemented from the scratch in seven weeks and two SSFs were involved: UPM and ISL. Nine engineers participated in the project, five at UPM and four at ISL. This was the first time that both SSFs worked together; Spanish was the official language of the project. Most of the engineers were male (eight) and only one engineer was female. Most of the team members were under 30 years old and only two were older than 30. All of them were Spanish, had at least two years of experience in ICT projects and had skills in computer science. Technology was the main challenge of this project because the team members did R therefore, communication not have previous experience with Hadoop ; played a critical role in speeding up the learning curve.
5.2. Optimeter II
Optimeter II was an evolution of Optimeter I. This project was implemented in seven weeks and involved more use cases in the domain of power energy networks using the same technologies as Optimeter I. Three SSFs were involved in this development: UPM, ISL and UH. One of the SSFs (UH) was in a different time-zone (a one-hour difference) which impacted the scheduling of meetings for the project due to different cultures (e.g., lunch time, working hours and public holidays). There were 21 engineers distributed as follows: six at UPM, four at ISL and eleven at UH. Teams at UPM and ISL were working together in Optimeter I but this was the first time they had worked with UH. In Optimeter II, English was the official language of the project. Most of the engineers were male (16) and only five engineers were female. Most of the team members were under 30 years old and only 2 were older than 30. All the members at ISL and UPM were Spanish. UH involved engineers from different countries, including Finland, Italy, United Kingdom and India. All the engineers at UH had experience with Scrum and Java, but it was the first 11
IMPONET Intelligent Monitoring of Power NETworks http://www.itea2.org/project/index/view?project=10032. 12 NEMO NEtworked MOnitoring & COntrol, Diagnostic for Electrical Distribution http://www.itea2.org/project/index/view?project=1131. 13 http://innovationenergy.org/energos/
T
ACCEPTED MANUSCRIPT
MA
NU S
CR
IP
R time they had worked with Hadoop . Two main communication challenges were addressed in this project: first, disseminating the status of the project, which was a challenge because Optimeter II was an evolution of Optimeter I. Therefore, communication about the status of the project (process and product) played an important role in engaging the new team. Second, verbal communication was another challenge because of the change of the official language. It impacted in the project in terms of translating relevant documents produced in Optimeter I into English. Therefore, team communication also played a critical role in speeding up the integration of the new team. This project helped demonstrate the effects of communication infrastructure on a multi-cultural, multi-site distributed team.
D
5.3. Research4us
AC CE P
TE
The third project, Research4us, customized Dokuwiki by adding specific functionalities to support the process of writing research papers. Dokuwiki 14 is a free software wiki application aimed at the documentation needs of small companies; it has built-in access control, authentication connectors, and a large number of plugins. Dokuwiki was extended over a six-week period by developing new PHP plugins and customised by the creation of templates. Two software SSFs were involved: UPM and ISL. Ten engineers were involved in Research4us, six at UPM and four at ISL. After the experience acquired in Optimeter II, the official language for documenting and coding was English, but Spanish for meetings. At UPM, four new members were added to the group who did not have any previous experience with AGSD. Most of the engineers were male (nine) and only one engineer was female. Most of the team members were under 30 years old and only 2 were older than 30. All of them were Spanish, had at least two years of experience in ICT projects and had skills in computer science. In this project, the main challenge was to integrate the four engineers on the UPM side and teach them how infrastructure worked when integrated with the development process.
5.4. Habeo Ideam The last project, Habeo Ideam, was also implemented in PHP in six-week period. It consisted of implementing extensions and templates in the content management system (CMS) Joomla 15 . Joomla enables users to build websites and on-line applications. Joomla is extensible, keeps track of each piece of content on the webwsite and provides basic authentication 14 15
https://www.dokuwiki.org/dokuwiki http://www.joomla.org/
T
ACCEPTED MANUSCRIPT
AC CE P
TE
D
MA
NU S
CR
IP
and security services. Joomla uses MySQL to ensure data persistence. In Habeo Ideam, Joomla was extended by the addition of new components to manage, visualize, characterize and vote on ideas. Two software SSFs were involved: UPM and ISL. Fifteen engineers were involved in Habeo Ideam, 11 at UPM and 4 at ISL. As in the Research4us project, the official language for documenting and coding was English, but Spanish for meetings. At UPM five new members without any previous experience in AGSD or PHP were added to the group. Most of the engineers were male (11) while only 4 engineers were female. Most of the team members were under 30 years old and only 2 were older than 30. All of them were Spanish, had at least two years of experience in ICT projects and had skills in computer science. This project presented additional constraints in terms of team availability. Team members from the UPM side did not have the same daily availability, four of them worked only from 9am to 1pm, another three worked from 1pm to 5pm and the rest worked from 3pm to 7pm. The team members committed to attending all of them to general meetings (sprint planning, sprint review and retrospective) and to perform asynchronous daily meetings. They used the smartboard as a whiteboard to notify missing team members of the results of the daily meetings. Due the engineers’ limited availability, the main challenge was to integrate engineers working at UPM with the timetable and also to use the infrastructure to share product and development process statuses.
6. Data collected and measures This first part of the section presents some raw and processed data. Due to space limitations, only the assessment of some selected products is presented. Some graphic tables are included below. This makes it possible to present the results of the assessment of more products as clips need not be so restrictive in terms of space limitations. Table 4 shows general information about the developed projects. In the first two projects, Size specified in Lines of Code (LOC) comprises all the lines developed in the scope of the project. In the case of Research4us and Habeo Ideam, Size represents the total size of the working product, comprising the developed functionality and base code (i.e., in Dokuwiki or Joomla). Tables 5 through 9 describe the data collected from the projects including the types of meetings and number of attendees in Table 5, user stories developed by iteration and project in Table 6, architectural and size values in Table 7, satisfaction level by type of meeting and project in Table 8, and usefulness perception rate for Redmine, VSee and smartboard in Table 9.
IP
T
ACCEPTED MANUSCRIPT
Language
Factories
Optimeter I
Java + Hadoop
UPM and ISL
9
6589 LOC
Optimeter II
Java + Hadoop
UPM, ISL and UH
21
9652 LOC
Research4us
PHP + Dokuwiki
UPM and ISL
10
56139 LOC
Habeo Ideam
PHP + Joomla
UPM and ISL
15
37034 LOC
NU S
MA
Team size
CR
Project name
Size (LOC)
TE
D
Table 4: Team and software size of the projects explored
Optime ter I
Optime ter II
Resear ch4us
Habeo Ideam
Daily
8.00
19.00
10.00
6.40
Planning
10.00
21.00
14.00
15.00
Review
9.00
21.00
14.00
15.00
Retrospective
10.00
21.00
13.00
15.00
AC CE P
Meeting type
Table 5: Number of attendees by type of meeting and project
Iteration number
Optime ter I
Optime ter II
Resear ch4us16
Habeo Ideam17
Iteration 1
6.00
11.00
3.00
17.00
Iteration 2
12.00
4.00
18.00
29.00
Iteration 3
8.00
9.00
4.00
13.00
Iteration 4
8.00
16.00
Table 6: User stories developed by iteration and project
Optime ter II
Files
81
81
467
656
LOC
6589
9652
56139
37034
Classes
43
139
232
376
Methods
104
325
2051
1653
Avg Method complexity
3.3
2.3
6.6
3.9
Avg Class complexity
8
5.9
67.1
17
Commits
70
227
167
184
247
30
19
116
TE
Builts
Resear ch4us
NU S
CR
Optime ter I
D
Measure
MA
IP
T
ACCEPTED MANUSCRIPT
Habeo Ideam
AC CE P
Table 7: Architectural and size values
Meeting type
Optime ter I
Optime ter II
Resear ch4us
Habeo Ideam
Daily
4.73
4.13
4.68
3.90
Sprint planning
3.87
4.13
3.89
2.58
Sprint review
4.6
4.6
3.93
3.77
Sprint spective
4.67
4.8
3.79
3.77
retro-
Table 8: Satisfaction level by type of meeting and project
Product
Optime ter I
Optime ter II
Resear ch4us
Habeo Ideam
Average
Redmine
4.64
4.54
4.71
4.2
4.52
Vsee
4.93
4.54
4.93
4.06
4.60
Smartboard
4.64
4.15
4.64
4.06
4.36
Table 9: Usefulness perception rate for Redmine, VSee and smartboard
T
ACCEPTED MANUSCRIPT
AC CE P
TE
D
MA
NU S
CR
IP
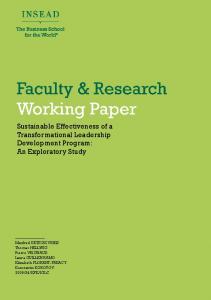
Clips 4 through 9 provide a complementary perspective of the measures. In this case, measures of the satisfaction of perceived usefulness were obtained using surveys. The level of satisfaction with the overall communication in the four projects can be seen in Clip 4. One issue raised was whether satisfaction with communication was different if only onsite team members were considered or if on-site and off-site members were considered. Clip 5 shows that this satisfaction level is very similar with regard to on-site members or off-site members. Together with this, team trustworthiness level remained almost constant and was quite aligned with communication satisfaction levels, as depicted in Clip 6. Clip 7 is a representation of several of the infrastructure tools in the four projects. The level of satisfaction is medium or high for all the tools, except for Vsee, which grows steadily. Finally, meeting duration was used as a general characteristic of agile projects; meeting duration is similar to what is reported in the literature [61, 63]; Clip 9 depicts the average agile meetings duration in the projects.
Clip 4: Communication satisfaction level perceived in analyzed projects
Clip 5: Communication satisfaction level on-site and off-site
CR
7.1. Overall perception
IP
7. Discussion and findings summary
T
ACCEPTED MANUSCRIPT
AC CE P
TE
D
MA
NU S
This section introduces a discussion of the measures obtained, which were presented in the previous section. Where needed, triangulation is implemented using the transcription from the focus group. One topic that stands out is that the overall level of communication satisfaction remained high and quite constant during the four projects, independent of the domain, of having on-site or off-site teams, and of having a high level of trust as well. All these issues will be reviewed in the following sentences. Clip 4 shows the level of satisfaction with the overall communication in the four projects.
Clip 6: Communication vs trustworthiness vs monitoring satisfaction level. In our research, three different application domains were covered and in all of the projects we obtained similar values for satisfaction level as depicted in Clip 4. However, this result is in contrast with the satisfaction level at meetings. The feeling in most of the meetings was similar, except for the sprint planning meetings, as shown in Table 8. This required a further analysis. It turned out that in the fourth project, Habeo Ideam, the sprint planning exhibited different behavior than in the other meetings (satisfaction level = 2.58); by analyzing the questionnaires and through direct interviews with team members, it was concluded that their satisfaction level was affected by the complexity of the user stories, the product under development and that the development team had little or no experience working with Joomla when they performed the sprint planning, causing their estimations to often fail.
T
ACCEPTED MANUSCRIPT
AC CE P
TE
D
MA
NU S
CR
IP
Satisfaction depending on having on-site and off-site teams was another issue to tackle. This feeling of closeness is stressed by Clip 5, which shows no relevant differences between communication satisfaction levels in the case of communication between team members in the same site or in different sites. The final issue, team trustworthiness level, also remained almost constant throughout the case study, with values similar to or even better than communication satisfaction levels, as depicted in Clip 6. Analysis of the focus group transcripts can help us to understand that the feeling of closeness induced by the integration of the smartboard and Vsee might neatly impact on the satisfaction level. Actually, in one the focus groups sessions, one of the participants noted the following: “Someone in one of the rooms sneezed and someone in another room said ’Hadoop.’. Instead of saying ’Bless you’ they said ’Hadoop,’ which is the name of the technology we were using. Things like that gave me the feeling that we were all working in the same room.”. Teams worked as a single team by using biand multi-directional communication. This fact was pointed out by one of the team members “... for me, the fact that if we analyze the direct communication tools we had sitting down and seeing on screen that there’s a person at the other side who’s really listening if you say anything, or seeing you only by looking at the window, really gives you the feeling that you’re in the same room, even though there’s a big distance.”. These results are aligned with the target proposed by Kropp et al. [11], who introduced the concept of “common ground”. The suggestions proposed by Sinha [64] concerning the fact that developers should be able to initiate conversations easily and that one-to-many communication tools could support this ability have been addressed for the case of distributed teams and also pointed out by Mishra et al. [20]. This is also aligned with Paasivaara [65] regarding the importance of creating a community, and Kropp et al. [11] regarding placing the team in the same room as a way of fostering communication. However, this conclusions are not fully in agreement with the finding of Niinimaki et al. [22] with respect to the preference that technical personnel may have for using text-based media to communicate. These focus groups transcript excerpts suggest satisfaction with the tools used.
7.2. Perception on tools Clip 7 demonstrates the level of satisfaction with respect to the toolsbased infrastructure. Clip 7 shows that the perceived usefulness of VSee as the software part of the video-conferencing system was the most highly rated. On a scale from 1 to 5, the highest perceived usefulness value was 4.93, the lowest was 4.06 and the average was 4.60. The smartboard as the hardware part also achieved high values of perceived usefulness; the
T
ACCEPTED MANUSCRIPT
AC CE P
TE
D
MA
NU S
CR
IP
highest was 4.64, the lowest 4.06 and the average 4.3618 . The usefulness of this infrastructure were highlighted during one of the focus groups: “Multi-conference communication. It wasn’t one-to-one, but rather five, six, seven on screen and all working and seeing each other’s face, seeing each other’s screen. Even, by clicking on a camera - not only one person, but clicking different people’s cameras - you could really see those people working”. The following transcript shows the power of combining VSee and the smartboard, as described in Subsection 4.1: “ ... Those were the benefits with VSee and when we used it together with smartboard screen sharing was a very powerful tool for collaborative model creation or for collaborative problem solving. It was tremendously useful.”. However, the huge dependency on bandwidth was a negative element. During the focus groups, one of the team members noted this issue: “... weve had some problems with the audio and video, though its also true that there have been various changes in the material used ...” Another developer commented: “On the one hand, there’s the network communication between rooms, because there have been problems when it came to using servers, or installing some of the tools that needed to communicate between various servers and couldn’t do so because the communication wasn’t good. ” This issue has been addressed by Korkala in [8]. In the case of Research4us and Habeo Ideam projects, SonarQuBe plugins provided fewer measures about the status of the project than in the two previous projects, but teams solved this challenge using other centralized tools such as wiki pages, Redmine news and reducing the size of the user stories. Clip 6 shows that even when team monitoring facilities decreased, their communication and trustworthiness satisfaction level remained almost constant. Communication via video-conferencing facilities enabled teams to make up for the lack of communication in other dimensions. Concerning the satisfaction on the communication about information on the development process and product status, the (distributed) development teams felt that being supported by centralized tools was useful in helping to provide a general overview of the project progress. Clip 7 shows that Redmine was rated higher by development teams than other channels and was one of the most relevant communication channels. The usefulness and availability of this infrastructure were highlighted during one of the focus groups: “I think, of the infrastructures, I’d highlight Redmine, which I’ve found really useful in terms of controlling all the tasks and the user stories, what they’re doing. And that helped a lot, not only with the daily meetings but also in having a visual control, a general overview 18
Some other VoIP products with the same functionality as VSee and that run on R R could provide the same effect on a smartboard, like Skype or Google Hangout , communication; however in our research VSee performed much better in terms of bandwidth consumed by simultaneous sessions.
T
ACCEPTED MANUSCRIPT
AC CE P
TE
D
MA
NU S
CR
IP
of how the project was going.”. Centralized repositories for project management (Redmine) were perceived as having similar usefulness values as video-conferencing systems. Table 9 shows values of the perceived usefulness of Redmine, VSee and the smartboard, supporting this fact. Video-conferencing systems could be intuitively perceived as one of the most relevant infrastructures. It is thus relevant that a tool like Redmine, which requires much more learning effort, is also considered useful in its support of team communication. Even when it is important to have team video communication facilities, it is also important to have centralized tools (like Redmine) to let team members access project information and know the status of the development process.
Clip 7: Usefulness level perceived of tools
Confirming the findings of previous studies [31], the use of centralized repositories and tools (centrally managed, not necessarily centrally implemented) enabled knowledge-sharing in AGSD. The use of tools, such as SVN, SonarQuBe, Hudson, and Redmine helped the teams to share many kinds of information, not only code, as if they were co-located. The usefulness of the complete infrastructure was described by one of the focus group participants as follows: “We’re looking at each of the tools separately, but what we had was a single system of infrastructure and all of them together helped us. In other words, we had, like, a lot of alarms Sonar, Hudson... - So you’d arrive and see if the day looked bright or not, and in fact... The problem was when all of the alarms went off, that was the problem.” Architectural and process indicators, such as class and method complexity, test coverage, number of builds or number of commits to SVN, helped the team drive internal discussions about the quality of the developed software. Table 7 in Subsection 6 shows some of these measures. The following statement is from one of the developers: “... I really liked SonarQuBe a lot because it brought an objective viewpoint to the subjective. ... SonarQuBe, on the other hand, was like that judge that everyone respects. ...”. In the case of people who played a partial role in the project, these measures helped them to understand and analyze the project. One of the developers highlighted: “when someone who´s not so involved in development has to use a certain point
T
ACCEPTED MANUSCRIPT
AC CE P
TE
D
MA
NU S
CR
IP
to see what to focus on or not focus on, in terms of the code as in my case, at times it is very useful.” The left side of Clip 8 shows the use of tools in product development in this research is depicted, and the right side shows the perceived usefulness of infrastructure. It reveals that in Research4us, SonarQuBe was not significantly used and the perceived usefulness of infrastructure decreased due to the lack of automation. From these data we can conclude that when tools are integrated with the development environment, then they are considered as useful and these tools are used more frequently. But in the case of tools that are semi-integrated, then their usefulness decreased and at the same time the use of these tools also decreases.
Clip 8: Use of tools related to product development
One participant remarked that the overload occurred only at the beginning of projects: “... I think that the main workload issues in terms of these tools is more at the initial phase. I mean, during configuration at the start of the project when the different sections are created, or when you create user accounts. But the day-to-day use, I don’t think it’s very different to what you’d have to do ...Probably at the beginning, because of the computation in the infrastructure, but that was only during the initial phase.”.
7.3. Perception on processes In our research, the tool infrastructure enabled distributed teams to obtain results similar to co-located teams in terms of meeting duration. Clip 9 depicts the average duration of agile meetings. There were no relevant differences between the obtained values and the length recommended in the literature for these meetings[61, 63]. Daily meetings took on average 8 minutes,less than 15 minutes that is the maximum duration recommended in the literature, planning meetings took in average 2 hours, less than the half day recommendation, reviews and retrospectives took on average 80 and 100 minutes, respectively, less than the limit of 2 hours recommended in the literature. Concerning meetings the perception was positive: “ ... for example the daily meeting. But I didn’t see that as extra work; I saw it as something very helpful, above all for the rest of the factory. ”
D
MA
NU S
CR
IP
T
ACCEPTED MANUSCRIPT
TE
Clip 9: Meetings duration on each project 7.4. Findings summary
AC CE P
Table 10 shows the main findings of this research. This table has three columns, the first one Id. gives the id number of the finding. The column labeled Finding describes the finding, and finally, the third column labeled Research Question indicates where the finding is applicable.
8. Conclusions and Future Work This article reports the results of exploratory research conducted on the impact of communication infrastructure on AGSD. Communication is critical in AGSD because of distributed development as well as because of the frequent meetings prescribed by agile, which are often short in duration and which are enhanced by face-to-face communication; therefore, the combination of the two has strong communication requirements. The study analyzed the perceptions of the team on the infrastructure used to support communication. This research tackled communication in three dimensions: team communication, the development process and the product under development. The development teams perceptions about communication were positive, revealing that at the minimum, smartboards (large dimensions) supported by video and audio facilities in combination with centralized repositories (for supporting communication on the process and product progress) containing measures of the process development and product characteristics are required to support communication. Lacking any of these could reduce the level of communication in a project.
IP
T
ACCEPTED MANUSCRIPT
CR
Id. Finding
Research Question
Having access to smartboard (large dimension) video-conference capabilities all the time the team was working, helped reduce the distance gap and helped teams work as if co-located.
RQ1 RQ2
F2
Smartboard (large dimension) video-conferencing systems increased the feeling of closeness and enhanced team building.
RQ1 RQ2 RQ3
F3
Centralized repositories for project management (Redmine) were perceived to be as useful as videoconference systems to support team communication.
F4
The combination of video-conferencing systems and centralized project management tools was felt to be useful to manage AGSD projects.
RQ1 RQ2 RQ3
F5
The tool infrastructure provided allowed distributed teams to achieve similar results regarding duration as those co-located
RQ2
F6
The use of centralized repositories and tools was seen as facilitating discussions and enabling knowledgesharing in AGSD.
RQ2 RQ3
F7
Measures from centralized tools provided a shared vision of the product status for on-site and off-site members.
RQ3
AC CE P
TE
D
MA
NU S
F1
RQ2
Table 10: Research findings The infrastructure provided in this research proved to be a good starting point to help create a common ground [11] where team members could communicate fluently in global distributed environments, improving communication, and allowing them to benefit from team members sharing information. Within the research reported here, the common ground was technically supported by a set of tools consisting, briefly, of a smartboard with Vsee and a central repository with tools to exploit information. It was observed that when tools that produced process/product data did not work well for some reason, infrastructure was perceived as less useful. The tools were simple (compared with some of the available tools in the
T
ACCEPTED MANUSCRIPT
TE
D
MA
NU S
CR
IP
market), and it is not clear that more sophisticated media tools would significantly improve the results. The use of simple tools, such as Vsee with a smartboard, by all of the team members proved much more useful than the cameras in their computers. The combination of tools (i.e., team, process, and product) proved beneficial. However a smartboard, because of its size, can be used to share the physical space, albeit virtually, and it seems to help create closeness. Future research will focus on exploring challenges in the relationship between different levels of information, studying the effect of media and central repository facilities separately and the effect of combining both, and ameliorating the effects of work/cultural factors by developing a better understanding of how the information from the development can be effectively used to address all these challenges. Using process/product data-based evidence to drive discussions is a field to explore; finding the right data and selecting it from among the huge amount of data from the software process, in this case, is a challenge.
AC CE P
9. Acknowledgement This work was partially sponsored by the i-Smart-Software-Factory (iSSF) project funded by MICINN IPT-430000-2010-38 and INNOSEP TIN200913849. Part of the empirical data was obtained from the projects ITEA 2 09030 IMPONET funded by MITYC TSI-020400-2010-103, ITEA2 08022 NEMO CODED funded by CDTI IDI-20110864 , ENERGOS funded by CDTI CEN-20091048. Final analysis has been partially sponsored by the project MESC, funded by MINECO DPI2013-47450-C2-2-R, achieving that the consolidated results can be applicable to future empirical research studies in the Smart Cities and Smart Grids domains. Authors are indebted to Pilar Egea Romero for her support on the social aspects of this research.
References [1] M. A. Babar, C. Lescher, Editorial: Global software engineering: Identifying challenges is important and providing solutions is even better, Inf. Softw. Technol. 56 (1) (2014) 1–5. doi:10.1016/j.infsof. 2013.10.002. [2] D. Mishra, A. Mishra, A software inspection process for globally distributed teams, in: R. Meersman, T. S. Dillon, P. Herrero (Eds.), On the Move to Meaningful Internet Systems: OTM 2010 Workshops - Confederated International Workshops and Posters: International
T
ACCEPTED MANUSCRIPT
NU S
CR
IP
Workshops: AVYTAT, ADI, DATAVIEW, EI2N, ISDE, MONET, OnToContent, ORM, P2P-CDVE, SeDeS, SWWS and OTMA. Hersonissos, Crete, Greece, October 25-29, 2010. Proceedings, Vol. 6428 of Lecture Notes in Computer Science, Springer, 2010, pp. 289–296. doi:10.1007/978-3-642-16961-8_47. URL http://dx.doi.org/10.1007/978-3-642-16961-8_47
MA
[3] J. Herbsleb, A. Mockus, An empirical study of speed and communication in globally distributed software development, IEEE TSE 29 (6) (2003) 481–494. doi:10.1109/TSE.2003.1205177.
D
[4] F. da Silva, C. Costa, A. Francanda, R. Prikladinicki, Challenges and solutions in distributed software development project management: A systematic literature review, in: ICGSE 2010, 2010, pp. 87 –96. doi:10.1109/ICGSE.2010.18.
AC CE P
TE
[5] K. Beck, M. Beedle, A. van Bennekum, A. Cockburn, W. Cunningham, M. Fowler, J. Grenning, J. Highsmith, A. Hunt, R. Jeffries, J. Kern, B. Marick, R. C. Martin, S. Mellor, K. Schwaber, J. Sutherland, D. Thomas, Manifesto for agile software development (2001). URL http://www.agilemanifesto.org/ [6] S. Jalali, C. Wohlin, Global software engineering and agile practices: a systematic review, Journal of Software: Evolution and Process 24 (6) (2012) 643–659. doi:10.1002/smr.561.
[7] Y. I. Alzoubi, A. Q. Gill, Agile global software development communication challenges: a systematic review, in: K. Siau, Q. Li, X. Guo (Eds.), 18th Pacific Asia Conference on Information Systems, PACIS 2014, Chengdu, China, June 24-28, 2014, 2014, p. 20. URL http://aisel.aisnet.org/pacis2014/20 [8] M. Korkala, F. Maurer, Waste identification as the means for improving communication in globally distributed agile software development, Journal of Systems and Software 95 (0) (2014) 122 – 140. doi:http://dx.doi.org/10.1016/j.jss.2014.03.080. [9] S. V. Shrivastava, U. Rathod, Categorization of risk factors for distributed agile projects, Information and Software Technology 58 (0) (2015) 373 – 387. doi:http://dx.doi.org/10.1016/j.infsof. 2014.07.007.
[10] M. Usman, F. Azam, N. Hashmi, Analysing and reducing risk factor in 3-c’s model communication phase used in global software development, in: Inf. Sci. and App. (ICISA), 2014 Int. Conf. on, 2014, pp. 1–4. doi:10.1109/ICISA.2014.6847362.
T
ACCEPTED MANUSCRIPT
CR
IP
[11] M. Kropp, A. Meier, M. Mateescu, C. Zahn, Teaching and learning agile collaboration, in: Software Engineering Education and Training (CSEE T), 2014 IEEE 27th Conference on, 2014, pp. 139–148. doi:10.1109/CSEET.2014.6816791.
NU S
[12] J. Garbajosa, A. Yague, ¨ E. Gonz´alez, Communication in agile global software development: An exploratory study, in: Meersman et al. [66], pp. 408–417. doi:10.1007/978-3-662-45550-0_41. URL http://dx.doi.org/10.1007/978-3-662-45550-0
MA
[13] Oxford English Dictionary (2004).
D
[14] J. Whitehead, Collaboration in software engineering: A roadmap, in: Future of Software Engineering, 2007. FOSE ’07, 2007, pp. 214– 225. doi:10.1109/FOSE.2007.4.
AC CE P
TE
[15] L. Yu, S. Ramaswamy, A. Mishra, D. Mishra, Communications in global software development: An empirical study using gtk+ oss repository, in: R. Meersman, T. Dillon, P. Herrero (Eds.), OTM 2011, Vol. 7046 of LNCS, Springer Berlin Heidelberg, 2011, pp. 218–227. [16] F. C. Serce, K. Swigger, F. N. Alpaslan, R. Brazile, G. Dafoulas, V. Lopez, Online collaboration: Collaborative behavior patterns and factors affecting globally distributed team performance, Computers in Human Behavior 27 (1) (2011) 490 – 503, current Research Topics in Cognitive Load Theory Third International Cognitive Load Theory Conference. doi:http://dx.doi.org/10.1016/ j.chb.2010.09.017.
[17] E. Carmel, Thirteen assertions for globally dispersed software development research, in: System Sciences, 1997, Proceedings of the Thirtieth Hawaii International Conference on, Vol. 3, 1997, pp. 445– 452 vol.3. doi:10.1109/HICSS.1997.661670. [18] J. Portillo-Rodr´ıguez, A. Vizca´ıno, M. P. and Sarah Beecham, Tools used in global software engineering: A systematic mapping review, Information and Software Technology 54 (7) (2012) 663 – 685. doi: http://dx.doi.org/10.1016/j.infsof.2012.02.006. [19] N. Kamaruddin, N. Arshad, A. Mohamed, Chaos issues on communication in agile global software development, in: Business Engineering and Industrial Applications Colloquium (BEIAC), 2012 IEEE, 2012, pp. 394–398. doi:10.1109/BEIAC.2012.6226091. [20] A. Mishra, J. Munch, D. Mishra, Distributed development of in¨ formation systems, Journal of Universal Computer Science 18 (19) (2012) 2599–2601.
T
ACCEPTED MANUSCRIPT
CR
IP
[21] D. Mishra, A. Mishra, A global software inspection process for distributed software development, Journal of Universal Computer Science 18 (19) (2012) 2731–2746.
NU S
[22] T. Niinimaki, A. Piri, C. Lassenius, Factors Affecting Audio and Text-Based Communication Media Choice in Global Software Development Projects, in: ICGSE 2009, 2009, pp. 153–162. doi: 10.1109/ICGSE.2009.23.
MA
[23] K. Johnston, K. Rosin, Global virtual teams: How to manage them, in: CAMAN 2011, 2011, pp. 1–4. doi:10.1109/CAMAN.2011. 5778849.
TE
D
[24] N. Oza, J. Munch, J. Garbajosa, A. Yague, ¨ ¨ E. G. Ortega, Identifying potential risks and benefits of using cloud in distributed software development., in: J. Heidrich, M. Oivo, A. Jedlitschka, M. T. Baldassarre (Eds.), PROFES, Vol. 7983 of LNCS, Springer, 2013, pp. 229–239.
AC CE P
[25] A. Mishra, D. Mishra, Cultural issues in distributed software development: A review, in: Meersman et al. [66], pp. 448–456. doi:10.1007/978-3-662-45550-0_45. URL http://dx.doi.org/10.1007/978-3-662-45550-0 [26] B. A. J. Fernando, T. Hall, A. Fitzpatrick, The impact of media selection on stakeholder communication in agile global software development: A preliminary industrial case study, in: Proceedings of the 49th SIGMIS Annual Conference on Computer Personnel Research, SIGMIS-CPR ’11, ACM, NY, USA, 2011, pp. 131–139. doi:10.1145/1982143.1982177. [27] J. S. Persson, L. Mathiassen, I. Aaen, Agile distributed software development: enacting control through media and context, Inf Sys J. 22 (6) (2012) 411–433. doi:10.1111/j.1365-2575.2011.00390.x. [28] M. Hummel, C. Rosenkranz, R. Holten, The role of communication in agile systems development, ”Business and Inf. Sys. Eng.” 5 (5) (2013) 343–355. doi:10.1007/s12599-013-0282-4. [29] J. Paredes, C. Anslow, F. Maurer, Information visualization for agile software development, in: Software Visualization (VISSOFT), 2014 Second IEEE Working Conference on, 2014, pp. 157–166. doi:10. 1109/VISSOFT.2014.32. [30] E. Papatheocharous, A. S. Andreou, Empirical evidence and state of practice of software agile teams, Journal of Software: Evolution and Process 26 (9) (2014) 855–866. doi:10.1002/smr.1664.
T
ACCEPTED MANUSCRIPT
NU S
CR
IP
[31] J. K¨aa¨ ri¨ainen, J. Eskeli, S. Teppola, A. V¨alim¨aki, P. Tuuttila, M. Piippola, Extending global tool integration environment towards lifecycle management, in: R. Meersman, P. Herrero, T. Dillon (Eds.), OTM 2009, Vol. 5872 of LNCS, Springer Berlin Heidelberg, 2009, pp. 238–247. doi:10.1007/978-3-642-05290-3_35. [32] P. Runeson, M. Host, ¨ Guidelines for conducting and reporting case study research in software engineering, John Wiley Sons, 2012.
MA
[33] D. Graziotin, X. Wang, P. Abrahamsson, Do feelings matter? on the correlation of affects and the self-assessed productivity in software engineering, Journal of Software: Evolution and Process 27 (7) (2015) 467–487.
D
[34] V. Vroom, Work and Motivation, Willey, 1964.
TE
[35] J. Adams, Inequity in social exchange. In L. Berkowitz (Ed.), Advances in experimental social psychology (Vol 2, pp. 267-299), Academic Press, 1965.
AC CE P
[36] H. J. Yoon, S. Y. Sung, J. N. Choi, Mechanisms underlying creative performance: Employee perceptions of intrinsic and extrinsic rewards for creativity, Social Behavior and Personality: an international journal 43 (7) (2015) 1161–1179. [37] J. Creswell, Research Design: Qualitative, Quantitative, and Mixed Methods Approaches, SAGE, 2014. [38] R. K. Yin, Case study research: Design and methods, Sage publications, 2003. [39] T. C. Lethbridge, S. E. Sim, J. Singer, Studying software engineers: Data collection techniques for software field studies, Emp. Softw. Eng. 10 (3) (2005) 311–341. doi:10.1007/s10664-005-1290-x. [40] J. Herbsleb, D. Paulish, M. Bass, Global software development at siemens: experience from nine projects, in: Software Engineering, 2005. ICSE 2005. Proceedings. 27th International Conference on, 2005, pp. 524–533. doi:10.1109/ICSE.2005.1553598. [41] T. D. Nils Brede Moe, Torgeir Dingsoyr, A teamwork model for understanding an agile team: A case study of a scrum project, Information and Software Technology 52 (5) (2010) 480 – 491, ¡ce:title¿TAICPART 2008¡/ce:title¿ ¡ce:subtitle¿TAIC-PART 2008¡/ce:subtitle¿. doi: 10.1016/j.infsof.2009.11.004.
T
ACCEPTED MANUSCRIPT
CR
IP
[42] J. McCall, Factors in Software Quality: Preliminary Handbook on Software Quality for an Acquisiton Manager, Vol. 1-3, General Electric, 1977.
NU S
[43] B. W. Boehm, Characteristics of Software Quality, 1st Edition, Vol. 1, North-Holland Publishing Company, 1978. [44] ISO/IEC25000, Systems and software engineering – systems and software quality requirements and evaluation (square), Tech. rep., ”ISO” (2014).
D
MA
[45] R. Briggs, G. de Vreede, B. A. Reinig, A theory and measurement of meeting satisfaction, in: System Sciences, 2003. Proceedings of the 36th Annual Hawaii International Conference on, 2003, pp. 8 pp.–. doi:10.1109/HICSS.2003.1173677.
TE
[46] R. Hoda, J. Noble, S. Marshall, The impact of inadequate customer collaboration on self-organizing agile teams, Information & Software Technology 53 (5) (2011) 521–534.
AC CE P
[47] D. E. Strode, S. L. Huff, B. Hope, S. Link, Coordination in co-located agile software development projects, Journal of Systems and Software 85 (6) (2012) 1222 – 1238, special Issue: Agile Development. doi:http://dx.doi.org/10.1016/j.jss.2012.02.017. [48] A. Fink, How To Conduct Surveys: A Step-by-Step Guide, Sage, 2012. [49] D. Hartmann, R. Dymond, Appropriate agile measurement: Using metrics and diagnostics to deliver business value, in: Proc. of AGILE 2006, IEEE CS, Washington, DC, USA, 2006, pp. 126–134. doi: 10.1109/AGILE.2006.17. [50] A. Janes, B. Russo, G. Succi, Using non-invasive measurement techniques in agile software development: a swot analysis (2004). [51] R. Krueger, M. Casey, Focus groups: a practical guide for applied research, Sage, 2009. [52] C.-C. Tsai, A research on selecting criteria for new green product development project: taking taiwan consumer electronics products as an example, Journal of Cleaner Production 25 (0) (2012) 106 – 115. doi:10.1016/j.jclepro.2011.12.002. URL http://www.sciencedirect.com/science/article/pii/ S0959652611005105
T
ACCEPTED MANUSCRIPT
CR
IP
[53] R. Yin, Case Study Research: Design and Methods, Applied Social Research Methods, SAGE Publications, 2013. URL http://books.google.es/books?id=Ace0kgEACAAJ
NU S
[54] R. Yin, Case Study Research: Design and Methods, 2nd Edition, Sage Publications, Thousand Oaks, CA, 1994. [55] R. Stake, The Art of Case Research, SAGE Publications, 1995.
MA
[56] I. Benbasat, D. Goldstein, M. Mead, The case research strategy in studies of information systems, MIS Quarterly 11 (3) (1987) 369–386.
D
[57] W. J. Orlikowski, J. J. Baroudi, Studying information technology in organizations: Research approaches and assumptions, Inf Sys Res 2 (1) (1991) 1–28.
TE
[58] A. Strauss, J. Corbin, Basics of Qualitative Research: Grounded Theory Proce-dures and Techniques, 2nd ed., SAGE Publications, 1998.
AC CE P
[59] G. Guest, A. Bunce, L. Johnson, How many interviews are enough? an experiment with data saturation and variability, Field methods 18 (1) (2006) 59–82. [60] J. Martin, A. Yague, E. Gonzalez, J. Garbajosa, Making software factory truly global: the smart software factory project, Software factory magazine. [61] K. Schwaber, Agile Project Management With Scrum, Microsoft Press, Redmond, WA, USA, 2004. [62] P. Deemer, G. Benefield, The scrum primer. an introduction to agile project management with scrum, Tech. rep., InfoQ (2007). URL http://www.rallydev.com/documents/scrumprimer.pdf [63] K. Schwaber, M. Beedle, Agile Software Development with Scrum, 1st Edition, Prentice Hall PTR, Upper Saddle River, NJ, USA, 2001. [64] V. Sinha, B. Sengupta, S. Chandra, Enabling collaboration in distributed requirements management, Software, IEEE 23 (5) (2006) 52–61. doi:10.1109/MS.2006.123. [65] M. Paasivaara, C. Lassenius, Communities of practice in a large distributed agile software development organization case ericsson, Information and Software Technology 56 (12) (2014) 1556 – 1577, special issue: Human Factors in Software Development. doi:http: //dx.doi.org/10.1016/j.infsof.2014.06.008.
T
ACCEPTED MANUSCRIPT
MA
NU S
CR
IP
[66] R. Meersman, H. Panetto, A. Mishra, R. Valencia-Garc´ıa, A. L. Soares, I. Ciuciu, F. Ferri, G. Weichhart, T. Moser, M. Bezzi, H. Chan (Eds.), On the Move to Meaningful Internet Systems: OTM 2014 Workshops - Confederated International Workshops: OTM Academy, OTM Industry Case Studies Program, C&TC, EI2N, INBAST, ISDE, META4eS, MSC and OnToContent 2014, Amantea, Italy, October 27-31, 2014. Proceedings, Vol. 8842 of Lecture Notes in Computer Science, Springer, 2014. doi:10.1007/ 978-3-662-45550-0. URL http://dx.doi.org/10.1007/978-3-662-45550-0
10. Vitae
AC CE P
TE
D
Agustin Yague: ¨ He is an Associate Professor of the Department of Informatics Systems, Universidad Politcnica de Madrid. He received his PhD degree in Computer Science from UPM. His research interests include software processes, software processes improvement, project management, agile development approaches, system and software testing processes and tools. He participated in several international and national research projects in Smart grids, agile methodologies and global software development. Juan Garbajosa: Juan Garbajosa is Professor at the Informatics School of the Technical University of Madrid (UPM), Spain. He leads the SYST research group, currently working on software innovation, agile software development, software architecting, and Smart Cities and Smart Grids. He has led several European projects; currently CPSE-Labs. Past ISO/IEC-JTC1-SC7-WG20 Convenor. SWEBOK V3 co-editor. He has authored papers in leading journals and conferences. General Programme co-Chair in XP2011 conference. Before joining UPM he served over fifteen years in industry. He is Senior Member of IEEE, and a member of ACM. Jessica D´ıaz: Jessica D´ıaz is an assistant professor (lecturer) at the Technical University of Madrid (E.T.S. Ingeniera de Sistemas Informticos, UPM), Spain. She received her PhD degree in Computer Science from UPM in 2012. She had a postgraduate official grant awarded by the UPM. She participated in several national and international projects related to Software Engineering and ICT on cyber-physical systems, such as Smart Grids,
T
ACCEPTED MANUSCRIPT
AC CE P
TE
D
MA
NU S
CR
IP
Smart Buildings, etc. Her research interests are focused on software architectures, software product lines (SPL), agile software development (ASD), software evolution, and model-driven development (MDD), autonomic computing, and smart sensor networks. Eloy Gonz´alez: BSc (Bachelor of Science) and MSc (Master of Science) in Aerospace Engineering by the University of Texas at Austin, works at Indra Software Labs (ISL) as Senior Manager and Project Director for Indra Sistemas and has been focused on Utilities markets, Energy Technologies and Internal Systems. More than 15 years experience working at international environments on the development and deployment of distribution network management products on Spain, Africa and Latin America. Recently he has managed the ISL distribution products area serving numerous clients in several countries and has coordinated an important number of R&D proposals.
ACCEPTED MANUSCRIPT
IP
SC R
NU
MA
D
TE
CE P
Media tools are not sufficient to support communication in agile global development Media and tools informing on the product/process status, help address lack of consensus Communication is better supported combining media, process and product status tools Process, product and media tools create a common ground, positive for information sharing Dependency on bandwidth in agile global software development is still an issue
AC
T
highlights