Oct 10, 2018 - cedents (factors present in the situation prior to the introduction of an innova .... tion 2) Persuasion or formation of an attitude towards the innovation 3) Deci ...... http://citeseerx.ist.psu.edu/viewdoc/download?doi=10.1.1.190.4131&rep=rep1&type · =pdf. [29] Evenson, R. and Westphal, L. (1995) Technological ...
Open Journal of Business and Management, 2018, 6, 857-889 http://www.scirp.org/journal/ojbm ISSN Online: 2329-3292 ISSN Print: 2329-3284
An Exploratory Study of Innovation Adoption in Estonia Andrew Adjah Sai Estonian Business School, Tallinn, Estonia
How to cite this paper: Sai, A.A. (2018) An Exploratory Study of Innovation Adoption in Estonia. Open Journal of Business and Management, 6, 857-889. https://doi.org/10.4236/ojbm.2018.64064 Received: August 30, 2018 Accepted: October 7, 2018 Published: October 10, 2018 Copyright © 2018 by authors and Scientific Research Publishing Inc. This work is licensed under the Creative Commons Attribution International License (CC BY 4.0). http://creativecommons.org/licenses/by/4.0/ Open Access
Abstract The purpose of this paper is to extend innovation-decision process (IDP) research. Focusing at the individual level of analysis, the paper empirically describes the adoption of an innovation—the Smart identification (ID) technology—in Estonia. The paper opted for an exploratory study using both quantitative and qualitative approaches. To this end, 568 subjects completed questionnaires assessing aspects of the five innovation-decision stages. Hypotheses were tested simultaneously in iterative mediation and moderated mediation analysis. The analysis is modeled along the key aspects and phases proposed by Everett Rogers (2003). Consistent with Rogers’ theory and as hypothesized, earlier stages of the innovation-decision process predicted later stages. However, Implementation did not predict Evaluation stage variables. The conclusions show that the IDP model is supported overall, and that additional work is needed to describe further the process of adoption in different social contexts, such as Estonia. It also identified that role and time are important explanators in innovation diffusion research. Practical implications and future research are suggested.
Keywords Diffusion, Estonia, Innovation-Decision, Smart ID, Technology Adoption
1. Introduction Innovation has been defined differently by many scholars. For example, innovation has generally been argued to be both the production of creative ideas and their implementation as the first and second stages respectively [1]. To economists, innovation is conceived as an outcome, while organizational sociologists see innovation from a process perspective [2]. To many management scholars [3], both earlier viewpoints should be considered with a focus on the adoption DOI: 10.4236/ojbm.2018.64064 Oct. 10, 2018
857
Open Journal of Business and Management
A. A. Sai
process conditions and emerging patterns. In any case, these positions are evolving. One of the most widely accepted definitions of innovation is that by Everett Rogers. Rogers, op. cit., said it is “an idea, practice, or object that is perceived as new by an individual or other unit of adoption”. A unit of adoption could be an organisation, a society and also a target market [4]. The innovation-decision process, according to the diffusion of innovations theory of Rogers involves a technological innovation being communicated through particular channels, over time, among the members of a social system. A key characteristic of this process is that individuals participate in a series of actions related to decisions. This robust decision factor classification framework of Rogers suggests that the adoption of an innovation by an individual, rests on three divisions: 1) antecedents (factors present in the situation prior to the introduction of an innovation); 2) process (information sources as stimuli), and 3) results (adoption or rejection of the innovation). Antecedents include factors pertaining to the actor’s identity and perceptions of the situation, while process covers factors related to perceived characteristics of the innovation. Rogers in 2003 revised the original classification introduced in 1962 and rehashed in 1995 and focused on innovation decision process stages [5]. Rogers’ (introduced in 1962, 1983, 1995, revised in 2003) theories have supported the innovation-decision as a multi-stage process through which a decision-making unit passes a number of selective steps. He argued that such processes occur both on the individual and organizational levels. He further posited that understanding the process perspective is relevant as the adoption of new technologies requires resources and efforts to shift towards a new behavior. He suggested therefore that, there was the need to analyze how a decision-making unit (which can be on the individual or organizational level) passes through the adoption process, and which factors ensure a smooth transition from one phase to another in the process. To Rogers, success along every phase can foster diffusion of innovations. He claimed that the process nature of innovation should be investigated through a research-based type of data gathering and analysis that seeks to determine the ordered sequence of a set of events [6]. However, [7] reported that many scholars ignore the proposed sequence. Rogers in 1995, had identified five major categories of individual adopters: 1) Innovators 2) Early Adopters 3) Early Majority 4) Late Majority and 5) Laggards, based on his bell curve. The most striking feature of the innovation diffusion theory is that, for most members of a social system, the innovation decision depends heavily on that of the other members of the system. Hall and Khan in 2003 argued that in the right circumstances, new technologies (or innovations) adopted by members of a community will spread by diffusion [8]. Hall, et al., have asserted that diffusion itself results from a series of individual decisions to begin using a new technology, decisions which are often DOI: 10.4236/ojbm.2018.64064
858
Open Journal of Business and Management
A. A. Sai
the result of a comparison of the uncertain benefits of an invention with the uncertain costs of adopting it. Other scholars in the innovation diffusion stream have sought to develop models to aggregate innovation diffusion. Most of these models are based on a formulation of differential equations that specify the flow between mutually exclusive and collectively exhaustive subgroups such as adopters and nonadopters [9] [10], while more recent reviews have included [11]. All these scholars, especially Mahajan et al., advocate an individual-level modelling approach to “study the actual pattern of social communication, and its impact on product perceptions, preferences and ultimate adoption”. Goldenberg et al., [12] modelled adoption as a probabilistic transition between two states that results either from spontaneous transformation or from word-of-mouth induced awareness. While Nathan Rosenberg in 1972 asserted that the diffusion process is slow and the variations in the rates of acceptance of different innovations are wide, Hall et al., op. cit. posited that although the ultimate decision is made on the demand side, the benefits and costs can be influenced by decisions made by suppliers of the new technology, confirming the other studies such as [13]. The resulting diffusion rate is then determined by summing over these individual decisions. Hall, et al., op. cit., further noted that the most important thing to observe about this kind of decision is that, at any point in time the choice being made is not a choice between adopting and not adopting but a choice between adopting now or deferring the decision until later and that the reason it is important to look at the decision in this way is because of the nature of the benefits and costs. Opinion dynamics in social systems has been given considerable place in the diffusion literature [14]. This idea stipulates that consumers develop preferences in a collective process of opinion formation. Under the same idea, refusal to adopt is increasingly weighted by neighbour agents as evidence against innovation, based on observed adoption behaviour [15]. Other approaches to modelling innovation decision are based on psychological rules rather than perfect rationality [16] [17] [18]. Social influence has been touched on extensively in diffusion research. There is evidence in the literature in this respect [19] [20] [21] [22] [23]. Many of these studies incorporate positive word-of-mouth mechanisms. Although existing innovation decision models vary to some extent in their terminology, e.g. [24] [25] [26], the fundamental structure follows the process suggested by Everett Rogers (2003). Rogers has said that to understand the rate of adoption in any given situation requires analysing factors that facilitate or militate against adoption. These, he observed include: 1) Knowledge of an innovation 2) Persuasion or formation of an attitude towards the innovation 3) Decision to adopt 4) Implementation of adoption decision, and 5) Confirmation (referred to in this paper as Evaluation). The likely ensuing outcome of the full cycle is innovation diffusion. Nabih, et al., op. cit. [26], observed that, “the acceptance and the continued use” of an innovation is the behaviour most comDOI: 10.4236/ojbm.2018.64064
859
Open Journal of Business and Management
A. A. Sai
monly referred to in the definition of adoption. There is again evidence in the literature about numerous technology adoption and acceptance theories over time [27]. Some of them include: 1) the Theory of Reasoned Action (TRA), which suggests that a person’s intention to perform a behavior is determined by her/his attitude and the subjective norms; 2) the Theory of Planned Behavior (TPB) which extended the TRA and included a perceived behavioral construct; 3) the Technology Acceptance Model (TAM), which argues that the attitude towards using technology is influenced by the perceived ease of use and usefulness; 4) the theory of consumption values, and the five perceived values (functional, social, emotional, epistemic and conditional values) to explain how customers make market choices. In 1995, as noted earlier, Rogers introduced 5) the Innovation Diffusion Theory (IDT), which holds that the adoption rate of innovation depends on its relative advantage, compatibility, triability, observability and complexity, among other arguments. Rogers, op. cit., revised the theory in 2003. In the same year, 2003, 6) the Unified Theory of Acceptance and use of Technology (UTAUT) integrated constructs from the TRA, TPB, TAM, IDT, some motivational models, model of PC utilization and social cognition theory. By 2009, 7) the Green ICT Adoption Model (GITAM) was introduced. Now, studies over the years have focused on adoption of new technologies both generally [28] [29]; and more specifically: adoption of on-board information technology (IT) by firms in the trucking industry [30]; role of network effect in Automated Teller Machine (ATM) adoption by banks; education, consumer skills and learning in consumer adoption of electronic banking in the United States [31]; adoption of new technologies in agriculture [32] [33], education and learning [34] [35]; adoption of medical technology [36]; Supplier relations and adoption of new technologies [13]. More recent empirical studies have investigated determinants of adoption and non-adoption decisions. [37]. In the paper, the study location is Estonia, a Baltic country in Eastern Europe. According to the studies of [38], over the last two decades, the country has made tremendous technological progress. Every Estonian citizen or legal resident, irrespective of their location, has a state-issued digital identity. As a result, legal residents can authenticate their identity (ID) online without physical contact, use digital signatures, and access electronic services’ portals using their ID cards, Mobile ID, Bank codes or PIN Calculators and the new Smart ID. The Smart ID technology, introduced in Estonia at the beginning of 2017, is a convenient new mobile application that works as an identification solution to securely prove online identity. According to Freedom House, 98% of the population have ID cards, 88% use internet regularly and 350 million digital signatures have been recorded [39]. It is worthy of note that the Smart ID is non-commercial, at least from the user end. There is extensive research on the IDP as well as diffusion of innovations, as alluded to earlier, but not a single about Estonia. DOI: 10.4236/ojbm.2018.64064
860
Open Journal of Business and Management
A. A. Sai
This study seeks to: • Extend what is known about the factors affecting adoption of new technologies, • Identify the factors important either in facilitating or militating against adoption of the Smart ID technology by individuals in Estonia, and • Propose recommendations to solving problems and reducing barriers to new technology adoption.
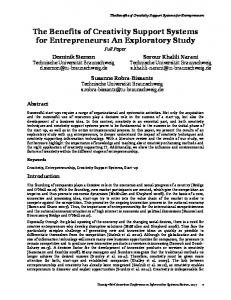
2. Research Hypotheses In the paper, the author will investigate adoption of the Smart ID technology using the factors known to affect new technology adoption. Employing a mediation analysis in sub-models I to III (hypotheses 1 to 3) and moderated mediation analysis in sub-model IV (hypothesis 4), the author will investigate if “Role of individual” mediates the relationship between Knowledge, Persuasion, Decision, Implementation and Evaluation, as well as if Length of Stay (Time) moderates the likely relationship between Implementation and Evaluation through Role (see Figure 1 for an overview of tested hypotheses). The theory underpinning the model tested in this paper is grounded in the classical diffusion of innovations theory [40] [41] [42] [43] [44] introduced by Rogers and the works of Frambach & Schillewaert op. cit.; that the process nature of innovation should be investigated through a research-based type of data gathering and analysis seeking to determine the ordered sequence of a set of events. The entire study is modeled along selected aspects and phases of the Innovation Decision Process (IDP) framework proposed by Everett Rogers. In the ensuing sections, each of Roger’s key phases is reviewed and hypotheses stated. Indeed, there is some empirical support from several studies such as [45] [46] [47], showing that the innovation process as it unfolds over time is messy, reiterative, and often involves two steps forward for one step backwards plus several side steps. Does the IDP framework follow the order as posited by Rogers in the context of Estonia, which is an unexplored social system, in terms of the innovation decision-process framework? What are the factors that trigger accelerated adoption of new technologies such as the Smart ID? Four sets of hypotheses were developed. First, the author hypothesized that the outcome would be consistent with Rogers’ innovation-decision process model. Specifically, the expectation is that each of the stages of the IDP would predict subsequent stages and that knowledge levels would predict the extent to which the subjects had been persuaded in favor of the Smart ID innovation, which in turn, would predict their decision making, to implement the innovation. Decisions at post-implementation were then expected to predict self-reported implementation thereafter, which in turn would predict confirmation of the decision after dissemination. Figure 1 summarises the Hypothesized Model. DOI: 10.4236/ojbm.2018.64064
861
Open Journal of Business and Management
A. A. Sai
Figure 1. Hypothesized model.
2.1. Knowledge of an Innovation Rogers, op. cit., had argued in 1995 that communication is the process by which participants create and share information with one another in order to reach a mutual understanding. To Rogers, what underlies the diffusion process is information exchange. The process he added involves: 1) an innovation (here the Smart ID technology), 2) an individual or unit of adoption that has knowledge or experience with using an innovation, 3) another individual or unit of adoption, without knowledge of the innovation and 4) a communication channel connecting the two units (2 and 3 above). He had in the same publication noted that, in connection with the categories of adopters, there are four main elements in the diffusion of innovations, which are 1) the innovation 2) communication channels 3) time and 4) a social system. In Rogers’ model, Knowledge is the first stage in the IDP framework and suggests that, when an individual is exposed to an innovation’s existence and gains some understanding of how it functions, knowledge occurs. It has been argued that spreading an innovation can have the most powerful effect on adoption and consequent diffusion. For example, Hauser et al., in 2007 summarised research on innovation from a marketing perspective and agreed. Rogers further argued that knowledge of innovations influences attitudes to new innovations. Meanwhile, research has shown that strong interpersonal ties are usually more effective in the formation and change of strongly held attitudes and that such attitudes are developed through communication exchanges about the innovation with peers and opinion leaders in the adoption chain. To eliminate a deficit of awareness of an innovation, mass media channels have been suggested as the most appropriate. A generalisation that mass media channels are relatively more DOI: 10.4236/ojbm.2018.64064
862
Open Journal of Business and Management
A. A. Sai
important at the knowledge function, and interpersonal channels are relatively more important at the persuasion function has been made by Rogers and Shoemaker [48]. Communication has been seen as a convergence of meaning achieved by symbolic interaction, with the product of the convergence process being adoption, rejection, modification or creation of an innovation [49]. In any case, Rogers and Kincaid in their previous works observed that interpersonal networks are the most important in the diffusion process while mass communication channels play a significant role in diffusion. Lippman et al., investigated the impact of three types of informational returns to scale (cheaper, faster and better) and concluded that the decision to adopt or otherwise is made later when information is cheaper, and the change in timing is unsignable in the case of faster arrival of information, and that only more accurate (better) information leads to earlier innovation decisions [50]. According to Kaplan [51], awareness should motivate the individual to seek further information about the innovation attributes and thereby proceed to the persuasion stage. Based on these arguments, the first hypothesis is stated as follows: H 1 There is a significant positive relationship between Knowledge of new technologies and Persuasion to adopt mediated by Role of individual.
2.2. Persuasion to Adopt an Innovation Persuasion is the second stage in the IDP and occurs when an individual forms a favourable or unfavourable attitude toward the innovation. [52] theorized that early adopters are willing to take the risk of adoption without gaining information from their social systems and therefore, tend to be risk takers in this light. To them, consumers differ in terms of their reliance on others for information and assistance when making new innovation decisions. Research has shown that product characteristics can affect adoption decisions [53]. One of the key characteristics, which has been influential in consumer adoption of innovation is network externality, aside innovation newness, compatibility, feature richness and perceived risks. Recent studies have suggested that persuading opinion leaders is the easiest way to foment positive attitudes toward an innovation. Rogers, op. cit. explains that the types of opinion leaders that change agents should target depend on the nature of the social system. Social systems have been characterized as heterophilous or homophilous [43]. On one hand, heterophilous social systems tend to encourage change from system norms. In them, there is more interaction between people from different backgrounds, indicating a greater interest in being exposed to new ideas. It has been argued that these systems have opinion leadership that is more innovative because these systems are desirous of innovation, whereas, homophilous social systems tend toward system norms. Most interaction within them is between people from similar backgrounds. People and ideas that differ from the norm are seen as strange and undesirable. These systems have opinion leadership that is not very innovative because these systems are averse to innovation. Opinion leadership is the degree DOI: 10.4236/ojbm.2018.64064
863
Open Journal of Business and Management
A. A. Sai
to which an individual is able to influence other individual’s attitudes or overt behaviour informally in a desired way with relative frequency. Katz [54] made a connection between media, opinion leaders and opinion followers while Rogers posited that the structure of a social system can facilitate or impede the diffusion of innovations in the system. This argument is further stretched with the view that, a group with similar attributes such as language, beliefs, education and social status, experience better transfer of new ideas. Lustig and Koester noted that members outside the original social system, whose norms, values and adoptive behaviours violated the original were likely to form some resistance to the new [55]. Markus [56] wrote “innovation spreads when others either observe the early adopters and imitate them to replicate their profits or communicate with early adopters and are persuaded or induced to adopt”. Fill [57] added that “testimonies from those who have experienced the product become very important” while Gouws et al., and Florea [58] noted that positive perceptions of relative advantage, compatibility, complexity, triability and observability are processes necessary in order to proceed from the Persuasion stage to the Decision stage of the innovation-decision process, in agreement with Rogers. Following the above arguments, the second hypothesis is: H 2 There is a significant positive relationship between Persuasion to adopt new technologies and the Decision to adopt, mediated by Role of individual.
2.3. The Innovation Decision Rogers, in 2003, in the fifth edition of his publication, Diffusion of Innovations [43], noted that innovation decisions are of several types. These include: 1) optional innovation-decisions, 2) collective innovation decisions, 3) authority innovation-decisions. (pp. 28-29) and 4) contingent innovation-decisions (p. 30). In any case, decision is the third stage in the IDP framework and occurs when an individual engages in activities that lead to a choice to adopt or reject the innovation. The innovation-decision is made through a cost-benefit analysis where the major obstacle is uncertainty. The argument is that people will adopt an innovation if they believe that it will, all things considered, enhance their utility. So, they must believe that the innovation may yield some relative advantage to the idea it supersedes. That means an appraisal of the disruptive nature of the new technology to other functioning facets of daily life, level of uncertainty attached to the innovation, workability of new innovation or technology and what new challenges the new could introduce to daily life. It is an accepted position among diffusion scholars that since people are on average risk-averse, the uncertainty will often result in a postponement of the decision until further evidence can be gathered. But the key is that this is not the case for everyone. Each individual’s innovation-decision is largely framed by personal characteristics, summed into their technology orientation and this diversity is what makes diffusion possible. The personal characteristics of individuals and interaction of the DOI: 10.4236/ojbm.2018.64064
864
Open Journal of Business and Management
A. A. Sai
various segments illuminates the spread and its consequent effect. Consumers at this stage refine their perception of an innovation and decide whether to adopt or reject it [59]. The decision stage results in an intention, although not yet to concrete behavior. On the contrary, in the implementation stage, intentions transform into actual behaviour [60]. Another dimension to innovation diffusion theory is social setting. In 2003, Rogers said “an innovation’s incompatibility with cultural values can block its adoption (p. 241), adding that the knowledge-persuasion-decision process sequence proposed in the model of the innovation-decision process may be somewhat culture-bound and that in some sociocultural settings, the knowledge-decision-persuasion sequence may occur frequently, at least for some innovations” (p. 179). For these reasons, the third hypothesis set out to prove the following: H 3 There is a significant positive relationship between Decision to adopt and Implementation of innovation mediated by Role of individual.
2.4. Evaluation of Innovation: Role as a Mediator, Length of Stay as Moderator Empirical evidence from several studies have shown that respondents sought information after they had made the decision to adopt and before. At the Evaluation stage, the individual seeks reinforcement for the innovation decision already made but may reverse this decision if exposed to conflicting messages about the innovation. This has been referred to as Discontinuance [43]. The Evaluation (confirmation) stage continues after the decision to adopt or reject for an indefinite period of time [61] [62]. Throughout the confirmation stage, the individual seeks to avoid a state of dissonance or to reduce it if it occurs. In this stage, consumers seek reinforcement of their adoption or rejection behaviour. Individuals are the most important element in the diffusion process according to the IDP model. Role of individual is a key in the adoption chain. In the IDP generally, Role is seen from the technology orientation of an individual or one’s placement in the social system. In this paper, Role of individual extends additionally to undertakings of each individual in the study that could significantly impact the outcome of the adoption decision. User roles cannot be neglected in technology adoption. Roles have been known to predict attitudes towards innovation adoption [63]. Intention-based models have been successful in investigating attitudes as mediators between beliefs and intentions [64] [65]. The attitude towards adopting a particular system is formed by individual beliefs about the consequences of adopting a particular system and the evaluation of the resulting consequences [66]. Similarly, user attitudes influence the adoption of new technologies [67]. The present study will investigate whether Role of individual mediates the adoption relationships in H1 to H4. Time is another important element in the diffusion process. In fact, most othDOI: 10.4236/ojbm.2018.64064
865
Open Journal of Business and Management
A. A. Sai
er behavioural science research is timeless in the sense that, the time dimension is simply ignored. Time is an obvious aspect of any communication process, but most (non-diffusion) communication research does not deal with this explicitly. Perhaps, it is a fundamental concept that cannot be explained in terms of something more fundamental. According to Rogers, time does not exist independently of events, but is an aspect of every activity [43]. The inclusion of time as a variable in diffusion research is one of its strengths (p. 20). Time has been considered intrinsic to the process of communicating, even more so if the concept being communicated is unknown to the audience. The study also investigates whether Length of Stay in Estonia moderates the proposed relationship between the Implementation and Evaluation decisions, suggesting that this relationship is weak when there is strong Length of Stay. Specifically, the author will investigate whether Length of Stay moderates the already proposed indirect relationship between Length of Stay, Role of Individual and Evaluation, so that when the Length of Stay is strong, the proposed indirect relationship from Implementation via Role to Evaluation will be weaker. Against this backdrop, the fourth hypothesis is stated as follows: H 4 The indirect association between Implementation and Evaluation through Role is conditionally dependent upon levels of Implementation, so that the relationship between Role and Evaluation is only present when Implementation is weak.
3. Method 3.1. Procedure and Sample A survey was developed, and measurements were validated through initial pilot data collections using selected samples. The initial sample count was 9, purposefully selected to check theoretical saturation. The results of the initial pilot led to a regrouping, re-alignment and recomposing of the number of standardised inventories. The author then implemented the survey online, using a general sample to test the hypotheses. The following subsections provide the details of the measurement development and implementation.
3.2. Instruments The questionnaire was composed of a number of inventories, including scales measuring Knowledge, Persuasion, Decision, Implementation and Evaluation. The survey was modelled along the Innovation-Decision Process by Everett Rogers [42] [43]. The questionnaire was made up of 14 items grouped and adapted based on the Innovation-Decision Process Model and Innovation Diffusion Theory (IDT). Knowledge was measured on two items, Awareness of Smart ID technology (Likert scale: Not Aware at all = 1; Very Aware = 5). How did you learn about the Smart ID, was assessed with “from own research”, “from social media”, “from peers, family and friends”, and “from banks and other stakeholders”. DOI: 10.4236/ojbm.2018.64064
866
Open Journal of Business and Management
A. A. Sai
Persuasion was assessed in two ways. Respondents were asked to indicate their preference for logging into e-services’ platforms in Estonia. The options included “Mobile ID”, “ID Card”, “Bank Code Cards”, “PIN Calculator” or “Other”. Respondents were also asked on a 5-point Likert response scale ranging from 1 (Not difficult at all) to 5 (Very difficult), to indicate the degree of difficulty with migrating from their known platforms to the new Smart ID technology. For Decision, respondents were asked to select from the following, which best described their technology orientation: 1) “sceptical of new technologies and use them only when I have to”, 2) “usually one of the last to use new technologies”, 3) “I use new technologies when most people I know do”, 4) “I like new technologies and use them before most people I know” and 5) “I love new technologies and among the first to experiment and use them”. Innovators fall into the item one group as being venturesome and enjoying being on the cutting-edge, while early adopters, early majority, late majority and laggards fall into groups two, three, four, and five respectively, and as represented in the scale. Implementation was assessed on two items: “Have you used the Smart ID technology already” measured using a 2-scale response, 1 (Yes), 2 (No). Based on the influence of time on the decision and also the Dissonance theory (Leuthold, op. cit.), where a decision is reversed, the author assessed how long respondents had used the Smart ID technology for (1—“less than a month”, 2—“1 to 2 months”, 3—“3 to 6 months” and 4—“6 to 12 months”). Evaluation consisted of three core items describing the different forms of outcomes in relation to faster access to e-services, increased convenience to e-services portals and safer access to e-services. Responses were given on a frequency scale from 1 to 5, (where 1 represents “Strongly Disagree” and 5 “Strongly Agree”). Length of stay in Estonia consisted of 1 (“Less than a year”), 2 (“1 to 2 years”), 3 (“3 to 5 years”) and 4 (“more than 5 years”). Role consisted, 1 (“student only”), 2 (“employed (worker) at an organisation only”), 3 (“student, but employed”), 4 (“Other”). Gender, Age and Education levels were used as control variables in the statistical analyses. The measures were developed, refined and ultimately validated during the pilot test phase in July 2017. They are based on the IDP framework and IDT by Everett Rogers. Data from 9 samples were used to validate the scales for the final measurement model. During this item development process, each measurement model was assessed by looking at the reliability of the indicators, the internal reliability of the measurement scales and the discriminant validity of the indicators. In completing each assessment of the measures, any items with questionable validity were reviewed for face validity (to ensure that they were not essential to the meaning of the construct); if they were non-essential, the author removed them and re-ran the partial least squares (PLS) analysis. Some items were carefully reworded for clarity, and another group was then asked to respond to the DOI: 10.4236/ojbm.2018.64064
867
Open Journal of Business and Management
A. A. Sai
revised items, and the author then subjected their responses to the same PLS analysis. This process was repeated until the author was satisfied with the properties of all the measurement items.
3.3. Survey Implementation The participants in this study are residents of Estonia. The questionnaires were distributed from August to November 2017 via email and also social media in Estonia. Altogether, 568 responses were returned (excluding the pilot sample). 46.5% of the respondents were students, of which 15.5% were employed concurrently. 43.7% of the respondents were workers only, and the remaining 9.8% were uncategorised. For demographics, the average age of the respondents was 21.5 years (SD = 0.79), varying from 18 to more than 45 years and 73.2% of the respondents were men (N = 416). Regarding their level of studies, 14.1% of the sample lacks university studies. Participation was voluntary. Anonymity and confidentiality were guaranteed. Permission was sought from closed-membership group administrators and in some cases, university student and other association representatives, including resident groups, to access members and distribute the survey questionnaire. The survey was then implemented through online media resources, particularly the online provider Facebook Groups using Google Forms. Descriptive information concerning the 568 subjects who completed the survey, is shown in Table 1.
3.4. Statistical Analyses In order to properly assess the path coefficients in the research model, the author first examined the indicator reliability, internal consistency reliability, discriminant validity, and convergent validity of the reflective measurement model to ensure they are satisfactory [68]. The author first utilised the PLS technique—specifically, Smart PLS version 3.0.M3 [69]—to analyse the data. Given the sample size and the complexity of Table 1. Subject demographics. N = 568
N
Percent
18 - 24
88
15.5
25 - 34
360
63.4
35 - 44
64
11.3
More than 45
56
9.9
Female
152
26.8
Male
416
73.2
High school/Vocational training or equivalent
80
14.1
Undergraduate degree or equivalent
144
25.4
Graduate degree or equivalent
304
53.5
Doctoral degree or equivalent
40
7.0
Age
Gender
Education
DOI: 10.4236/ojbm.2018.64064
868
Open Journal of Business and Management
A. A. Sai
the theoretical model, the use of PLS is appropriate [70]. The analysis confirmed the measurement model. The results are reported. The author confirmed the measurement model first, through PLS by testing for item and scale reliability, internal consistency, and convergent/discriminant validity. After examining the outer loadings for all latent variables, some items were removed because their outer loadings were smaller than the 0.4 threshold level suggested by [71]. After reviewing the model from a face validity basis and re-running the model to ensure there were no differences in the structural model results, the author decided to remove the indicator variable LRNG (Learning about Smart ID) from the Knowledge construct and LENGTH_UD (Length of use of Smart ID) from the Implementation construct in an effort to capture as much of the meaning of the constructs as possible without distorting the model. These alterations resulted in an increase of Average Variance Extracted (AVE) and composite reliability (CR) of their respective latent constructs. All retained indicators had outer loadings higher than 0.7 [72] [73] (Table 2 shows the outer loadings). To assess scale reliability and internal consistency, the author considered the CR score and the AVE. For adequate reliability, the CR score should be greater than 0.70 in exploratory research or 0.80 in more mature streams of research (Fornell, op. cit.). All of the CR scores exceeded 0.85. In addition, all AVE scores exceeded the recommended level of 0.50 suggested by [74]. The AVE was calculated by averaging the R-squared values of the reflective constructs. The CR and AVE and Cronbach’s Alpha (CA) scores for the factors are shown in Table 3. Prior research suggests that a threshold level of 0.60 or higher is required to demonstrate a satisfactory composite reliability in exploratory research (as suggested by [73]). The Composite Reliability (CR) values for the Evaluation (EV) Table 2. Outer loadings. Construct (Latent variables)
Outer Loading
>0.7
Single item
MD