1. Introduction. The role that performance measurement plays in helping firms achieve and sustain their .... commitment to R&D, they will more likely feel the need to monitor these activities and hence to ...... SPSS For Windows: An Introduction.
Liuc Papers, n. 218, Serie Tecnologia 14, luglio 2008
AN EXPLORATORY STUDY ON R&D PERFORMANCE MEASUREMENT PRACTICES: A SURVEY OF ITALIAN R&DINTENSIVE FIRMS Vittorio Chiesa, Federico Frattini, Valentina Lazzarotti, Raffaella Manzini, Ignazio Troja
1. Introduction The role that performance measurement plays in helping firms achieve and sustain their competitive advantage has been largely acknowledged by management literature in the last decades [e.g., Eccles, 1991; Lebas, 1995; Merchant, 1998]. In the 1990s some revolutionary changes took place (i.e. technology fusion and proliferation, shortening of product life-cycles, intensified competition), that pushed top managers interest toward the measurement and assessment of R&D performance [Ortt and Smits, 2006]. Therefore R&D started to be considered accountable in terms of its efficiency, effectiveness, internal and external customer focus and alignment to corporate and business strategy [Kumpe and Bolwijn, 1994; Pearson et al., 2000] and the possibility to adopt PMSs in R&D settings raised the attention of both academics and practitioners [e.g., Pappas and Remer, 1985; Brown and Svenson, 1988; Chiesa and Masella, 1996; Sivathanu and Srinivasa, 1996; Werner and Souder, 1997; Hauser, 1998; Driva and Pawar, 1999; Driva et al., 2000; Poh et al., 2001; Godener and Soderquist, 2004; Ojanen and Vuola, 2006]. As a result of this increased interest for the measurement of R&D activities performance, scholars started investigating the topic from different although complementary perspectives. The most relevant questions that have been addressed so far are: (i) how to design a PMS that fits the characteristics of R&D activities [Kerssens-van Drongelen and Cook, 1997; Kerssens-van Drongelen and Bilderbeek, 1999; Kerssens-van Drongelen et al., 2000; Davila, 2000; Ojanen and Vuola, 2006]; (ii) how the PMS should be implemented and which are the major effects of its use [Bisbe and Otley, 2004; Godener and Soderquist, 2004]; (iii) how metrics and indicators should be selected in an uncertain and unpredictable context like R&D [Ojanen and Vuola, 2006; Chiesa et al. 1996; Nixon, 1998].
1
Liuc Papers n. 218, luglio 2008
Empirical literature on the issue has developed as well and several case studies have been carried out on the topic. Despite the richness of this literature, we believe that one of its major limitations is a strong bias toward the Anglo-Saxon reality, where firms are likely to be encouraged to measure the performance in their R&D units in order to satisfy accounting information disclosure requirements. To what extent and how do companies operating in countries where these type of accounting rules are absent or very weak measure the performance of their R&D activities. The paper aims at addressing this issue, focusing on a sample of Italian firms. Italy represents in fact a context where externally imposed incentives to the measurement of R&D performance are very weak. The Fourth Directive [Gray et al., 1984] is the law that has regulated the disclosure of accounting information for Italian (and European) firms since the early 1980s. It does not entail that companies communicate to external stakeholders structured data about their R&D expenditures; they are merely required to provide a general description of the R&D activities that should be included in the annual report and not necessarily contain quantitative data about R&D activities, neither the simple amount of annual R&D expenses [Hall and Oriani, 2006]. In 2005, new accounting principles have been introduced in Italy, in the wake of an Europe wide harmonisation effort [Arnaboldi and Chiaroni, 2005]. These principles require that more structured data about the firm’s R&D activities are disclosed [IASC, 1998], but they are far from being adopted by Italian firms, especially at the time when our empirical analysis was undertaken (first half of 2007). For these reasons, Italy represented an ideal setting for addressing the above mentioned issue. Furthermore, the empirical literature has often failed to capture the R&D performance measurement phenomenon in its whole complexity. In other words, attempts to study from a systemic perspective the use of Performance Measurement Systems in R&D units, that accounts for the different elements the PMS is made of (e.g., objectives of the measurement, performance dimensions, control objects) are very uncommon, to the best knowledge of the authors. An exception if the work by Kerssen-van Drongelen and Bilderbeek (1999), who investigate the practical choices made by a sample of 225 Netherland firms (48 responses) concerning the major parameters for R&D measurement design. A second objective of this paper is therefore to make a step further in this direction. On the whole, we had therefore a twofold objective: (i) to build a reference framework, through a careful review of the literature and a number of exploratory case studies, that is useful to study the problem of designing a PMS to be applied to R&D units;(ii) to study whether, why and how companies operating in contexts where institutional requirements to disclose R&D information are absent or very weak measure the performance of their R&D units. With this
2
V. Chiesa, F. Frattini, V. Lazzarotti, R. Manzini, I. Troja, An exploratory study on R&D performance measurement…
purpose, we used the framework developed in the first stage of the research as a reference model for a survey that involved a panel of Italian firms. We focused in particular on R&Dintensive companies, which are defined as those firms that heavily invest in and are strongly committed to R&D activities [Deeds, 2001]. We decided to focus the scope of our empirical analysis on these firms under the assumption that, because of their significant financial commitment to R&D, they will more likely feel the need to monitor these activities and hence to keep their performance under control. The paper is structured as follows. Section 2 describes the theoretical framework that was built at the outset of our research project and used to support the empirical investigation. Section 3 develops the research questions, describes the research methodology and illustrates the details of the survey design. In Section 4 we present and discuss the results of the survey, while Section 5 concludes and outlines some directions for future research.
2. The reference framework In this section, we synthetically develop the model we have been using as a reference framework in the survey study that is reported in this paper. In doing so, we will basically review literature adopting a systemic approach in the design of a PMS for R&D; moreover, as it is common in analytical conceptual research [Wacker, 1998], we will support our arguments using some empirical observations drawn from our exploratory case studies, that have been described in detail in previous articles [e.g., Frattini et al., 2006; Chiesa et al., 2007; Chiesa and Frattini, 2007].
2.1. Designing a performance measurement system for R&D units In order to identify the constitutive elements of a PMS for R&D units, we analysed both literature on accounting – business performance measurement and on R&D – innovation management. From the literature on accounting and business performance management [e.g., Azzone, 2006; Kaplan and Norton, 1992], we have basically drawn a systemic approach to performance measurement. According to this standpoint, in the design of a PMS a first fundamental step consists in clearly identifying the measurement objectives, i.e. the specific aims for which the system is designed and implemented. Once the objectives have been designed, it is possible to define the dimensions of performance to be monitored and the operative techniques to be used in order to measure the performance selected for a specified control object. The PMS also specifies some critical process aspects, basically the standards against which the measured
3
Liuc Papers n. 218, luglio 2008
performance should be evaluated and the frequency of the measurement. This very general reference frame can be easily applied to R&D contexts. With this purpose, we used extant literature about R&D-innovation management and performance measurement in order to operationalize the basic elements – PMS objectives, structure, dimensions of performance, process – that it comprises. As far as the objectives of the PMS are concerned, literature has widely investigated the purposes for the use of a PMS in R&D units. The most relevant seem to be: •
Diagnosing activity for supporting resource allocation, monitoring project progress and evaluating project profitability [Kerssen-van Drongelen and Bilderbeek, 1999; Pearson et al., 2000; Loch et al., 1996; Bremser and Barsky, 2004];
•
Motivating personnel [Kim and Oh, 2002; Kerssen van-Drongelen and Cook, 1997];
•
Enhancing communication and coordination [Driva et al., 2000; Loch and Tapper, 2002; Szakonyi, 1995; Bremser and Barsky, 2004];
•
Learning [Driva et al., 2000; Loch and Tapper, 2002];
•
Reducing R&D risks and uncertainty [Chiesa and Masella, 1996; Kerssen-van Drongelen and Cook, 1997];
•
Improving R&D performance [Cordero, 1990; Szakonyi, 1995].
Moreover, literature suggests that these objectives can be classified into two major categories [Azzone 2006; Chiesa et al., 2007; Kerssens-van Drongelen, Cook 1997, Simons, 1994]: (i) hard objectives (have to ensure tight control through measurability, precision and timeliness);(ii) soft objectives,(have to enhance communication, information sharing and creativity). These two macro-categories of objectives lead to different choices in terms of dimensions of performance monitored by the PMS, structure of the PMS itself and process aspects. This clearly emerged in several preliminary cases that we conducted at the outset of our project [see Chiesa et al., 2007]. Once measurement objectives have been defined, it is necessary to clearly specify which control objects are included in the structure of the PMS, i.e. the specific parts (e.g. units, subunits, projects) of the firm’s R&D activities and organisation whose performance are to be monitored. In R&D context, the relevant control objects identified by the literature are [Ojanen and Vuola, 2006; Kerssens-van Drongelen and Bilderbeek, 1999; Godener and Soderquist, 2004]: •
The R&D function as a whole;
•
The research and the development functions separately;
•
The functional units, i.e. the units responsible for R&D activities in a specific field of study or technological discipline;
4
V. Chiesa, F. Frattini, V. Lazzarotti, R. Manzini, I. Troja, An exploratory study on R&D performance measurement…
•
The business units’ specific R&D units;
•
The project teams;
•
Individuals.
Obviously, these levels are not mutually exclusive; generally a PMS has a complex structure that comprises a set of interrelated control objects. Selecting proper dimensions of performance and operative indicators to be used in a PMS for R&D units is a challenging task because of the high level of uncertainty, the relevance of intangible factors, the complexity and the low standardisation of R&D activities. However, literature has deeply investigated the problem and gives us several suggestions. We focus on the main taxonomies of performance dimensions that have been advanced in the available literature. A first stream of research, particularly focused on the characteristics of R&D activities, suggests that a PMS for R&D units should comprise the following types of performance dimensions [Werner and Souder 1997; Brown and Svenson, 1988; Chiesa et al., 1996; Schumann et al., 1995; Sanchez and Perez, 2002]: •
Input: this means using the quantity and quality of the inputs dedicated to the operation of the control object as a proxy of its performance. Examples of input dimensions are the quantity and quality of current expenses, investments, human resources, technologies;
•
Process: this means analysing the processes the control object is involved in, and perhaps responsible for, in terms of effectiveness and efficiency. Examples of typical processes that R&D control objects can be involved in are: concept generation, project selection, technology acquisition;
•
Output: this means monitoring the R&D control object in terms of the actual results that it achieved, e.g. patents, scientific publications, completed projects, new products developed.
A completely different perspective is advanced by those authors who believe that the Balanced Scorecard approach could be effectively adopted in R&D units [Bremser and Barsky, 2004; Sandstrom and Toivanen, 2002; Kerssens-van Drogelen and Cook, 1997]. As a result, they suggest using the following dimensions of performance: •
Financial perspective;
•
Market orientation;
•
Internal business perspective;
•
Innovation and learning perspective.
This is the same standpoint adopted by Neely et al. (2002), who study how to adapt the Performance Prism method to R&D contexts. As far as the measurement techniques and indicators are concerned, literature has widely claimed the need to use a mix of qualitative and quantitative metrics in R&D, the former best
5
Liuc Papers n. 218, luglio 2008
suited to capture un-measurable aspects, and the latter capable of reducing the subjectivity of the evaluation [Pappas and Remer 1985; Werner and Souder 1997; Driva et al., 2000)]. Furthermore, given that economic-financial indicators are often questionable since it is very difficult to give a monetary evaluation of uncertain and intangible elements [Frattini et al., 2006], they are often integrated by non-financial indicators, whose measurement is usually easier. As far as the measurement process is concerned, a first critical issue is represented by the reference standards against which measured performance should be compared [Burch, 1994; Merchant, 1998; Kerssen van-Drongelen and Cook, 1997; Pawar and Driva, 1999; Nixon, 1998]. Again, defining standards in R&D is a really challenging issue, because of the uniqueness of each R&D project and its degree of uncertainty. In our exploratory cases, only a few companies operating in the aerospace sector were able to compare their development performance with industry benchmarks, whereas using internal past projects’ performance was a relatively more diffused alternative among firms in chemical, cosmetic and pharmaceutical industries [Chiesa and Frattini, 2007]. Another critical process element is the measurement frequency. In this respect, literature underlines that it is not possible to define a single, optimal frequency [Presley and Liles, 2000; Driva et al., 2000; Suomala, 2003; Pawar and Driva, 1999)], but that it should be adapted to the PMS objectives, to each dimension of performance (and/or indicator) and to different control objects. However, some general rules emerge from pieces of empirical research reported in the literature: the measurement of technical performance tends to be linked to project milestones, whilst for other dimensions a regular measurement, typically on an annual or monthly basis, is more common [Cho and Lee, 2000]. Finally, it should be stressed that the internal coherence among all the constitutive elements of the PMS is critical for ensuring its effectiveness and efficiency. This is a claim that has been widely advanced from a theoretical point of view [Azzone, 2006; Simons, 2000]. Nevertheless, literature about performance measurement in R&D units has not systematically investigated, from an empirical standpoint, the relationships among the PMS’s constitutive elements. Exception are the work by Chiesa et al. (2007), who analysed, through an exploratory multiple case study, how the selection of the measurement objectives can affect the design of the PMS’s building blocks and the paper by Kerssen-van Drongelen and Bilderbeek (1999) that we commented above. The research which is reported in this paper is believed to help fill this gap in the extant literature.
2.2. The role of contextual factors Performance measurement research has clearly demonstrated that a close relationship exists between the PMS and the context in which performance measurement occurs.
6
V. Chiesa, F. Frattini, V. Lazzarotti, R. Manzini, I. Troja, An exploratory study on R&D performance measurement…
It is possible to summarize as follows the most relevant contextual factors that should be taken into account in the design and implementation of a PMS for R&D activities, according to the available literature: •
The company’s R&D strategy [Griffin and Page, 1996; Loch and Tapper, 2002];
•
The type of R&D organisation [Kerssen-van Drongelen and Bilderbeek, 1999];
•
The type of activities carried out (basic research and/or applied research and/or development) and the associate level of risk [Pappas and Remer, 1985];
•
The resources available for the design, implementation and use of the PMS, in terms of time, money, people technology and know-how [Emmanuel et al., 1990; Godener and Soderquist, 2004];
•
The company’s sector of activity [Loch et al., 1996; Davila, 2000].
Table 1 summarises the most relevant relationships between the PMS’s constitutive elements and contextual factors that are identified by the above mentioned literature contributions, and that we identified in our preliminary exploratory case studies [see, e.g., Frattini et al., 2006; Chiesa et al., 2007; Chiesa and Frattini, 2007]. PMS elements
Objectives
Dimensions of performance
*
*
Structure
Process
* * *
* * * * *
Contextual factors R&D strategy R&D organisation Type of activity Resources available Sector of activity
* * *
* * *
Table 1: The relationships between contextual factors and PMS’s elements
The theoretical development we have summarised in this Section and the exploratory cases that have been mentioned, allowed us to advance the reference framework which is reported in Figure 1.
Figure 1: The reference framework and the focus of the survey
7
Liuc Papers n. 218, luglio 2008
The model identifies the elements that comprise a Performance Measurement System (PMS) for R&D activities, as well as the contextual factors that influence their design. It enlightens the relationships among the PMS’s constitutive elements and between constitutive elements and contextual factors. The empirical research that is reported in this paper focuses anyhow on a limited part of this broad framework, as indicated in Figure 1. In particular, we are interested here in: •
understanding why and how Italian R&D-intensive firms measure the performance of their R&D units, i.e. how they design the constitutive elements of the PMS for R&D and which are the relationships that link these elements;
•
investigating whether a relationship exists between the characteristics of the PMS for R&D designed and implemented by Italian R&D-intensive firms and the nature of the activities they undertake, being them Research or Development. The relationships between the PMS constitutive elements and the other contextual elements will be the subject of future research.
3. Research questions and methodology In this Section we describe the fundamental research questions we wanted to answer through our empirical research, we operationalize the critical research concepts and provide methodological details about our analysis. As already mentioned, we designed and undertook a survey study, which appears to be the most adequate research methodology in light of the purpose of the paper.
3.1. Research questions Consistently with the objectives of the paper and the theoretical framework developed in the previous Section, the survey research was designed to answer to the following questions: •
Research Question 1: Which is the degree of diffusion of Performance Measurement Systems (PMSs) in the R&D units of Italian R&D-intensive companies?;
•
Research Question 2: Which are the characteristics of the PMSs designed and practically used by Italian R&D-intensive companies in their R&D units? In particular: o
Which are the objectives for which measurement is undertaken?;
o
Which are the dimensions of performance monitored and the types of indicators used?;
o
8
Which is the structure of the measurement system?;
V. Chiesa, F. Frattini, V. Lazzarotti, R. Manzini, I. Troja, An exploratory study on R&D performance measurement…
o
Which are the characteristics of the performance measurement process, both in terms of reference standards and measurement frequency?
•
Research Question 3: Which are the relationships among the constitutive elements of the performance measurement systems designed and practically used by Italian R&Dintensive companies? In particular, we focus in this paper on the relationships between: a) Performance dimensions and all the other PMS elements, in order to understand whether a specific dimension of performance (e.g., innovation capability) is monitored with a specific typology of indicators, at a specific organisational level, against a specific type of reference standard and with a definite frequency; b) PMS objectives and all the other PMS elements, in order to understand whether a specific measurement objective (e.g., motivating personnel) influences the design of the associated performance dimensions, control objects, type of indicators, reference standards and measurement frequency;
•
Research Question 4: Which is the relationship between the PMS and the nature of the activities undertaken in the R&D unit, namely Research and Development?. In particular, we focus here on the relationship between the objectives for which measurement is undertaken and the characteristics of the measured activities.
3.2. Operationalisation of the critical research concepts The literature contributions that we reported in Section 2 show that each of the PMS’s constitutive elements can be operationalized in a number of different ways. For instance, it is possible to cluster dimensions of performance into input, output or process measures, or to take into account the taxonomy suggested by the Balanced Scorecard approach. It is necessary, therefore, to plainly state how we operationalized the critical elements of the PMS in our empirical analysis: •
The PMS objectives were distinguished into: 1. motivate researchers and engineers (Obj1); 2. monitor the progress of the activities (Obj2); 3. evaluate the profitability of projects (Obj3); 4. select projects and investment areas (Obj4); 5. improve R&D performance (Obj5); 6. coordinate and communicate (Obj6); 7. reduce uncertainty (Obj7); 8. favor learning (Obj8).
9
Liuc Papers n. 218, luglio 2008
•
The dimensions of performance were classified, according to the Balanced Scorecard 1
approach , into: 1. financial perspective (P1); 2. customer perspective (P2); 3. efficiency of internal business processes (P3); 4. innovation capability (P4). •
As far as the type of indicators are concerned, we distinguished into: quantitative indicators and qualitative ones
•
As far as the measurement process is concerned, measurement frequencies were distinguished into: (i) periodical regular measurement; (ii) measurement by milestones. The reference standards were classified into: (i) internal reference standards, i.e. defined on the basis of the firm’s past R&D performance or selected ad hoc for the specific indicator; (ii) external reference standards;
•
2
Three possible control objects , which define the PMS structure, were identified: (i) the R&D unit as a whole; (ii) the R&D project; (iii) individuals.
Consistently with the research questions we wanted to answer, we designed the survey 3
questionnaire which is reported in Appendix 1 and served as data collection tool .
3.3. Sample and data collection The purpose of our research is to study the R&D performance measurement practices adopted by Italian R&D-intensive firms, which are defined as those companies that heavily invest in and are strongly committed to R&D activities (Deeds, 2001). As a population frame for our survey, we used the list of the companies that are members of the A.I.R.I. (Italian Association for Industrial Research). We eliminated from the list (which initially comprised about 170 members) those organisations that are publicly held, and we obtained a panel of 130 companies. After a preliminary telephone contact, we sent to the R&D directors of these companies the questionnaire by mail, together with a letter describing the research project and providing a set of detailed instructions for filling in the questionnaire. We asked each R&D director to specify the type of activity (“Basic and Applied Research” or “New Product Development”) undertaken in the unit he or she was responsible for (therefore, “type of activity” represented our unit of analysis). A total of 48 companies returned a properly filled in questionnaire, which resulted in 4
61 usable cases: 27 for Research and 34 for Development, giving a response rate of about 32% . After questionnaires were returned, in order to better interpret some ambiguous answers and to
10
V. Chiesa, F. Frattini, V. Lazzarotti, R. Manzini, I. Troja, An exploratory study on R&D performance measurement…
ensure alternate-form reliability, we recalled about 20 firms by phone. The stability of the answers given by the whole set of respondents who were recalled in the follow up interviews indicates a good understanding of the questionnaire’s items, which ensures high levels of reliability [Fink, 1995, Morgan et al., 2001] 5
6
Table 2 reports the distribution of the type of activity, size and industry for the sampled firms. A test for non-response bias was executed using chi-square statistics, which revealed no 7
significant differences between respondents and non-respondents . Sample
Respondents
Non-respondents
Research
47%
44%
49%
Development
53%
56%
51%
Small
20%
13%
24%
Medium
17%
28%
11%
Large
63%
59%
65%
Dominant design
30%
25%
32%
High-tech
46%
42%
48%
Science-based
24%
33%
19%
Type of activity
Size
Industry
Table 2: Profile of the sample and the respondents
3.4. Measures The main measures and procedures for data analysis that we applied are briefly described in the following paragraphs (see Appendix 1 for further details about the questionnaire and Appendix 2 for the values attributed to the questionnaire items). We attempted to ensure content validity by submitting the first version of our questionnaire to a combined pool of university and industry experts belonging to the “R&D Club”. The experts’ comments basically concerned the definition and description of the measurement objectives as well as questions’ formulation and they were incorporated in the final version of the questionnaire.
3.4.1. PMS objectives Eight objectives were defined according to the adopted conceptual framework and their relevance was measured with a 5-point scale, ranging from 1 meaning no relevance and 5 very high relevance.
11
Liuc Papers n. 218, luglio 2008
3.4.2. PMS dimensions of performance, structure and process Four performance dimensions were defined according to our framework. Their relevance was measured with a 5-point scale, with 1 meaning no relevance and 5 very high relevance. As far as the other PMS’s elements (i.e. control objects, measurement frequency, typology of indicators and standards) are concerned, firms’ choices were studied subordinately to each monitored performance dimension through a series of nominal variables (dichotomous or multicategories variables).
3.4.3. Contextual factor As far as the type of R&D activity is concerned, we applied the traditional distinction between Research and (Experimental) Development [OECD, 2002].
3.5. Methodological concerns It should be noted that all the independent variables in our study are modelled as “attributes” of the participants but are not “active” variables, i.e. assigned to the participants themselves. As a result, we are not able to comment on the direction of the relationships among measurement objectives, performance dimensions and contextual factors that we unearthed. In addition, the non-random nature of our sample made it impossible to apply nonparametric tests that could have been useful to verify the statistical significance of some frequencies, which we were able to interpret only in a descriptive way (see data reported in Tables 4-6b). The low frequency of many cells in the cross-tabs of Chi-square tests, moreover, often made the emerging differences between systems characterized by different objectives (i.e. evaluating profitability of projects versus motivating personnel) non-significant. Anyway, the cross-tabs’ analysis allowed us to draw up Tables 7 and 8, which represent the configuration that the PMS assumed among those respondents that assigned a high relevance to the above mentioned measurement objectives.
4. Results and discussion In this Section, we report and discuss the results of the analyses that we undertook in order to answer to each of the paper’s research questions. Due to the nominal and ordinal nature of most of the variables included in the questionnaire, median and mode were the most appropriate measures of central tendency. Spearman correlations and non-parametric statistics were adopted to test the hypothesized relationships.
12
V. Chiesa, F. Frattini, V. Lazzarotti, R. Manzini, I. Troja, An exploratory study on R&D performance measurement…
4.1. Research question 1 Our analysis shows that 98% of the R&D-intensive firms that responded to our questionnaire are concerned about the problem of measuring R&D performance. Although literature widely acknowledges the difficulties that practically measuring R&D performance entails, and despite the lack of external accounting requirements to disclose R&D information, our results show that R&D-intensive firms are very interested in this managerial problem and that they have been measuring their R&D performance through formalised PMSs for a number of years, often for more than a decade.
4.2. Research question 2 Table 3 displays the descriptive statistics about the measurement objectives and their achievement, together with the descriptive statistics for performance dimensions. Data indicate that half of the objectives are relevant or very relevant for the R&D-intensive firms in our sample (see mode values >= 4). This suggests that R&D-intensive firms measure the performance of their R&D with the aim to concurrently pursue several objectives. It should also be noted that the most relevant objectives (median = 5) are typically “hard”: “monitor the progress of activities” and “evaluate profitability of projects”. This indicates that the need for control is high even in R&D activities, that have been traditionally conceived as difficult to monitor and manage [McNair and Leibfried, 1992]. Although R&D performance measurement is essentially multi-objective, “hard” objectives appear to be more relevant and easier to achieve for R&D-intensive firms than “motivational” or “soft” ones. As far as the dimensions of performance are concerned, R&D-intensive firms generally combine multiple perspectives when it comes to measure the performance of their R&D. As Table 3 (see Appendix 3) indicates, all the perspectives suggested by the BSC approach are acknowledged to be as highly relevant (see the mode values). Tables 4 and 5 summarise the most important results concerning the characteristics of the PMSs adopted by the R&D-intensive firms in our sample, in terms of performance dimensions, indicators, structure, reference standards and measurement frequency. The following insights are noteworthy: •
The most widely adopted control object is undoubtedly the project. Quantitative or qualitative indicators are not predominant in our analysis; this was predictable at this stage of the analysis were we consider contemporarily all the measured performance dimensions (see Section 4.3 for the design choices emerging for each specific performance dimension);
13
Liuc Papers n. 218, luglio 2008
•
It emerges that the performance dimensions associated to each control object are measured prevalently with a regular frequency and not in correspondence to critical project milestones. This might suggest that the use of formal stage-gate approaches for managing R&D activities, which require a set of pre-defined evaluations of a project state of advancement, is less widespread in our sample than what literature suggests [e.g., Griffin, 1997], or that performance measurement is believed to be a completely distinct practice from the stage-gate evaluations. Moreover, our results show that higher frequencies (i.e. monthly) are quite diffused only at the project level. This might suggest that firms believe the project to be the organisational object that requires tighter control than individuals or R&D unit as a whole;
•
As it was largely predictable, the prevalent reference standards are internal; this confirms the difficulty in finding information about competitors’ R&D performance and the lacking of industry benchmarks.
Prevalent indicators*
Prevalent Control Objects*
Prevalent frequency**
Qualitative/Quantitative
Project
Regular
Prevalent regular frequency** Annual
Standards* Internal
Table 4: Prevalent indicators, structure, frequency and standards (n=61). * Values calculated considering all the performance dimensions. ** Values calculated considering all the performance dimensions and all the control objects. Multiple responses were allowed.
Control object
Prevalent frequency*
R&D Unit Project Individual
Regular Regular Regular
Prevalent regular frequency* Annual Monthly Annual
Table 5: Prevalent frequency for each control object (n=61). * Values calculated considering all the performance dimensions. Multiple responses were allowed.
4.3. Research question 3a Table 6a and 6b summarize the most relevant results of our survey concerning the relationships between dimensions, indicators, control objects, frequency and standards, independently from the pursued measurement objective. Specifically, Table 6a describes the choices in terms of control objects, type of indicators and reference standards for each of the controlled performance dimension; Table 6b gives instead an overview of the measurement frequency adopted by the firms in our sample for each performance dimension and each prevalent control object as identified in Table 6a.
14
V. Chiesa, F. Frattini, V. Lazzarotti, R. Manzini, I. Troja, An exploratory study on R&D performance measurement…
Some interesting insights emerge from the two Tables, even if they are obviously subject to limitations in terms of statistical significance and hence generalisability (see Section 3.5): •
The financial and market orientation perspectives are measured chiefly at the project level; on the contrary, firms assess their innovation capability mainly at the R&D unit and, interestingly, at the individual level. These results are quite obvious if we consider that financial evaluation techniques (e.g., Discounted Cash Flow approaches or real option analyses) can be properly applied only to R&D projects but not to the R&D unit as a whole, nor to the single researcher or engineer. Similarly, market orientation is a dimension of performance that can be difficultly assessed in respect to individuals or organisational units.
Performance dimension Financial perspective Market orientation Efficiency of R&D processes Innovation capability
Control object Project Project Project Individual/Unit
Typology of indicator Quantitative Qualitative Both Qualitative
Typology of standard Internal Internal/External Internal Internal/External
Table 6a: Relationships between control objects, indicators and standards for each performance dimension (n=61). Multiple responses were allowed.
•
Quantitative indicators are clearly prevalent when it comes to measure the financial dimension of R&D activities, both qualitative and quantitative metrics are applied for assessing R&D efficiency, whereas qualitative ones are the most diffused with market orientation and innovation capability.
•
As far as reference standards are concerned, internal ones are clearly prevalent for the financial and efficiency dimensions; although they are the most diffused also when a firm measures its R&D’s innovation capability and market orientation, it is possible to note a wider use of external standards in these latter cases. In other words, respondents acknowledge that continuous and closer comparison with competitors is more critical in these instances.
•
Finally, the adopted measurement frequency appears to be predominantly regular (see Table 6b); anyway, higher frequencies (specifically, monthly) are prevalent when a firms measures its R&D’s financial and efficiency performance, at a project level. This finding suggests, deepening the information reported in Table 4, that firms tend to measure more closely the performance of their R&D projects along those dimensions that are more
15
Liuc Papers n. 218, luglio 2008
easily quantifiable and that allow to apply structured and easily replicable evaluation methodologies.
Performance Financial perspective Market orientation Efficiency Innovation capability
Prevalent control object Project Project Project Individual
Prevalent frequency Regular Regular Regular Regular
Prevalent regular frequency Monthly Annual Monthly Annual
Table 6b: Frequency for each performance dimension/prevalent control object (as identified in Table 6a). Multiple responses were allowed.
4.4. Research questions 3b and 4 As already brought into evidence, the survey results suggest that R&D-intensive companies’ PMSs are multi-objective (see Table 3 in Appendix 3); in other words, it emerges that these firms aim to achieve several different purposes by means of their R&D PMSs. This is to some extent in contrast with the available literature suggesting that hard and soft objectives correspond to significantly different choices in terms of monitored performance dimensions, structure of the PMS and measurement process aspects [Chiesa et al., 2007; Azzone 2006; Kerssens-van Drongelen, Cook 1997, Simons, 1994, 2000]. In order to investigate this aspect more in detail, we undertook four types of analysis on our survey data: a) An analysis of the correlations among different objectives, in order to verify whether some negative and/or positive relationships exist among them and, hence, whether some clusters/models of objectives can be identified (e.g., the soft and the hard clusters); b) An analysis of the correlations among objectives and monitored performance dimensions, in order to verify whether specific objectives are linked (positively or negatively) to the dimensions of performance that are monitored; c) An analysis of the relationships among the objectives and the type of activity (Research or Development), in order to verify whether certain objectives are pursued more intensively in a Research context rather than in a Development one, and vice versa. d) An analysis of the elements (control objects, frequency, type of indicators and standards) that characterize the identified models; As far as the first analysis is concerned, the following significant correlations reported in table 3 indicate that it is possible to distinguish two classes of objectives, i.e. “motivational” and “hard/diagnostic”: •
the positive and significant relationship between “motivate researchers and engineers” and “improve R&D performance” (0.26, p≤0.05);
16
V. Chiesa, F. Frattini, V. Lazzarotti, R. Manzini, I. Troja, An exploratory study on R&D performance measurement…
•
the positive and significant relationships among “evaluate the profitability of projects”, “select projects and investment areas”, “monitor the progress of the activities” (0.4, p≤0.001; 0.24, p≤ 0.1);
Moreover, the negative and significant correlations between “motivate researchers and engineers” and each of the “hard” objectives (-0.21, p≤0.1; -0.30, p≤0.05; -0.32, p≤0.05), indicate that they are somehow mutually exclusive. In other words, when R&D-intensive companies try to pursue with a strong emphasis typically “hard” objectives, they generally attach a lower relevance to “motivational” ones. This can be explained considering that different objectives for performance measurement entail dissimilar measurement approaches as evidenced by the above mentioned literature. In order to understand more deeply this contrast, we analysed the results of our second analysis, which demonstrates that different objectives lead to dissimilar choices in terms of relevance of the various performance dimensions. Taking into account the correlations between measurement objectives and performance dimensions reported in Table 3, it emerges that “innovation capability” is strongly associated with “motivational” purposes (specifically, the strongest correlation is with the objective “motivate researchers” coefficient equals 0.41, p≤0.001; a significant correlation also exists with the objective “improve R&D performance” - coefficient equals 0.30, p≤0.05). The “motivational” objective named “improve R&D performance” is positively correlated also with the “efficiency” measurement perspective (0.28, p≤0.05). In other words, it emerges that the performance of researchers and engineers is measured considering: (i) their capability to provide valuable ideas for new products or for the improvement of existing products and processes, and (ii) the efficiency with which they perform specific tasks or accomplish specific goals, e.g. the acquisition or development of new competencies. The primary need to motivate engineers and researchers brings thus R&D-intensive firms to define their accountability on the basis of those factors that deal with the influential aspects of their work and that they can completely control. This position is consistent with the theories of action, design and expectation [e.g., McClellan et al., 1953; Pritchard, 1990; Moizer, 1991] which hold a relevant position in performance management literature. On the other hand, positive and significant coefficients (0.37, p≤0.01; 0.32, p≤0.05) link the “financial” and “customer” dimensions with the “hard” objective “evaluate the profitability of project”. The “hard” objective named “monitor the progress of activities” is positively correlated also with the “efficiency” measurement perspective (0.30, p≤0.05); nevertheless, this performance dimension is probably employed in a different way than in the case it is used to 8
“improve R&D performance” . Taking into account the other “hard” objectives, only the relationship between “customer” perspective and “select projects and investment areas” shows a
17
Liuc Papers n. 218, luglio 2008
positive and sufficiently significant coefficient (0.24, p≤0.1). In sum, in a hard model conception, respondents assess the revenue and costs associated to R&D activities, the capacity to identify and timely incorporate into new products and processes the needs of the market, and the levels of resource consumption that they entail. In this case, in fact, the need to objectively evaluate the profitability of R&D projects, select the most profitable ones and monitor their progress, becomes of foremost importance, whereas the motivational role of performance measurement is rather neglected. Therefore, financial and quantitative indicators [Werner and Souder, 1997] and measures for key success factors such as customer satisfaction [Loch and Tapper, 2002] are introduced, although they are not completely controllable by researchers and engineers and hence are likely to have a limited motivational impact. Contrasting characteristics between the motivational model and the hard one are evidenced by the negative and significant correlation between the “financial” perspective and the objective “motivate researchers and engineers” (-0.23, p≤0.1). However, this is not true for all the couples of mutually exclusive objectives: e.g., “motivate researchers” and “select project and investment areas” are negatively and significantly correlated, but they are both positively associated with the “innovation capability” perspective. As far as the type of activity is concerned, the Mann-Whitney U test was used to search for statistically relevant differences between the measurement objectives pursued in Research and Development units. Values of Z (Z=-2.82, p≤0.01) indicate a positive association between Research and the objective “motivate researchers”, suggesting that in Research units motivational objectives are pursued more intensively than in Development ones. On the contrary, the “hard” objective “evaluate profitability of projects”, is pursued more intensively in Development than in Research units (Z=-2.031, p≤0.05). No other statistically relevant differences in measurement objectives emerged. Similar results add some further suggestions about the contrast between the motivational and hard objectives. It can be explained considering that Basic and applied research is characterised by lower pressures on tangible results and deadlines than Development, by an organisational environment that favours individual work rather than teamwork, and by results that are far more distant in time. These features make it far more difficult to build and maintain a strong commitment towards the company’s strategic objectives and performance measurement turns out to be a critical tool in achieving such an alignment. Moreover, pursuing hard objectives in research would be extremely difficult because of the unpredictable nature of this activity. Moreover, the scale of investments in NPD activities is much greater than in research [Cooper and Kleinschmidt, 1988], which makes the need to evaluate projects’ profitability particularly compelling in development settings. Similarly, moving from research to development (and hence getting closer to market), the need to strictly
18
V. Chiesa, F. Frattini, V. Lazzarotti, R. Manzini, I. Troja, An exploratory study on R&D performance measurement…
monitor the performance which are critical for competition (time, costs and customer satisfaction) grows in importance.
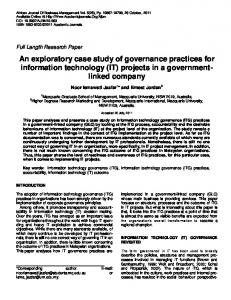
4.5. Emerging archetypes for PMSs in R&D units Figures 2 summarises the objectives, performance dimensions and measurement context for 9
the “hard” and “motivational” models for R&D performance measurement that emerged from the empirical analyses. R&D-intensive firms employing the so-called “hard” model pursue three major objectives (i.e. to evaluate profitability of projects, monitor the progress of activities, select project and investment areas), through a measurement system that chiefly employs the financial, customer and efficiency perspectives. This model seems to be prevalent in Development units. Companies adopting the “motivational” model aims chiefly to motivate researchers and improve R&D performance, through a measurement system that monitors innovation capability and efficiency performance dimensions, but avoid making use of the financial perspective. This archetype is relatively more diffused in Research units. SOFT MODEL Favour learning Coordination and communication Reduce uncertainty
Innovation capability
Development activities HARD MODEL Evaluate profitability Monitor progress of activities
Financial perspective
Efficiency of R&D processes Select projects
Research activities MOTIVATIONAL MODEL Motivate researchers
Improve R&D performance
Customer perspective Legenda:
Performance dimensions
= Positive significant correlations
= Negative significant correlations Objectives MODELS OF R&D PERFORMANCE MEASUREMENT
Figure 2: Objectives, performance dimensions and context for R&D performance measurement
19
Liuc Papers n. 218, luglio 2008
As concerns the last analysis about the remaining PMS elements, we selected “motivational” 10
and “hard” cases by applying the following conditions that summarise the characteristics of the two models reported in Figure 2: •
Motivational: Obj1 (motivate researchers and engineers) ≥4 and Ob3 (evaluate the profitability of projects)