demonstrate the application of this framework to the task of performance ... An Extensible Monitoring Framework for Measuring and Evaluating Tool. 223. 3.
An Extensible Monitoring Framework for Measuring and Evaluating Tool Performance in a Service-oriented Architecture Christoph Becker, Hannes Kulovits, Michael Kraxner, Riccardo Gottardi, and Andreas Rauber Vienna University of Technology, Vienna, Austria http://www.ifs.tuwien.ac.at/dp Abstract. The lack of QoS attributes and their values is still one of the fundamental drawbacks of web service technology. Most approaches for modelling and monitoring QoS and web service performance focus either on client-side measurement and feedback of QoS attributes, or on ranking and discovery, developing extensions of the standard web service discovery models. However, in many cases, provider-side measurement can be of great additional value to aid the evaluation and selection of services and underlying implementations. We present a generic architecture and reference implementation for non-invasive provider-side instrumentation of data-processing tools exposed as QoS-aware web services, where real-time quality information is obtained through an extensible monitoring framework. In this architecture, dynamically configurable execution engines measure QoS attributes and instrument the corresponding web services on the provider side. We demonstrate the application of this framework to the task of performance monitoring of a variety of applications on different platforms, thus enriching the services with real-time QoS information, which is accumulated in an experience base.
1
Introduction
Service-oriented computing as means of arranging autonomous application components into loosely coupled networked services has become one of the primary computing paradigms of our decade. Web services as the leading technology in this field are widely used in increasingly distributed systems. Their flexibility and agility enable the integration of heteregoneous systems across platforms through interoperable standards. However, the thus-created networks of dependencies also exhibit challenging problems of interdependency management. Some of the issues arising are service discovery and selection, the question of service quality and trustworthiness of service providers, and the problem of measuring qualityof-service (QoS) attributes and using them as means for guiding the selection of the optimal service for consumption at a given time and situation. Measuring quality attributes of web services is inherently difficult due to the very virtues of service-oriented architectures: The late binding and flexible integration ideals ask for very loose coupling, which often implies that little is M. Gaedke, M. Grossniklaus, and O. D´ıaz (Eds.): ICWE 2009, LNCS 5648, pp. 221–235, 2009. c Springer-Verlag Berlin Heidelberg 2009 �
222
C. Becker et al.
known about the actual quality of services and even less about the confidence that can be put into published service metadata, particularly QoS information. Ongoing monitoring of these quality attributes is a key enabler of service-level agreements and a prerequisite for building confidence and trust in services. Different aspects of performance measurement and benchmarking of web services have been analysed. However, most approaches do not provide concrete ways of measuring performance of services in a specific architecture. Detailed performance measurement of web services is particularly important for obtaining quality attributes that can be used for service selection and composition, and for discovering bottlenecks to enable optimization of composite service processes. The total, round-trip-time performance of a web service is composed by a number of factors such as network latency and web service protocol layers. Measuring only the round-trip performance gives rather coarse-grained measurements and does not provide hints on optimization options. On the other hand, network latencies are hard to quantify, and the run-time execution characteristics of the software that is exposed as a service are an important component of the overall performance. Similar to web service quality criteria and service selection, these run-time execution characteristics of a software tool are also an important criterion for the general scenario of Commercial-off-the-Shelf (COTS) component selection. Our motivating application scenario are the component selection procedures in digital preservation planning. In this domain, a decision has to be taken as to which tools and services to include for accomplishing the task of keeping specific digital objects alive for future access, either by converting them to different representations or by rendering them in compatible environments, or by a combination of both. The often-involved institutional responsibility for the curation of digital content implies that a carefully designed selection procedure is necessary that enables transparent and trustworthy decision making. We have been working on a COTS selection methodology relying on empirical evaluation in a controlled experimentation setting [2]. The corresponding distributed architecture, which supports and automates the selection process, relies on web services exposing the key components to be selected, which are discovered in corresponding registries [1]. This COTS selection scenario shows many similarities to the general web service selection problem, but the service instances that are measured are used mainly for experimentation; once a decision is taken to use a specific tool, based on the experimental evaluation through the web service, it might be even possible to transfer either the data to the code or vice versa, to achieve optimum performance for truly large-scale operations on millions of objects. The implications are that 1. Monitoring the round-trip time of service consumption at the client does not yield sufficient details of the runtime characteristics; 2. Provider-side runtime characteristics such as the memory load produced by executing a specific function on the server are of high interest;
An Extensible Monitoring Framework for Measuring and Evaluating Tool
223
3. Client-side monitoring is less valuable as some of the main parameters determining it, such as the network connection to the service, are negotiatable and up to configuration and production deployment. While client-side measurement is certainly a valuable tool and necessary to take into account the complete aspects of web service execution, it is not able to get down to the details and potential bottlenecks that might be negotiable or changeable, and thus benefits greatly from additional server-side instrumentation. Moreover, for large-scale library systems containing millions of objects that require treatment, measuring the performance of tools in detail can be crucial. In this paper, we present a generic and extensible architecture and framework for non-invasive provider-side service instrumentation that enables the automated monitoring of different categories of applications exposed as web services and provides integrated QoS information. We present a reference implementation for measuring the performance of data processing tools and instrumenting the corresponding web services on the provider side. We further demonstrate the performance monitoring of a variety of applications ranging from native C++ applications and Linux-based systems to Java applications and client-server tools, and discuss the results from our experiments. The rest of this paper is structured as follows. The next section outlines related work in the areas of web service QoS modelling, performance measurement, and distributed digital preservation services. Section 3 describes the overall architectural design and the monitoring engines, while Section 4 analyses the results of practical applications of the implemented framework. Section 5 discusses implications and sets further directions.
2
Related Work
The initially rather slow takeup of web service technology has been repeatedly attributed to the difficulties in evaluating the quality of services and the corresponding lack of confidence in the fulfillment of nun-functional requirements. The lack of QoS attributes and their values is still one of the fundamental drawbacks of web service technology [21,20]. Web service selection and composition heavily relies on QoS computation [18,6]. A considerable amount of work has been dedicated towards modelling QoS attributes and web service performance, and to ranking and selection algorithms. A second group of work is covering infrastructures for achieving trustworthiness, usually by extending existing description models for web services and introducing certification roles to the web service discovery models. Tian describes a QoS schema for web services and a corresponding implementation of a description and selection infrastructure. In this framework, clients specify their QoS requirements to a broker, who tests them agains descriptions published by service providers and interacts with a UDDI registry [25]. Industry-wise, IBM’s Web Service Level Agreement (WSLA) framework targets defining and monitoring SLAs [14]. Liu presents a ranking algorithm for QoS-attribute based service selection [16]. The authors describe the three general criteria of execution duration (round-trip
224
C. Becker et al.
time), execution price, and reputation, and allow for domain-specific QoS criteria. Service quality information is collected through accumulating feedback of the requesters who deposit their QoS experience. Ran proposes a service discovery model including QoS as constraints for service selection, relying on third-party QoS certification [21]. Maximilien proposes an ontology for modelling QoS and an architecture where agents stand between providers and consumers and aggregate QoS experience on behalf of the consumers [17]. Erradi presents a middleware solution for monitoring composite web service performance and other quality criteria at the message level [7]. Most of these approaches assume that QoS information is known and can be verified by the third-party certification instance. While this works well for static quality attributes, variable and dynamically changing attributes are hard to compute and subject to change. Platzer discusses four principal strategies for the continuous monitoring of web service quality [20]: provider-side instrumentation, SOAP intermediaries, probing, and sniffing. They further separate performance into eight components such as network latency, processing and wrapping time on the server, and round-trip time. While they state the need for measuring all of these components, they focus on round-trip time and present a providerindependent bootstrapping framework for measuring performance-related QoS on the client-side [22,20]. Wickramage et. al. analyse the factors that contribute to the total round trip time (RTT) of a web service request and arrive at 15 components that should ideally be measured separately to optimize bottlenecks. They focus on web service frameworks and propose a benchmark for this layer [26]. Her et. al. discuss metrics for modelling web service performance [11]. Head presents a benchmark for SOAP communication in grid web services [10]. Large-scale clientside performance measurement tests of a distributed learning environment are described in [23], while Song presents a dedicated tool for client-side performance testing of specific web services [24]. There is a large body of work on quality attributes in the COTS component selection domain [5,4]. Franch describes hierachical quality models for COTS selection based on the ISO/IEC 9126 quality model [13] in [9]. Different categories of criteria need to be measured to automate the COTS selection procedure in digital preservation [2]. – The quality of results of preservation action components is a highly complex domain-specific quality aspect. Quantifying the information loss introduced by transforming the representation of digital content constitutes one of the central areas of research in digital preservation [3]. – On a more generic level, the direct and indirect costs are considered. – For large-scale digital repositories, process-related criteria such as operational aspects associated with a specific tool are important. To these criteria pertain also the performance and scalability of a tool, as they can have significant impact on the operational procedures and feasibility of implementing a specific solution in a repository system.
An Extensible Monitoring Framework for Measuring and Evaluating Tool
225
In the preservation planning environment described in [1], planning decisions are taken following a systematic workflow supported by a Web-based application which serves as the frontend to a distributed architecture of preservation services. To support the processes involved in digital preservation, current initiatives are increasingly relying on distributed service oriented architectures to handle the core tasks in a preservation system [12,8,1]. This paper builds on the work described above and takes two specific steps further. We present a generic architecture and reference implementation for noninvasively measuring the performance of data processing tools and instrumenting the corresponding web services on the provider side. We demonstrate the performance monitoring of a variety of applications ranging from native C++ applications on Linux-based systems to Java applications and client-server tools, and discuss results from our experiments.
3 3.1
A Generic Architecture for Performance Monitoring Measuring QoS in Web Services
As described in [20], there are four principle methods of QoS measurement from the technical perspective. – Provider-side instrumentation has the advantage of access to a known implemementation. Dynamic attributes can be computed invasively within the code or non-invasively by a monitoring device. – SOAP Intermediaries are intermediate parties through which the traffic is routed so that they can collect QoS-related criteria. – Probing is a related technique where a service is invoked regularly by an independent party which computes QoS attributes. This roughly corresponds to the certification concept described in the previous section. – Sniffing monitors the traffic on the client side and thus produces consumerspecific data. Different levels of granularity can be defined for performance-related QoS; some authors distinguish up to 15 components [26]. In this work, we focus on measuring the processing time of the actual service execution on the provider-side and describe a non-invasive monitoring framework. In this framework, the invoked service code is transparently wrapped by a flexible combination of dynamically configured monitoring engines that are each able of measuring specific properties of the monitored piece of software. While these properties are not in any way restricted to be performance-related, the work described here primarily focuses on measuring runtime performance and content-specific quality criteria. 3.2
Monitoring Framework
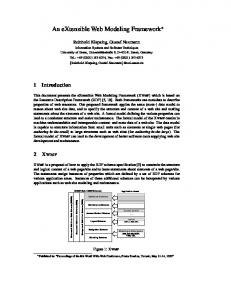
Figure 1 shows a simplified abstraction of the core elements of the monitoring design. A Registry contains a number of Engines, which each specify which
226
C. Becker et al.
Fig. 1. Core elements of the monitoring framework
aspects of a service they are able to measure in their MeasurableProperties. These properties have associated Scales which specify value types and constraints and produce approprate Value objects that are used to capture the Measurements associated with each property. The right most side of the digram shows the core scales and values which form the basis of their class hierarchies. Each Engine is deployed on a specific Environment that exhibits a certain performance. This performance is captured in a benchmark score, where a Benchmark is a specific configuration of services and benchmark Data for a certain domain, aggregating specific measurements over these data to produce a representative score for an environment. The benchmark scores of the engines’ environments are provided to the clients as part of the service execution metadata and can be used to normalise performance data of software across different service providers. A registry further contains Services, which are, for monitoring purposes, not invoked directly, but run inside a monitoring engine. This monitoring execution produces a body of Experience for each service, which is accumulated through each successive call to a service and used to aggregate QoS information over time. It thus enables continuous monitoring of service quality. Bootstrapping these aggregate QoS data happens through the benchmark scoring, which can be configured specifically for each domain. CompositeEngines are a flexible form of aggregating measurements obtained in different monitoring environments. This type of engine dispatches the service execution dynamically to several engines to collect information. This is especially useful in cases where measuring code in real-time actually changes the behaviour of that code. For example, measuring the memory load of Java code in a profiler usually results in a much slower performance, so that simultaneous measurement of memory load and execution speed leads to skewed results. Separating the measurements into different calls leads to correct results. The bottom of the diagram illustrates some of the currently deployed performance monitoring engines. 1. The ElapsedTimeEngine is a simple default implementation measuring elapsed (wall-clock) time.
An Extensible Monitoring Framework for Measuring and Evaluating Tool
227
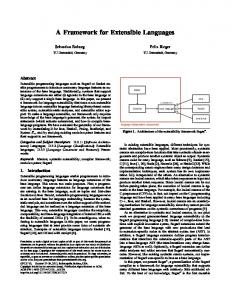
Fig. 2. Exemplary interaction between the core monitoring components
2. The TopEngine is based on the Unix tool top 1 and used for measuring the memory load of wrapped applications installed on the server. 3. The TimeEngine uses the Unix call time 2 to measure the CPU time used by a process. 4. Monitoring the performance of Java tools is accomplished by a combination of the HProfEngine and JIPEngine, which use the HPROF 3 and JIP 4 profiling libraries, for measuring memory usage and timing characteristics, respectively. 5. In contrast to these performance-oriented engines, the XCLEngine, which is currently under development, is measuring a very different QoS aspect. It quantifies the quality of file conversion by measuring the loss of information involved in file format conversion. To accomplish this, it relies on the eXtensible Characterisation Languages (XCL) which provide an abstract information model for digital content which is independent of the underlying file format [3], and compares different XCL documents for degrees of equality. Additional engines and composite engine configurations can be added dynamically at any time. Notice that while the employed engines 1-4 in the current implementation focus on performance measurement, in principle any category of dynamic QoS criteria can be monitored and benchmarked. Figure 2 illustrates an exemplary simplified flow of interactions between service requesters, the registry, the engines, and the monitored tools, in the case of a composite engine measuring the execution of a tool through the Unix tools time and top. The composite engine collects and consolidates the data; both 1 2 3 4
http://unixhelp.ed.ac.uk/CGI/man-cgi?top http://unixhelp.ed.ac.uk/CGI/man-cgi?time http://java.sun.com/developer/technicalArticles/Programming/HPROF.html http://jiprof.sourceforge.net/
228
C. Becker et al.
the engine and the client can contribute to the accumulated experience of the registry. This allows the client to add round-trip information, which can be used to deduct network latencies, or quality measurements computed on the result of the consumed service. 3.3
Performance Measurement
Measuring run-time characteristics of tools on different platforms has always been difficult due to the many peculiarities presented by each tool and environment. The most effective way of obtaining exact data on the behaviour of code is instrumenting it before[19] or after compilation [15]. However, as flexibility and non-intrusiveness are essential requirements in our application context, and access to the source code itself is often not even possible, we use non-invasive monitoring by standard tools for a range of platforms. This provides reliable and repeatable measurements that are exact enough for our purposes, while not necessitating access to the code itself. In particular, we currently use a combination of the following tools for performance monitoring. – Time. The unix tool time is the most commonly used tool for measuring actual processing time of applications, i.e. CPU time consumed by a process and its system calls. However, while the timing is very precise, the major drawback is that memory information is not available on all platforms. Depending on the implementation of the wait3() command, installed memory information is reported zero on many environments5 . – Top. This standard Unix program is primarily aimed at continuos monitoring of system resources. While the timing information obtained is not as exact as the time command, top measures both CPU and memory usage of processes. We gather detailed information on a particular process by starting top in batch mode and continually logging process information of all running processes to a file. After the process to be monitored has finished asynchronously (or timed out), we parse the output for performance information of the monitored process. In principle, the following process information provided by top can be useful in this context. • Maximum and average virtual memory used by a process; • Maximum and average resident memory used; • The used percentage of available physical memory used; and • The cumulative CPU time the process and its dead children have used. Furthermore, the overall CPU state of the system, i.e. the accumulated processing load of the machine, can be useful for detailed performance analysis and outlier detection. As many processes actually start child processes, these have to be monitored as well to obtain correct and relevant information. For example, when using convert from ImageMagick, in some cases the costly work is not directly performed by the 5
http://unixhelp.ed.ac.uk/CGI/man-cgi?time
An Extensible Monitoring Framework for Measuring and Evaluating Tool
229
convert-process but by one of its child processes, such as GhostScript. Therefore we gather all process information and aggregate it. A large number of tools and libraries are available for profiling Java code.6 The following two open-source profilers are currently deployed in our system. – The HProf profiler is the standard Java heap and CPU profiling library. While it is able to obtain almost any level of detailed information wanted, its usage often incurs a heavy performance overhead. This overhead implies that measuring both memory usage and CPU information in one run can produce very misleading timing information. – In contrast to HProf, the Java Interactive Profiler (JIP) incurs a low overhead and is thus used for measuring the timing of Java tools. Depending on the platform of each tool, different measures need to be used; the monitoring framework allows for a flexible and adaptive configuration to accomodate these dynamic factors. Section 4.1 discusses the relation between the monitoring tools and which aspects of performance information we generally use from each of them. Where more than one technique needs to be used for obtaining all of the desired measurements, the composite engine described above transparently forks the actual execution of the tool to be monitored and aggregates the performance measurements.
4
Results and Discussion
We run a series of experiments in the context of a digital preservation scenario comparing a number of file conversion tools for different types of content, all wrapped as web services, on benchmark content. In this setting, candidate services are evaluated in a distributed SOA to select the best-performing tool. The experiments’ purpose is to evaluate different aspects of both the tools and the engines themselves: 1. Comparing performance measurement techniques. To analyse the unavoidable variations in the measurements obtained with different monitoring tools, and to validate the consistency of measurents, we compare the results that different monitoring engines yield when applied to the same tools and data. 2. Image conversion tools. The ultimate purpose of the system in our application context is the comparative evaluation of candidate components. Thus we compare the performance of image file conversion tools on benchmark content. 3. Accumulating average experience on tool behaviour. An essential aspect of our framework is the accumulation of QoS data about each service. We analyse average throughput and memory usage of different tools and how the accumulated averages converge to a stable value. 6
http://java-source.net/open-source/profilers
230
C. Becker et al.
4. Tradeoffs between different quality criteria. Often, a trade-off decision has to be made between different quality criteria, such as compression speed versus compression rate. We run a series of tests with continually varying settings on a sound conversion software and describe the resulting trade-off curves. Table 1 shows the experiment setups and their input file size distribution. Each server has a slightly different, but standard x86 architecture, hardware configuration and several conversion tools installed. Experiment results in this section are given for a Linux machine running Ubuntu Linux 8.04.2 on a 3 GHz Intel Core 2 Duo processor with 3GB memory. Each experiment was repeated on all other applicable servers to verify the consistency of the results obtained. 4.1
Measurement Techniques
The first set of experiments compares the exactness and appropriateness of measurements obtained using different techniques and compares these values to check for consistency of measurements. We monitor a Java conversion tool using all available engines on a Linux machine. Figure 3 shows measured values for a random subset of the total files to visually illustrate the variations between the engines. On the left side, the processing time measured by top, time, and the JIP profiler are generally very consistent across different runs, with an empirical correlation coefficient of 0.997 and 0.979, respectively. Running HProf on the same files consistently produces much longer execution times due to the processing overhead incurred by profiling the memory usage. The right side depicts Table 1. Experiments Experiment Files 1
110 JPEG images
2
110 JPEG images
3
110 JPEG images
4
312 JPEG images
5
312 JPEG images
6
56 WAV files
7
56 WAV files
File sizes Mean: 5,10 MB Median: 5,12 MB Std dev: 2,2 MB Min: 0,28 MB Max: 10,07MB Mean: 5,10 MB Median: 5,12 MB Std dev: 2,2 MB Min: 0,28 MB Max: 10,07MB Mean: 5,10 MB Median: 5,12 MB Std dev: 2,2 MB Min: 0,28 MB Max: 10,07MB Mean: 1,19 MB Median: 1,08 MB Std dev: 0,68 MB Min: 0,18 MB Max: 4,32MB Mean: 1,19 MB Median: 1,08 MB Std dev: 0,68 MB Min: 0,18 MB Max: 4,32MB Mean: 49,6 MB Median: 51,4 MB Std dev: 12,4 MB Min: 30,8 MB Max: 79,8 MB Mean: 49,6 MB Median: 51,4 MB Std dev: 12,4 MB Min: 30,8 MB Max: 79,8 MB
Total input Tool volume 534 MB ImageMagick conversion to PNG
Engines Top, Time
534 MB
Java ImageIO conversion to PNG
HProf, JIP
534 MB
Java ImageIO conversion to PNG
Time, Top
365MB
ImageMagick conversion to PNG
Time, Top
365MB
Java ImageIO conversion to PNG
HProf, JIP
2747MB
FLAC Top, time unverified conversion to FLAC, 9 different quality/speed settings
2747MB
FLAC Top, time verified conversion to FLAC, 9 different quality/speed settings
An Extensible Monitoring Framework for Measuring and Evaluating Tool
(a) Monitoring time
231
(b) Monitoring memory
Fig. 3. Comparison of the measurements obtained by different techniques
different memory measurements for the same experiment. The virtual memory assigned to a Java tool depends mostly on the settings used to execute the JVM and thus is not very meaningful. While the resident memory measured by Top includes the VM and denotes the amount of physical memory actually used during execution, HProf provides figures for memory used and allocated within the VM. Which of these measurements are of interest in a specific component selection scenario depends on the integration pattern. For Java systems, the actual
Fig. 4. Runtime behaviour of two conversion services
232
C. Becker et al.
memory within the machine will be relevant, whereas in other cases, the virtual machine overhead has to be taken into account as well. When a tool is deployed as a service, a standard benchmark score is calculated for the server with the included sample data; furthermore, the monitoring engines report the average system load during service execution. This enables normalisation and comparison of a tool across server instances. 4.2
Tool Performance
Figure 4 shows the processing time of two conversion tools offered by the same service provider on 312 image files. Simple linear regression shows the general trend of the performance relation, revealing that the Java tool is significantly faster. (However, it has to be noted that the conversion quality offered by ImageMagick is certainly higher, and the decision in our component selection scenario depends on a large number of factors. We use an approach based on multi-attribute utility theory for service selection.) 4.3
Accumulated Experience
An important aspect of any QoS management system is the accumulation and dissemination of experience on service quality. The described framework automatically tracks and accumulates all numeric measurements and provides aggregated averages with every service response. Figure 5 shows how processing time and memory usage per MB quickly converge to a stable value during the initial bootstrapping sequence of service calls on benchmark content. 4.4
Trade-off between QoS Criteria
In service and component selection situations, often a trade-off decision has to be made between conflicting quality attributes, such as cost versus speed or
(a) Processing time per MB
(b) Memory usage per MB
Fig. 5. Accumulated average performance data
An Extensible Monitoring Framework for Measuring and Evaluating Tool
(a) Compression vs. time
233
(b) Compression rate vs. memory
Fig. 6. QoS trade-off between compression rate and performance
cost versus quality. When using the tool Free Lossless Audio Codec (FLAC)7 , several configurations are available for choosing between processing speed and achieved compression rate. In a scenario with massive amounts of audio data, compression rate can still imply a significant cost reduction and is thus a valuable tweak. However, this has to be balanced against the processing cost. Additionally, the option to verify the encoding process by on-the-fly decoding and comparing the output to the original input provides integrated quality assurance and thus increased confidence at the cost of increased memory usage and lower speed. Figure 6 projects compression rate achieved with nine different settings against used time and used memory. Each data point represents the average achieved rate and resource usage over the sample set from Table 1. It is apparent that the highest settings achieve very little additional compression while using excessive amounts of time. In terms of memory, there is a consistent overhead incurred by the verification, but it does not appear problematic. Thus, in many cases, a medium compression/speed setting along with integrated verification will be a sensible choice.
5
Discussion and Conclusion
We have described an extensible monitoring framework for enriching web services with QoS information. Quality measurements are transparently obtained through a flexible architecture of non-invasive monitoring engines. We demonstrated the performance monitoring of different categories of applications wrapped as web services and discussed different techniques and the results they yield. While the resulting provider-side instrumentation of services with quality information is not intended to replace existing QoS schemas, middleware solutions and requester-feedback mechanisms, it is a valuable complementary addition that enhances the level of QoS information available and allows verification of 7
http://flac.sourceforge.net/
234
C. Becker et al.
detailed performance-related quality criteria. In our application scenario of component selection in digital preservation, detailed performance and quality information on tools wrapped as web services are of particular value. Moreover, this provider-side measurement allows service requesters to optimize access patterns and enables service providers to introduce dynamic fine-granular policing such as performance-dependant costing. Part of our current work is the extension to quality assurance engines which compare the output of file conversion tools for digital preservation purposes using the XCL languages [3], and the introduction of flexible benchmark configurations that support the selection of specifically tailored benchmarks, e.g. to calculate scores for data with certain characteristics.
Acknowledgements Part of this work was supported by the European Union in the 6th Framework Program, IST, through the PLANETS project, contract 033789.
References 1. Becker, C., Ferreira, M., Kraxner, M., Rauber, A., Baptista, A.A., Ramalho, J.C.: Distributed preservation services: Integrating planning and actions. In: Christensen-Dalsgaard, B., Castelli, D., Ammitzbøll Jurik, B., Lippincott, J. (eds.) ECDL 2008. LNCS, vol. 5173, pp. 25–36. Springer, Heidelberg (2008) 2. Becker, C., Rauber, A.: Requirements modelling and evaluation for digital preservation: A COTS selection method based on controlled experimentation. In: Proc. 24th ACM Symposium on Applied Computing (SAC 2009), Honolulu, Hawaii, USA. ACM Press, New York (2009) 3. Becker, C., Rauber, A., Heydegger, V., Schnasse, J., Thaller, M.: A generic XML language for characterising objects to support digital preservation. In: Proc. 23rd ACM Symposium on Applied Computing (SAC 2008), Fortaleza, Brazil, vol. 1, pp. 402–406. ACM Press, New York (2008) 4. Carvallo, J.P., Franch, X., Quer, C.: Determining criteria for selecting software components: Lessons learned. IEEE Software 24(3), 84–94 (2007) 5. Cechich, A., Piattini, M., Vallecillo, A. (eds.): Component-Based Software Quality. Springer, Heidelberg (2003) 6. Dustdar, S., Schreiner, W.: A survey on web services composition. International Journal of Web and Grid Services 1, 1–30 (2005) 7. Erradi, A., Maheshwari, P., Tosic, V.: Ws-policy based monitoring of composite web services. In: ECOWS 2007: Proceedings of the Fifth European Conference on Web Services, Washington, DC, USA, pp. 99–108. IEEE Computer Society, Los Alamitos (2007) 8. Ferreira, M., Baptista, A.A., Ramalho, J.C.: An intelligent decision support system for digital preservation. International Journal on Digital Libraries 6(4), 295–304 (2007) 9. Franch, X., Carvallo, J.P.: Using quality models in software package selection. IEEE Software 20(1), 34–41 (2003)
An Extensible Monitoring Framework for Measuring and Evaluating Tool
235
10. Head, M.R., Govindaraju, M., Slominski, A., Liu, P., Abu-Ghazaleh, N., van Engelen, R., Chiu, K., Lewis, M.J.: A benchmark suite for soap-based communication in grid web services. In: Proceedings of the ACM/IEEE SC 2005 Conference Supercomputing, 2005, p. 19 (November 2005) 11. Her, J.S., Choi, S.W., Oh, S.H., Kim, S.D.: A framework for measuring performance in service-oriented architecture. In: International Conference on Next Generation Web Services Practices, pp. 55–60. IEEE Computer Society, Los Alamitos (2007) 12. Hunter, J., Choudhury, S.: PANIC - an integrated approach to the preservation of complex digital objects using semantic web services. International Journal on Digital Libraries: Special Issue on Complex Digital Objects 6(2), 174–183 (2006) 13. ISO: Software Engineering – Product Quality – Part 1: Quality Model (ISO/IEC 9126-1). International Standards Organization (2001) 14. Keller, A., Ludwig, H.: WSLA framework: Specifying and monitoring service level agreements for web services. Journal of Network and Systems Management 11(1), 57–81 (2003) 15. Larus, J.R., Ball, T.: Rewriting executable files to measure program behavior. Software: Practice and Experience 24(2), 197–218 (1994) 16. Liu, Y., Ngu, A.H., Zeng, L.Z.: Qos computation and policing in dynamic web service selection. In: WWW Alt. 2004: Proceedings of the 13th international World Wide Web conference on Alternate track papers & posters, pp. 66–73. ACM, New York (2004) 17. Michael Maximilien, E., Singh, M.P.: Toward autonomic web services trust and selection. In: ICSOC 2004: Proceedings of the 2nd international conference on Service oriented computing, pp. 212–221. ACM, New York (2004) 18. Menasc´e, D.A.: Qos issues in web services. IEEE Internet Computing 6(6), 72–75 (2002) 19. Nethercote, N., Seward, J.: Valgrind: a framework for heavyweight dynamic binary instrumentation. SIGPLAN Not. 42(6), 89–100 (2007) 20. Platzer, C., Rosenberg, F., Dustdar, S.: Enhancing Web Service Discovery and Monitoring with Quality of Service Information. In: Securing Web Services: Practical Usage of Standards and Specifications, Idea Publishing Inc. (2007) 21. Ran, S.: A model for web services discovery with qos. SIGecom Exch. 4(1), 1–10 (2003) 22. Rosenberg, F., Platzer, C., Dustdar, S.: Bootstrapping performance and dependability attributes of web services. In: International Conference on Web Services (ICWS 2006), pp. 205–212 (2006) 23. Saddik, A.E.: Performance measurements of web services-based applications. IEEE Transactions on Instrumentation and Measurement 55(5), 1599–1605 (2006) 24. Song, H.G., Lee, K.: Performance Analysis and Estimation Tool of Web Services. In: Business Process Management, sPAC (Web Services Performance Analysis Center). LNCS, vol. 3649, pp. 109–119. Springer, Heidelberg (2005) 25. Tian, M., Gramm, A., Ritter, H., Schiller, J.: Efficient selection and monitoring of qos-aware web services with the ws-qos framework. In: Proceedings. IEEE/WIC/ACM International Conference on Web Intelligence, WI 2004, pp. 152– 158 (September 2004) 26. Wickramage, N., Weerawarana, S.: A benchmark for web service frameworks. In: 2005 IEEE International Conference on Services Computing, July 2005, vol. 1, pp. 233–240 (2005)