32nd Annual International Conference of the IEEE EMBS Buenos Aires, Argentina, August 31 - September 4, 2010
SHIMMER™: An Extensible Platform for Physiological Signal Capture Adrian Burns, Emer P. Doheny, Barry R. Greene, Timothy Foran, Daniel Leahy, Karol O‟Donovan and Michael J. McGrath
Abstract—Wireless sensor networks have become increasingly common in everyday applications due to decreasing technology costs and improved product performance, robustness and extensibility. Wearable physiological monitoring systems have been utilized in a variety of studies, particularly those investigating ECG or EMG during human movement or sleep monitoring. These systems require extensive validation to ensure accurate and repeatable functionality. Here we validate the physiological signals (EMG, ECG and GSR) of the SHIMMER (Sensing Health with Intelligence, Modularity, Mobility and Experimental Reusability) against known commercial systems. Signals recorded by the SHIMMER EMG, ECG and GSR daughter-boards were found to compare well to those obtained by commercial systems.
I. INTRODUCTION HIMMER is a highly extensible wireless sensor platform which can be utilized for biomedical research applications [1, 2]. The light weight (~20 g) and compact form factor of the sensor make it very suitable for body worn kinematic and physiological sensing applications. Validation of the SHIMMER gyroscope daughter-board has been previously reported [6, 7]. This kinematic daughter-board has been applied to both gait analysis and falls risk assessments, such as the „Timed Up and Go‟ test [6, 7, 9]. Results showed that temporal gait parameters obtained using the SHIMMER gyroscope daughter-board compared favourably with an optical motion capture system (CODA motion analysis system) and suggest that the SHIMMER sensor platform may be useful in quantitative assessment of falls risk in the elderly. SHIMMER also features a number of physiological sensing capabilities, namely electrocardiography (ECG), electromyography (EMG) and galvanic skin response (GSR). The wireless, lightweight nature of SHIMMER would be particularly suited to applications of physiological sensing under ambulatory conditions.
A number of experiments which validate the performance of SHIMMER‟s physiological sensing daughter-boards are reported in this paper. The firmware used for the validation studies was developed using TinyOS [4], has been released publicly via SourceForge and can be found in the “contrib/handhelds/apps/BioMOBIUS” directory. A BioMOBIUS PC application [5] was used to capture data transmitted from body-worn SHIMMER sensors via Bluetooth. Data was analyzed offline using Matlab (Version 7.8. Mathworks, Natick, VA, USA).
S
Manuscript received April 1, 2010. This research was completed as part of a wider programme of research within the TRIL Centre, (Technology Research for Independent Living), funded by Intel and IDA Ireland. http://www.trilcentre.org. The TRIL Centre is a multi-disciplinary research centre, bringing together researchers from University College Dublin, Trinity College Dublin, National University of Ireland Galway and Intel. http://www.trilcentre.org. A. Burns is with Intel‟s Digital Health Group and the TRIL centre (
[email protected]). E. P. Doheny, B. R. Greene, K. O‟Donovan and M. J. McGrath are with Intel‟s Digital Health Group, Leixlip, Co. Kildare, Ireland, and the TRIL centre, Ireland. T. Foran is with the TRIL centre and Dept. of Medical Physics and Clinical Engineering, St. James‟s Hospital, Dublin 8, Ireland (
[email protected]). D. Leahy is with the TRIL centre, University College Dublin, Dublin, Ireland (
[email protected]).
978-1-4244-4124-2/10/$25.00 ©2010 IEEE
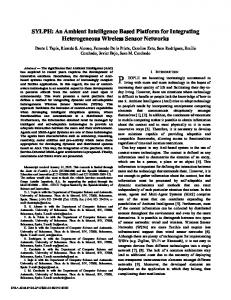
Fig. 1. SHIMMER physiological sensor.
II. METHOD A. EMG The performance of the SHIMMER EMG daughter-board [1, 2] was evaluated by comparing its output with a wellestablished commercial EMG system, the Grass P511AC Amplifier (Grass Technologies, West Warwick, RI, USA). Surface EMG was recorded from the biceps brachii muscle of seven healthy subjects (4 female, 3 male; mean age: 26.85 ± 2.85 years) during isometric contractions. The subject‟s skin was prepared by gentle abrasion and cleansing with alcohol. Electrodes were located according to the SENIAM [3] guidelines for the biceps brachii muscle, with a fixed inter-electrode distance of 2.54 cm. One pair of bipolar electrodes was used to record the data, and the signal was split allowing independent filtering, amplification and sampling by both EMG systems. The reference electrode was located on the back of the hand. The right upper arm of the subject was vertical and next to the trunk. The forearm was held in a neutral position with respect to supination and pronation. Contractions were performed at 90 degrees of elbow flexion – the forearm was perpendicular to the upper arm. The subject first relaxed completely, then contracted their biceps for approximately 8 seconds holding the level of contraction as even as possible, and then relaxed again. Each subject preformed ten iterations of this task at self-selected force levels. Surface EMG was simultaneously recorded using SHIMMER EMG and the Grass P511AC Amplifier system.
3759
All EMG data were sampled at 1024 Hz and were band pass filtered from 3-1000 Hz using a fourth order Butterworth filter. The Grass EMG system featured an additional 50 Hz notch filter, hence the SHIMMER EMG data was also notch filtered at 50 Hz. SHIMMER EMG data were recorded in BioMOBIUS [5] and persisted to a text file. The signals were then analyzed and compared in the time and frequency domains. The raw EMG data were normalized with respect to the maximum value over the entire recording. The signal to noise ratio and the root mean squared (RMS) amplitude of the normalized filtered signals were then compared for all contractions. The power spectral density was also examined, and frequency contents of the signals were compared. B. ECG A number of tests were carried out to validate the SHIMMER ECG daughter-board [1, 2] as a valid tool for acquiring ECG. Its baseline amplifier and ADC performance (gain, frequency response, linearity and pulse rate) was evaluated using simulated ECG signals from a Fluke MPS450 patient simulator (Fluke Corporation, WA, USA). A 10 s recording of ECG from a resting healthy subject was simultaneously captured by the SHIMMER ECG and MAC 3500 12 Lead ECG Analysis System (GE Healthcare, AZ, USA). In order to validate the performance of the SHIMMER ECG daughter-board for use in ambulatory monitoring, the performance of the SHIMMER ECG was also compared with that of a healthy non-resting subject using a Medilog Holter ECG monitor (SCHILLER Medilog, NSW, Australia). The PhysioNet MIT BIH database was used to test QRS detection and R-R interval correction algorithms, which were developed by TRIL researchers [2]. SHIMMER ECG was recorded using standard three lead ECG techniques. Lead II refers to the voltage between the electrode closest to the right arm (RA) and the electrode placed nearest to the left leg (LL). Lead III refers to the voltage between the electrode placed closest to the left arm (LA) and LL. Lead I refers to the voltage between RA and LA. Each Lead voltage was derived from a different channel on the SHIMMER ECG daughter-board. All amplitude scaling refers to Lead II with other leads scaled accordingly. SHIMMER ECG data were recorded in BioMOBIUS [5] and persisted to a text file. All ECG data were band pass filtered between 0.16 Hz and 150 Hz, MAC 3500 ECG signals were additionally notch filtered at 50 Hz to remove power-line noise. SHIMMER ECG data were sampled at 512 Hz, Medilog Holter ECG data were sampled at 4096 Hz and MAC 3500 data were sampled at 500 Hz. C. GSR The performance of the SHIMMER GSR daughterboard [1, 2] was compared with that of the Nexus-10 system (Mind Media BV, Roermond-Herten, Netherlands). In this test, all skin resistance values were calculated by the microcontroller on the SHIMMER baseboard and then transmitted to a PC for comparison with the Nexus-10 system. To validate the GSR hardware (and implemented algorithm in SHIMMER
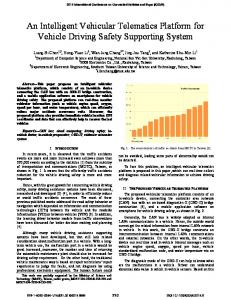
GSR firmware), the exact resistance of 18 resistors (ranging from 10 kΩ to 4.7 MΩ) was first determined using a multimeter. The SHIMMER GSR and Nexus-10 systems were then used to measure the resistance of each resistor. The GSR signal is composed of tonic and phasic activities. The slowly varying base signal is the tonic GSR, also called the skin conductance level (SCL). This validation compared the tonic GSR between the two systems. The „Handbook of Psychophysiology‟ [8] lists 0.5-0.05 Ω (2-20 S) as typical tonic level and 5-1 Ω (0.2-1 μS) as a typical stimulus change. Therefore at a minimum the SHIMMER GSR board should resolve 50 kΩ – 500 kΩ (2-20 μS). Phasic GSR tests were also conducted. These tests were carried out on human subjects to compare the SHIMMER GSR and Nexus-10. The Nexus-10 electrodes were placed on the right hand while the SHIMMER GSR was placed on the left hand. Electrode gel was used on the skin with electrodes placed on index and middle finger but with this method, there were large offsets between the two data sets captured. III. RESULTS A. EMG EMG data acquired using the SHIMMER EMG system and the grass amplifier system were compared for all subjects and each iteration of the task described above, Fig. 2.
Fig. 2. Filtered, normalized EMG signal simultaneously recorded by SHIMMER EMG and the Grass Amplifier system.
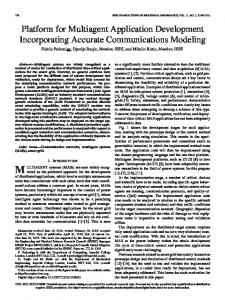
The normalized RMS amplitude and the signal to noise ratio of the EMG signals were first examined. The mean and standard deviation of each parameter across all subjects and iterations were compared, as shown in Table 1. The mean RMS amplitude, normalized with respect to its maximum value of each signal, varied by approximately 8% between systems. The mean signal to noise ratio was 16% greater for the SHIMMER EMG system. The frequency content of the EMG data was also compared. The power spectral density of each signal was examined, as presented in Fig. 3. The median frequency of each EMG recording was examined and the mean value over all EMG recordings varied by approximately 3% between the two systems, Table I.
3760
The linearity of the ECG data was investigated using a simulated 2 Hz triangular wave, with 1 mV amplitude, which was then captured using the SHIMMER ECG. Visual inspection of the resulting waveform confirmed the signal possessed good linearity characteristics. A calibrated series of pulses at 60 pulses per minute was generated by the Fluke MPS450 Patient Simulator and captured by the SHIMMER ECG. The pulse rate captured by the SHIMMER ECG was 60 pulses per minute. TABLE II FREQUENCY RESPONSE OF SHIMMER ECG DAUGHTER-BOARD Frequency (Hz) Amplitude (dB) 0 0.5 10 50 100
Fig. 3. Power Spectral Density of both filtered EMG signals recorded during a sample muscle contraction. TABLE I COMPARISON BETWEEN SHIMMER EMG AND COMMERCIAL EMG SYSTEM. MEAN VALUES ARE PRESENTED FOR ALL PARAMETERS. Parameter SHIMMER Grass Error EMG Amplifier (%) Normalized RMS Amplitude Signal/Noise Median Frequency (Hz)
0.22 ± 0.04
0.24 ±0.04
8.25
4.59 ± 0.79 61.84 ± 25.03
5.33 ± 0.19 60.57 ± 16.39
4.04 3.14
0 0 0 -0.8 -2
A simulated normal ECG signal of 1 mV QRS amplitude (60 BPM) was captured by the SHIMMER ECG and also captured by the MAC 3500 ECG Analysis System. The captured waveform, presented in Fig 6, was recognizable by a clinician as Normal Sinus Rhythm. The amplitude on LEAD II was scaled correctly to 1 mV. It was also noted that the signal quality was comparable to that captured using the MAC 3500, Fig. 7.
B. ECG The gain of the SHIMMER ECG was initially examined. A sine wave of amplitude 1 mV and frequency 10 Hz was generated using the Fluke MPS450 Patient Simulator and was captured simultaneously by the SHIMMER ECG and the MAC 3500. The resulting peak to peak amplitude of the SHIMMER ECG signal was 1 mV for LEAD II (Fig. 4.) verifying the quoted gain of 175. The SHIMMER ECG signal amplitude was also found to be comparable with the amplitude of the signal captured by the MAC 3500 ECG Analysis System. Fig. 6. Simulated normal ECG signal of 1mV QRS amplitude (60 BPM) captured by the SHIMMER ECG
Fig. 4. 10Hz sine wave of amplitude 1mV generated using the Fluke MPS450 Patient Simulator captured by the SHIMMER ECG
The frequency response of the SHIMMER ECG was then examined. Four different sine waves of amplitude 1 mV and frequencies of 0.5 Hz, 10 Hz, 50 Hz and 100 Hz were generated and captured using the SHIMMER ECG. The 10 Hz sine wave was taken as the standard reference waveform for comparison with the other frequencies. The results, presented in Table II, show the reduction in amplitude of 0.8 dB at 50 Hz and a reduction of 2 dB at 100 Hz.
Fig. 7. Simulated normal ECG signal of 1mV QRS amplitude (60 BPM) captured by the MAC 3500.
A 10 s recording of ECG from a resting healthy subject was simultaneously captured by the SHIMMER ECG and MAC 3500 ECG. Normal sinus rhythm was recognizable when both the SHIMMER ECG data and the MAC 3500 ECG data were examined. ECG from a non-resting (walking at moderate pace) healthy subject recorded by the SHIMMER ECG compared
3761
well to the Medilog Holter monitoring system for QRS detection of normal sinus rhythm. The entire ECG recording acquired using the SHIMMER ECG board is presented in Fig. 8, along with the associated heart rate (bpm) for this recording. The mean percentage difference between the R-R intervals calculated using each acquisition system was found to be 0.0192%.
Fig. 8. A: Segment of non-resting ECG acquired using the SHIMMER ECG board. Automatically detected QRS points (marked with an „x‟) were manually verified. All QRS points were correctly detected. B: Heart rate (BPM) associated with the ECG recording presented in A.
C. GSR With the design of the SHIMMER GSR hardware (internal hardware mux and multiple switchable internal resistors) and the corresponding implemented algorithm in SHIMMER GSR firmware it was possible to resolve between 10 kΩ-4.7 MΩ (0.21 - 100 μS). The results presented in Fig. 9 show a comparison of SHIMMER GSR and Nexus-10 for tonic GSR. Skin resistance readings greater than 2.7 MΩ could not be obtained from the Nexus-10 system. The total average absolute error for the SHIMMER GSR was 2.33% and the Nexus-10 was 4.08%.
SHIMMER would provide a reliable method for recording EMG. Similarly, results reported here indicate that the SHIMMER ECG is a valid tool for acquiring ECG from resting and non-resting human subjects. The amplitude and linearity characteristics as well as QRS points and heart rate derived from resting and non-resting ECG of the SHIMMER ECG compared well with the commercial ECG system. The SHIMMER GSR compared closely with a commercial system for acquisition of tonic GSR over a wide range of resistance values. The errors observed in phasic GSR may have been due to skin preparation, the fact that GSR sensors were located on different locations (SHIMMER GSR on left hand, Nexus-10 on right hand), or the fact that both wrists of the human subjects were not grounded and thus the two devices were insufficiently isolated. Validating SHIMMER GSR for phasic activity will be a focus of future work. The low-cost, modularity and small form factor of the SHIMMER sensor platform makes it an ideal platform for ambulatory physiological monitoring applications. The platform provides flexibility in terms of data capture and storage owing to the dual radio system on the baseboard (Bluetooth and IEEE 802.15.4) and SD logging capability which may provide for a variety of in-field and long-term monitoring applications. Future research will examine future applications of the platform and the validation of new daughter-boards such as an improved gyroscope, a magnetometer and motion sensor boards. Additionally, future work will focus on improvements to the protocol for synchronising multiple SHIMMERs while streaming wirelessly to ensure that the use of multiple SHIMMERs in an application will not compromise system performance. [1] [2]
[3]
[4]
[5] Fig. 9. Percentage error from 28 different fixed resistors between 10kΩ4.7MΩ IV. DISCUSSION
Surface EMG data recorded using a well established EMG amplifier system and the new SHIMMER EMG compared favorably in terms of both time and frequency domain parameters. The RMS amplitude and median frequency of the EMG signals recorded by the SHIMMER EMG compared well with the corresponding values obtained from the commercial EMG system, and the signal to noise ratio obtained from the SHIMMER EMG was superior to that of the Grass EMG amplifier system. These results suggest that
[6] [7] [8] [9]
3762
REFERENCES http://www.csi.ucd.ie/capsilwiki/index.php/SHIMMER, "SHIMMER wireless sensor platform," 2009 A. Burns, B. R. Greene, M. J. McGrath, T. J. O'Shea, B. Kuris, S. M. Ayer, F. Stroiescu, V. Cionca, SHIMMER™ - A Wireless Sensor Platform for Non-invasive Biomedical Research, IEEE Sensors Journal, IEEE Sensors, in press, 2010. H.J. Hermens, B. Freriks, R Merletti, D Stegeman, J, Blok, G. Rau, C Disselhorst-Klug, G Hägg, “SENIAM 8: European recommendations for surface electromyography.”, Enschede: Roessengh Research and Development, 1999. Levis, P., Madden, S., Gay, D., Polastre, J., Szewczyk, R., Whitehouse, K., Woo, A., Hill, J., Welsh, M., Brewer, E., and Culler, D. 2004. TinyOS: An Operating System for Sensor Networks. Springer-Verlag, Berlin, Germany. M. J. McGrath and T. J. Dishongh, "A Common Personal Health Research Platform - SHIMMER and BioMOBIUS," Intel Technology Journal, vol. 13, 2009. K. J. O'Donovan, B. R. Greene, D. McGrath, R. O'Neill, A. Burns, and B. Caulfield, "SHIMMER: A new tool for temporal Gait Analysis," in IEEE Eng. Med Biol, Minneapolis, MN, 2009. D. McGrath, B. Greene, and B. Caulfield, "SHIMMER: A new tool for long-term, extra-laboratory gait monitoring," in ESMAC London, 2009. J. T. Cacioppo, L. G. Tassinary and G. G. Berntson, Handbook of Psychophysiology, Second Edition, 2004. B. R. Greene, A. O‟Donovan, R. Romero-Ortuno, L. Cogan, C. Ni Scanaill, R. A. Kenny. 'Falls risk assessment through quantitative analysis of TUG' presented at the 1st AMA-IEEE Medical Technology conference on Individualised Healthcare, Washington D.C., 21-23 Mar 2010.