109
Journal of Paleolimnology 22: 109–114, 1999. © 1999 Kluwer Academic Publishers. Printed in the Netherlands.
Computer Applications to Paleolimnology
An image database for diatom identification and nomenclature Ernest H. Joynt, III & Alexander P. Wolfe* Institute of Arctic and Alpine Research & Department of Geological Sciences University of Colorado at Boulder, CB 450, Boulder, CO 80309-0450, USA; *Author for correspondence: (E-mail:
[email protected]) Received 10 November 1997; accepted 8 October 1998
Key words: diatom taxonomy, digital images, relational database
Abstract A relational database linking diatom images, taxonomic nomenclature, sample collection information, and corresponding environmental data can be created easily using existing software packages. Structured properly, such a database becomes a dynamic tool for cataloguing specimens and recording associated site data. This, in turn, can greatly assist in the rapid communication of taxonomic and ecological information, the education of beginning analysts, and the assurance of taxonomic consistency.
Introduction Diatom taxonomy is never static. As knowledge of the diatoms increases, existing taxonomic and nomenclatural concepts are constantly modified to represent a better understanding of diatom biology. For scientists applying diatoms to issues such as environmental change or water quality management, the constantly evolving nature of diatom taxonomy often poses problems, especially when raw data (e.g. frustule counts) generated by multiple analysts must be harmonized. The freshwater Fragilariaceae are a particularly apt example of this situation (consider: Williams & Round, 1987; Lange-Bertalot, 1989; Flower et al., 1996), all the more since they represent a group so commonly dealt with by paleolimnologists. Conventional, printed floras are the primary source of taxonomic information, and they will never be replaced. However, they are expensive, rapidly out-ofdate, and, unlike the discipline, static. With recent increases in the power and sophistication of computer hardware and software technologies available to average users, digital reference sources become a viable alternative (e.g. Krammer, 1989). In this paper we describe a relational database structure that links diatom images, nomenclature, collection site information, and asso-
ciated environmental data. It represents a powerful tool since it is both flexible and dynamic. The incorporation of diatom nomenclatural information published on the World Wide Web greatly assists in understanding diatom synonymy and name changes. However, the database structure presented here is in no way limited to the diatoms: it could be relatively easily be adapted for use with other paleoenvironmental indicators (pollen grains, ostracodes, minerals, etc.). Another characteristic is the possibility of eventually publishing information contained in the database on the Internet, in so doing making the information inexpensively available to collaborators, distant colleagues, and the general public.
Materials and methods The diatom collections under consideration are primarily acid-cleaned sediment samples mounted in Naphrax®. Diatom images are captured using a Precision CCD video camera system (model CV-252) mounted directly to the trinocular head of an Olympus Vanox microscope equipped with Nomarski (DIC) optics, a 100× oil immersion objective, and an immersible condenser. The camera connects to the AV card of a Power Macintosh 6100 computer with 40 MB RAM, 2 GB hard disk, and
110 a 15" monitor (resolution: 832 × 624 @75Hz). Two software packages are used. NIH Image (version 1.61) is used for image capture and analysis. It is freely available from the National Institute of Health (http:// rsb.info.nih.gov/nih-image/). Stoermer (1996) provides a useful starting point on the use of NIH Image in diatom image analysis. For specimen measurements, the scale function in NIH Image is calibrated (from pixels to µm) with a stage micrometer. The database software used is FileMaker Pro (version 4.0) by Claris Corporation (http:/ /www.filemaker.com). Versions exist for both Macintosh and Windows platforms, so that files created in one environment are entirely compatible with the other.
site information from the Collections Table appears on-screen next to images being consulted from the Image Table (Figure 2). The first step is the capture and digital analysis of images using the video system and NIH Image. Files are generally saved in TIFF format, although other file types can be used. Images from alternate sources (e.g. scanned micrographs or line diagrams) are also appropriate. Standard measurements include valve length, width, diameter, and striae count in 10 µm, although other measurements, such as area, can be made simply. Prior to cropping and saving the image, a 10 µm bar is drawn near the valve, so that a permanent scale is associated with each image.
The database
Image table
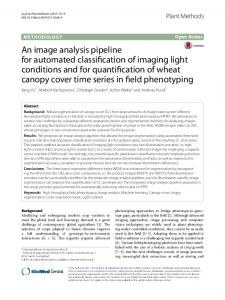
Described here is a relational database structure consisting of six inter-related sections, referred to as tables: Image, Nomenclature, Collections, Counts, EnvData and Methods. Both between and within the tables, relationships have been created to facilitate the organization of information. The overall structure of the database, including shared relationships, is shown in Figure 1. Selected information from shared relationships are displayed in the record currently being consulted, thus eliminating the need for continuous toggling between tables. For example, basic
Within the Image Table in FileMaker Pro, the saved image (or a reference to it’s file name) is imported to the image field (Figure 2). Information about the image, its filename, how it was captured and position on the slide, is entered in separate fields. Environmental and collection information is displayed when the site ID is entered and linked to information from the Collections Table. This feature can easily be modified to display more or less environmental data, depending upon the nature of the information stored in the Collections Table.
Figure 1. Organizational diagram of the Diatom Image Database. Lines indicate relationships between tables. The relationships shown are one-to-many (i.e. unique entries in one table relating to multiple entries in the dependent table), the ‘many’ being indicated by the forked line endings.
111
Figure 2. Example of the Image Table screen.
The taxonomic section offers fields for entering genus, species and, where applicable, subspecific designations. If the entered name exists in the Nomenclature Table, the taxonomic authority and year of publication appear automatically. This structure also indicates whether the entered taxon has undergone nomenclatural transfers, enabling amendments to be made in accordance to information from within the
Nomenclature Table, or from external sources. A synonymy is displayed indicating alternate designations of the displayed diatom. Nomenclature table One of the most useful features of the database is the Nomenclature Table (Figure 3A). The basis of this table
Figure 3. (A) Example of the Nomenclature Table screen. The three buttons to the left of each name perform the following functions: I = displays a linked image if one resides in the Image Table; T = most current name if a taxon has undergone transfer(s); S = produces a synonymy list for the current taxon. CODE = the unique species code for this name; Current = the species code of the currently used taxonomic name. (B) An example of synonymy, given for Brachysira brebissonii (see text for details).
112 is DIATCODE, a coded list of taxa with authorities, dates of publication, and coded transfers, compiled by diatomists from the British Museum and the Environmental Change Research Center, University College London (http://www.geog.ucl.ac.uk/~pmalipha/checklis.htm). Much of this information is based on Hartley (1986) and Williams et al. (1988), representing over 5000 freshwater, brackish, and marine diatom taxa. Their coding system, which has been adopted intact, consists of a 6 character alphanumeric combination that indicates genus, species and subspecific status. For example, Brachysira brebissonii Ross in Hartley 1986 has the code BR006A, in which genus = BR, species = 006, and subspecific status = A. Each taxon has a unique code which never changes. To indicate taxonomic transfers, a second code field is used. When a transfer to a new name has occurred, the code in this field is changed to that associated with the most current taxon. For example, Anomoeoneis serians var. brachysira (Bréb. ex Rabenh.) Hust. 1930, which has the code AN003B, has the associated current code BR006A, indicating that Brachysira brebissonii is the current name for the diatom in question. All taxa currently assigned to a current code therefore comprise a useful library of synonyms for the taxon under consideration (Figure 3B). Since authorities and dates are associated with the primary codes, one can use this information to follow the evolution of diatom names, thus gaining insight into ever-changing taxonomic and systematic concepts. In addition, there is also a relationship to the Image Table, so that images associated with the current taxon field in the Nomenclature Table can be accessed rapidly, if they exist. Collections table Important information about a sample’s collection is maintained in this table. Samples have an unique ID which is stored with location information (region,
latitude, longitude, location type) as well as collection method, date of collection, and collector. The layout of the Collections Table is illustrated in Figure 4. Environmental data table Environmental data regarding sampling sites are stored in the EnvData table (Figure 5A). An individual record is created for each measurement at every site. Fields included in the current structure include the measured parameters, their measured values, units of measure, and an indexed method ID. This structure is much more flexible than a ‘spreadsheet-style’ in which each site is given a single record containing a fixed number of data entries for that record. The model adopted here wastes no space for missing values, yet allows a variable numbers of entries, representing all types of environmental data, to be accommodated without changing the structure of the database. For example, multiple measurements of a single parameter for a given site, perhaps reflecting a seasonal environmental sampling strategy, can most easily be archived intact in this structure. Count tables The Count Table stores data about the abundance of taxa in counted samples. The data may be counts, relative abundances, concentrations, or presence/absence data. Two relationships are associated with this table. The first relationship is to the Collections Table, based on sample ID. The second is to the Nomenclature Table, based upon the taxon code. These relationships allow for quick listings of the distribution of a taxon, or of a listing of all species encountered at a given site (Figure 5B). Methods table The final table in this database is for maintaining information concerning data collection methods,
Figure 4. Example of the Collections Table screen.
113
Figure 5. (A) The EnvData Table showing environmental data collected for a single collection (sample B96-10). (B) The Count Table showing all taxa identified and counted (and expressed in relative frequencies) on a slide from the same sample.
counting protocols, or any other relevant meta-data associated with the contents of the Count and EnvData tables. This table currently contains fields for method ID, method name, and textual descriptions or notes surrounding the methodologies in question.
World Wide Web is an important objective. A consequence of such practices might be the better standardization of taxonomic schemes, especially for researchers in situations of limited access to printed taxonomic resources, or working outside their immediate fields of specialization.
Future considerations Acknowledgments To individual research groups, relational databases are especially valuable tools for archival and educational purposes. In this regard, simplicity of use is an important attribute, one that has been strived towards in the structure presented here. Beyond individual laboratories is the need to rapidly and inexpensively transfer large amounts of biological information of interest and potential benefit to the community at large. In this goal, the eventual publication of taxonomic databases on the
This ongoing project has benefitted from discussions with John Kingston, John Keltner, Victoria Andrle, and journal reviewers. Database development was implemented within the diatom components of NSF grants ATM-9402657 and ATM-9503275. This is PALE contribution number 104. Macintosh and Power Macintosh are registered trademarks of Apple Computer Inc., FileMaker is a registered trademark of Claris Corporation,
114 Windows is a registered trademark of Microsoft Corporation. The mention of commercial names does not represent endorsement. Templates for the database structure are available free of charge from the senior author.
References Flower, R. J., V. J. Jones & F. E. Round, 1996. The distribution and classification of the problematic Fragilaria (virescens var.) exigua Grun./Fragilaria exiguiformis (Grun.) LangeBertalot: a new species or a new genus? Diatom Res. 11: 41–57.
Hartley, B., 1986. A check-list of the freshwater, brackish and marine diatoms of the British Isles and adjoining coastal waters. J. Marine Biol. Assoc. U.K. 66: 531–610. Krammer, K., 1989. Relationale Datenbanken in der Diatomeen-Systematik. Nova Hedwigia 49: 405–421. Lange-Bertalot, H., 1989. Können Staurosirella, Punctastriata und weitere Taxa sensu Williams & Round als Gattungen der Fragilariaceae kritischer Prüfungstandhalten? Nova Hedwigia 49: 70–106. Stoermer, E.F., 1996. A simple, but useful, application of image analysis. J. Paleolimnol. 15: 111–113. Williams, D. M. & F. E. Round, 1987. Revision of the genus Fragilaria. Diatom Research 2: 267–288. Williams, D. M., B. Hartley, R. Ross, M. A. R. Munro, S. Juggins & R. W. Battarbee, 1988. A coded checklist of British diatoms. London, ENSIS Ltd., 74 pp.