An Image Processing Chain for Land-Cover Classification Using Multitemporal ERS-1 Data Jan Verhoeye and Robert De Wulf
!
I
Given the frequent cloud cover, regular updating of land-cover maps of tropical areas using optical satellite data is problematic. As weather-independent ERS images are available on a regular basis, the question is mised as to whether they can be used to produce a land-cover map. A processing chain has been developed: it consists of calibration, resampling, filtering, segmentation, principal component transformation, and supervised classifcation of multitempoml mdar images. As input to this processing chain, any number of SAR.PRI images or derived texture images can be used. The output consists of a land-cover map and an accumcy assessment. The procedure has been applied to a series of four SAR images, taken over northeast Costa Rica, which yielded a map with an overall accuracy of 76 percent. The high precision with which the large banana plantations can be mapped is most interesting, both for its economic importance and for environmental monitoring.
Introduction Land-cover maps are important tools for regional land-use planning. Not only should these maps contain the correct thematic information, but this information should also be up-todate. In tropical areas, the updating of the land-cover maps by use of optical satellite imagery, such as SPOT and Landsat, is often problematicd because of the frequent cloud cover. Quite often it will take years in order to procure a reasonably cloud free image; meanwhile, the value of the extant maps may decrease to a point where they are almost useless. Since the launch of ERS-1 (1991) and ERS-2 (1995) by the European Space Agency (ESA),synthetic aperture radar (SAR) images are available that are weather-independent and which cover a large part of the globe on a regular basis. So it is quite understandable that the question has been raised as to what extent these images can be used to produce new land-use maps, and with what accuracy this can be achieved. These are the questions which will be addressed in this paper.
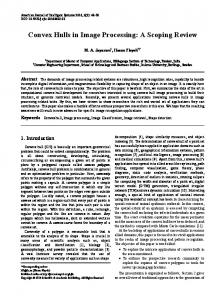
Methodology A suite of tools has been designed for processing of ERS.SAR precision (PRI)images (Figure 1). One or more PRI images, in conjunction with synthetic channels such as texture images, can serve as input. The output consists of a classified image and a measure of accuracy. This processing chain consists of a number of links that will be discussed in more detail. As a rule, the chain has been implemented using commercially available software. When commercial software was unavailable, additional soft-
Laboratory of Forest Management and Spatial Information Techniques, University of Gent, Coupure 653, B 9000 Gent, Belgium (
[email protected])(
[email protected]). PHOTOGRAMMETRICENGINEERING& REMOTE SENSING
ware programs have been developed. This is the case for the calibration, segmentation, and evaluation modules. CalNwatlon, RescaHng, FNtering, and PC1
First, the images are read from tape onto the computer hard disk, after which the header files of the PRI images are analyzed in order to extract the parameters needed for calibration. A program for calibration of ERS images has been developed using the formulas proposed by Laur (1992). Subsequently, the calibrated images are imported into the image processing sohare. At this point, the -21-dB to +5-dB range, containing approximately 95 percent of the pixels, is linearly rescaled to the 0 to 255 range. Very little information is lost because the resulting precision (approximately 0.1 dB) is s uperior to the accuracy inherent in the data (0.5 dB; ESA, 1997). This enables storage in an 8-bit data format and results in a considerable data volume reduction. After georeferencing, the images, originally measuring approximately 8000 by 8000 pixels, are reduced to 2000 by 2000 pixels by applying an averaging procedure. While allowing faster processing by further reducing the data volume, the averaging also removes some of the speckle. The resolution of resulting images is 60 meters. In an effort to further reduce the speckle, the images are subjected to filtering. Several techniques have been evaluated, both those specifically recommended for radar image processing (Lee, MAP, etc.), as well as those available within the image processing software (sigma filter). As an alternative, omission of speckle filtering has also been considered. A principal components transformation (PCT) has been applied to the Htered images. The analysis yields eigenvalues, which will be used as weights during the segmentation. As an alternative, not applying the transformation has also been considered.
Basic Principles of the Segmentation Algorithm Due to the speckle inherent in radar imagery, data segmentation is considered an important step in the processing chain. The segmentation algorithm described below has been illustrated using an example adapted from Rosenfeld (1984). For the sake of simplicity, the input image has been reduced to a single dimension (16 pixels), and a three-level pyramid is applied. The "Multiresolution Pixel Linking" algorithm (Burt,1984; Rosenfeld, 1984) creates multiple versions of the original image, each with decreasing resolution. By stacking these images one Photogrammetric Engineering & Remote Sensing, Vol. 65, No. 10, October 1999, pp. 1179-1186. 0099-1112/99/6510-ll79$3.00/0 O 1999 American Society for Photogrammetry
and Remote Sensing October 1999
1179
CallbratIan
Rescaling
Nolse FIHsdcg
PCT
SegmsntntIon
culated for each channel separately. When calculating the sum, each channel may be assigned a weight indicating its relative importance. The second step consists of the recalculation of each parent (Figure 2c). For each parent, all 16 potential children are evaluated. Only those that have been linked to the parent will be used for calculating a weighted average. The weights are the number of pixels in the base level (level 0) that have been linked to the current child through the child-parent links of lower levels. When several channels are involved, the new value is calculated for each channel separately. The newly calculated value for the parent can differ from the original one. For this reason, the linking and recalculation is reiterated until stable links emerge. This process is repeated for each pair of child-parent levels, starting from the base level upward till the top level is reached. By linking the pixels, starting from the base level upward till the top is reached, "treev-like structures are created within the pyramid. The "leaves" are formed by the pixels
Modua Filtering
Afi 62
Figure 1.Processing chain.
50
46
-
on top of the other, a tapering siructure is created, resembling a pyramid. The bottom layer (level 0) consists of the original image, measuring 2" rows by 2" columns. The next layer (level 1) measures 2" - rows by 2" - columns, while level k measures 2" - rows by 2" - columns. Usually, the pyramid will consist of m layers, with m < n, meaning that the pyramid will be truncated. Between two consecutive layers (n and n + 1,called child and parent level, respectively), parent-child relations are defined, with each child being linked to the parent which it most resembles. A parent on row i, column j, and level n + 1 has, by definition, 16 potential children on level n. These can be found on rows 2 i - 2, 2i - 1, 2i, 2 i + 1 and on columns 2j - 2, 2 j - 1, 2j, 2 j + 1. It can be proved that, by consequence, each child on row i, column j, and level n can choose from four potential parents, situated on row (integer)(i/2),(integer)(i/2) + 1,column (integer)(j/2), (integer)(j/2) + 1 on level n + 1. The initial values of the base layer (level 0) of the pyramid are obtained by copying the original image. The initial values of level k (> 0) are calculated by averaging the pixel values of level k - 1.Hong (1982) obtained the best results when the averaging was done within windows measuring two by two pixels (Figure 2a). A parent on row i, column j, and level n + 1 is calculated by averaging four children on level n. These can be found on row 2 i - 1, 2 i and column 2j - 1, 2j. When several channels are used for segmenting, the initialization is performed for each channel separately. The h s t step after the initialization consists of linking each child to the parent which it most resembles (Figure 2b), with the choice limited to the four potential parents described above. The criterion used for picking the parent is the Euclidean distance between the child and parent value, the child being linked to the closest parent. When several channels are involved, the distance is cal1180
October 1 9 9 9
38
34
38
54
50
58
58
50
58
66
50
58
46
54
(a)
00
48
d 50
46
38
34
38
54
50
58
58
50
58
66
50
58
46
54
66
50
58
46
54
(b)
QQ
48
d 50
-
46
38
34
38
54
50
58
58
50
58
(c)
00,
48
d 50 41
46 41
38 41
34 41
38 41
54 55
50 55
58 55
58 55
50 55
58 55
66 55
50 55
58 55
46 55
54 SS
(dl Figure 2. (a) Initializing by averaging. (b) Linking the children to the closest parent. (c) Recalculating the values of the parents, using only the children which are linked to them and a weight proportional to the size of their sup port area. (d) Linking and recalculating are repeated until convergence is reached. Finally the value of the roots are dumped down to the base, following the links.
PHOTOGRAMMETRIC ENGINEERING & REMOTE SENSING
(c)
(4
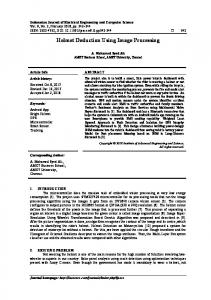
Figure 3. Principal components images, measuring 512 by 512 pixels, with a relative variance content of 6 3 % (a); 1 6 % (b); 11% (c); and 8 % (d).
in the base level, and the "roots" can be found at the top level. Leaves and roots are connected by "branches," symbolized by the links between child and parent. Note that "dead branches" can exist, defined as branches that are not linked down to the base level and which thus do not have any leaves. When dumping the root values, the values of the top level nodes are moved downward, following the parent-child links (Figure 2d). As the number of pixels in the top level is relatively limited compared to the number of pixels in the base level, the base level will be well segmented. Boundaries will also be respected as the root values are transmitted following the child-parent links. Results of the Segmentation A first set of input ERS-1 images used in the discussion of the results had been taken along the Pacific Coast of Costa Rica (Central America] in October and November 1993 and in May and August 1994 (Study area 1,Figure 7). The area is relatively flat and intensively used for agriculture. In the center there is a large oil palm plantation, bisected by the Parrita River. Four villages are situated on the river banks, and isolated houses can be found in the plantation and along the coast. The plantation is bordered on the inland side by grassland and agricultural fields. Extensive mangrove forests occurring along the coast are in the right corner of the image. To the right of the estuary of the Parrita River, a complex of fish ponds can be discerned. After co-registrating the original images, the dimensions of the input images had to be adjusted to 1024 by 1024 pixels, because the dimensions of the base layer of the pyramid is expressed as powers of two (2"). The four input images were subjected to a principal components transformation, which resulted in the four channels shown in Figure 3. At the same time, a statistical analysis was performed that determined the proportion of the total variance present in each of the output images. These values were further used as weights for the segmentation. PHOTOGRAMMETRICENGINEERING & REMOTE SENSING
Figure 4 shows the results of the segmentation using the four channels shown in Figure 3, with respective weights 63, 16, 11, and 8 and using a pyramid five layers in height. At first sight, the resemblance between the input and output images is striking. While performing the segmentation, each child has the opportunity to chose the parent which it most resembles from among four candidates, which assures that boundaries are being preserved to a large extent. Within the boundaries, on the other hand, the values are largely homogenized. The drawback is that point and linear elements, such as isolated houses and narrow waterbodies like the upstream reach of the Parrita River, tend to disappear as well. Although there is a very large resemblance between the input and the output images, it should be kept in mind that four channels were segmented simultaneously. This means that in every segmented channel there is also the effect of the other three to the extent indicated by their respective weights. As the number of pixels in the top level decreases exponentially as a function of the height of the pyramid, it is easily understood that the segmentation result will be strongly iduenced as well. This effect is shown in Figure 5. It can be seen that initially the segments are small, but they grow increasingly larger as regions with similar values are merged, until finally only a few large segments persist. By confronting the result of the classification with the ground truth, it will be possible to determine the optimal values for the height of the pyramid. Variations on the Segmentation Algorithm As a side effect of the segmentation, small "islands" of a certain value within more extensive areas of another value tend to disappear as they are "absorbed" by the larger areas. The problem can be illustrated by the case of the Parrita River, which at the estuary only measures five pixels. Values calculated exclusively using pixels that belong to the class "river" are found only on the lowest levels. On higher levels, nodes that belong to another class (the adjacent river bank) are included in the calculations, yielding very different values. After dumping the values of the top level onto the base
Figure 4. Segmentation result using four channels and a pyramid measuring five levels.
October 1099
1181
This method can be very useful when one is interested in details that have a specific pixel value range. In radar images, for instance, built-up areas and banana plantations typically have very high values, whereas smooth water surfaces have very low reflectances. On the other hand, it is not possible to retain details that do not have distinct values. The upper reaches of the Parrita River and the roads crossing the oil palm plantation have values that overlap with the agricultural areas. As a result, they can not be conserved by defining a specsc interval. The effect of using a root interval can be seen by comparing Figures 6a and 6b. In Figure 6a, an interval has been defined for the lowest pixel values, which typically correspond to water surfaces. As a result, the course of the river and the fish ponds are still clearly visible in the segmented image. In Figure 6b, on the contrary, no root interval has been used and the pixels belonging to the river have become mixed with those of the adjacent fields. A further improvement could be the introduction of a level below which it is not allowed for a child to become a root. This level will be called root level. By using these different techniques simultaneously (root interval with root level), an infinite number of combinations can be made. By confronting the result of the classification with the ground truth, it will be possible to determine the optimal values for the root level. Classification,Majority Filtering, and Accuracy Assessment The segmented images are then used as input to a supervised classification, using the maximum-likelihood algorithm. Finally, the result of the classification is subjected to a majority filtering, using a 7 by 7 window. The classification result has to be compared with the ground-truth data in order to assess its accuracy. Classification error matrices are used for computing the overall accuracy (Lillesand and Kiefer, 1994) and the Kappa value (Rosenfield and Fitzpatrick-Lins, 1986; Hudson and Ramm, 1987). Figure 5. Segmentation result a s a function of the height of the pyramid: (a) 1,(b) 3, (c) 5, (d) 6, (e) 7, and (f) 8 levels.
level, pixels that belong to the class "river" contain values that differ markedly from the original value. Because the aim of the segmentation is to produce a more homogeneous image, valuable information can be lost from this type of data processing. Small point objects such as isolated constructions and fishponds as well as narrow linear structures such as rivers and roads are examples of features that mav d r o ~out or be masked. A sblutiGn to this problem can be the optional linking of children and parents. A rule should be defined which determines whether a child should link to its parent or whether it can exist as a root. In the latter case, trees can exist with leaves in the image (level O), but with its root somewhere within the pyramid (and not at the top level). One technique consists of defining a root interval. Nodes whose value lies within a predefined interval are not allowed to link with parents whose value lies outside this same interval. If they would choose such a parent, they are obliged to become a root. On the other hand, child nodes that lie outside of an interval are allowed to link with a parent who lies within an interval. This method has the advantage that the existence of roots within the pyramid is limited to certain intervals. Pixels that lie outside of any defmed interval are forced to link up to the top level, ensuring a good segmentation. 1182
October 1999
Application of the Processing Chain for Land-Cover classification in Costa Rica Study Area The processing chain has been applied to a second set of ERS-1 images taken over the Atlantic Zone of Costa Rica (Study area 2, Figure 7). This study area is situated approximately between g030'N and l l O Nand between 83"W and 84"W (Figure 7) and covers 425,000 hectares. The area is flat, with a few isolated hilltops reaching 170 meters in elevation. Most soils are well I
I
Figure 6. Segmentation result (a) with and (b) without root interval.
PHOTOGRAMMETRICENGINEERING& REMOTE SENSING
Figure 7. Study area
drained, with the exception of a more than ten-kilometer-wide zone along the Caribbean coast. The southern half is rather densely populated, with Puerto Viejo de Sarapiquf, Gucipiles, Gucicimo, and Siquirres as the main population centers. Until a few decades ago, the area was completely covered by wet tropical forest. The vegetation in the coastal swamps is characterized by the presence of the yolillo-palm (Raphia taedigera) (Harcourt et al., 1996). Recent colonization of the area has brought important changes to the original vegetation. Land use in the southern part is dominated by cattle ranches. More recently, banana plantations have expanded dramatically. Less important activities include the cultivation of peach-palm (Bactris gasipaes) and plantations of Gmelina arborea and teak (Tectona grandis) (Stoo~ogeland Eppink, 1995). The image data consist of four ERS-1 images, dating from 09 November 1992, 16 August 1993, 20 September 1993, and 25 October 1993. Collateral data consists of aerial photographs at a scale of 1:60,000, dating from 1992 and 1993, and covering 70,000 hectares. More than 1200 field observations of land use were collected in 1995. Reference Classlflcatlon
The four images serve as input to the processing chain described above. As each Iink in the chain can be varied independently, a large number of variations can be produced. In order to simplify the interpretation, only a single link at a time will be changed and the result will be compared to a reference classification. This reference classification is produced using the following procedure: multitemporal input (four images), sigma filtering using a seven by seven window, principal components transformation, segmentation using a pyramid consisting of seven levels with root level at level one and two root intervals, classification in five land-cover classes using the maximumlikelihood algorithm, and majority filtering using a seven by seven window. PHOTOGRAMMETRICENGINEERING & REMOTE SENSING
(0Microsoft).
In addition to the field observations, ground truth is provided by stereoscopic interpretation of the aerial photographs. The independent test pixels in the confusion matrix (Table 1)refer exclusively to this digitized interpretation. As can be seen in Table 1, no ground-truth data are available for the yolillo class. This is due to the fact that, on the aerial ph&ographs taken over these extensive swamp forests, no landmark features (like cross-roads and bridges) exist that can be referenced to the topographical map< The classification result is presented in Figure 8. The patches "not classified" within the study area correspond to isolated hills that have been masked out because the effects of layover and radiometric distortion do not allow a correct classification. The general picture is largely consistent with the land cover as interpreted from the aerial photographs and the field observations: (1)yolillo swamps along the Caribbean coast, (2) forests in the northern half of the study area, (3) extensive grasslands, and (4) large-scale banana plantations in the south. A more detailed picture can be obtained by studying the confusion matrix (Table 1).Overall accuracy is 76 percent. The rnisclassification of villages should come as no surprise because as houses in the study area are widely scattered along the roads and their surroundings are very heterogeneous, typically containing a lot of trees and small fields. Considering the spatial resolution of the images used (60 meters), pixels inevitably are mixed. Considerable confusion exists between forest and grassland. The largest error is that of commission, with almost 45 percent of the forest land cover actually belonging to the grassland class. This is probably related to the ranching practices applied in the study area: even intensively used grassland contains a fair amount of trees and remaining h m k s . More extensively used pastures tend to be invaded rapidly by scrubs and bushes, eventually leading to a dense and entangled secondary vegetation. This creates a rough surface and will lead to higher values of backscatter, which apparently are confused with those of forest. Similar observations have been made in the Brazilian rainforest (Keil et al., 1996) and on Borneo (Kuntz et al., 1996). October 1999
1183
Confusion Matrix Ground Truth (pixels) Classified as banana
forest
- -
banana forest villages grassland yolillo total
24994 2061 426 1867 43 29391
villages
grassland yolillo
-
2043 23795 250 13666 431 40185
364 125 23 378 4 894
2244 21078 344 98353 172 122191
0 0 0 0 0 0
29645 47059 1043 114264 650 192661
Overall Accuracy (%) Kappa Value Variance
76.39 57.02 0.000003
Producer's Accuracy (%) banana forest banana forest villages grassland yolillo total
85 7 1 6 0 100
total -
villages
grassland
41 14 3 42 0 100
2
-
17 0 80 0 100
-
5 59 1 34 1 100
yolillo
-
Consumer's Accuracy (%) banana forest banana forest villages grassland yolillo
84 4 41 2 7
7 51 24 12 66
-
villages
grassland
yolillo
total
1 0 2 0 1
8 45 33 86 26
0 0 0 0 0
100 100 100
On the other hand, the accuracies for classifying grassland and banana are fairly high: both producer's and consumer's accuracy range between 80 percent and 86 percent. Monitoring of banana plantations in particular could prove to be an important operational application, because these plantations represent important economic values, but also pose severe environmental threats (Hernandez and Scott, 1996).
Figure 8. Land-cover classification for 1993 derived from ERS-1 data.
Texture Channel An adaptive-window variance-based texture image was derived from the first principal component. The value of a pixel in the texture image is the local variance in an adaptively placed square window. The location of the window used to calculate local variance is the one with the lowest variance of all windows that include the pixel. The intent is to calculate texture while avoiding edge enhancements as much as possible (Ryherd and Woodcock, 1996). An extract from the texture image generated using a 3 by 3 window can be seen in Figure 9. Two features are especially striking: the high variances (bright tones) where sharp transitions occur, for instance, at the borders of the banana plantations (I), or along the river banks (2) the low values (dark tones) in the coastal zone where yolillo dominates (3).This is presumably due to the closed smooth canopy without emergent trees which characterizes this vegetation class.
Variations on the Processing Chain
As stated above, only a single link at a time will be changed and the result will be compared to the reference classification. Filtering The following alternatives have been considered: (1)no filtering, (2) sigma filter, (3) Lee filter, and (4) MAP refined filter within a 7 by 7 window. The results of the accuracy assessment are presented in Table 2, together with their respective Z-values. It appears that filtering dramatically increases the accuracy from 55 percent to 76 percent. The lowest accuracy is obtained without filtering, which indicates that the smoothing effect of the segmentation does not make filtering superfluous. The highest accuracy is obtained using the sigma filter. Even though the filtering operation is rather time consuming (one hour processing time per image, Table 3), it certainly is a rewarding step. Principal Components Transformation (PCT) Table 4 illustrates that the application of a PCT yields a modest gain in accuracy. Nevertheless, the application of PCT can be valuable considering the modest amount of processing time involved (Table 3). 1184
October 1999
TABLE 2. COMPARISON BETWEEN CLASSIFICATION RESULTS WITH APPLICATIONOF DIFFERENTFILTERS. No Filter
Sigma
Lee
MAP
Overall Accuracy (%) 55.07 76.39 59.40 62.87 57.02 Kappa Coefficient (%) 32.72 38.73 41.62 Variance 0.000002 0.000003 0.000002 0.000003
z (*I No Filter Sigma Lee
No Filter
Sigma
Lee
MAP
108.67
30.00 81.84
39.80 62.87 12.97
MAP -
(*) Kappas are significantly different at 95 percent probability if Z 1.96
PHOTOGRAMMETRICENGINEERING& REMOTE SENSING
TABLE3. ESTIMATION OF PROCESSING TIME.
TABLE5. COMPARISON BETWEEN CLASSIFICATION RESULTS WITH TEXTURE IMAGES.
Step
Estimate
Calibration (1) Rescaling and Georeferencing Filtering PCT Seementation (21 classification (3) Evaluation
2 h per image 2 h per image 1 h per image 0.25 h 12 h
Total Processing Chain
35 h for four images
No Texture
3 by 3
5 by 5
~ N C L U S ~ OOF N
7 by 7
Overall Accuracy (%) 76.39 71.52 78.23 77.71 Kappa Coefficient (%) 57.02 49.02 59.81 57.71 Variance 0.000003 0.000003 0.000003 0.000003
z (*I
Remarks: (1)Includes analyzing the tape content, copying the files to the hard disk. (2)Segmentation of four images, each measuring 2048 by 2048 pixels. (3)Does not include compiling the training set.
No Texture
No Texture 3 by 3 5 by 5 7 by 7
3 by 3
5 by 5
7 by 7
32.66
11.39 44.05
2.82 35.48 8.57
(*) Kappas are significantly different at 95 percent probability if Z > 1.96
TABLE4. COMPARISON BETWEEN CLASSIFICAT~ON RESULTS WlTH APPLICATIONOF PCT AND WITHOUT. No PCT
PCT
z (*)
Segmentation
As was pointed out in the description of the segmentation alOverall Accuracy (%) 75.68 76.39 gorithm, two important parameters need to be determined the 52.83 57.02 17.11 optimum height of the pyramid and the optimum root level. Kappa Coefficient (%) 0.000003 0.000003 Variance The minimum height of the pyramid is zero levels, which equals not applying the segmentation, while the maximum (*) Kappas are significantly different at 95 percent probability if Z > height is the number of levels where only two by two pixels 1.96 remain. In the latter case, the image will probably be excessively homogenized. As the images used as input to the processing chain measure 2048 by 2048 pixels, the maximum The texture image was included in the segmentation as an additional information channel and was assigned the same weight height will be ten levels. By varying the height of the pyramid while keeping all as the first principal component. other parameters constant, it is possible to describe the clasThree different window sizes have been evaluated, and sification accuracy as a function of the height [Figure 10). It the results can be seen in Table 5. For the 5 by 5 and 7 by 7 windows, a small gain in accuracy can be noted, whereas the can be seen that both the overall accuracy and the kappa inclusion of the other texture image results in a decrease. Keil value start at relatively low values. They increase gradually until a maximum is reached for a pyramid measuring seven et al. (1996) and Kuntz et al. (1996) have successfully incorlevels. After this optimum, the accuracy rapidly decreases porated texture images in their classification procedures, but because very heterogeneous sets of pixels are merged. A simHoekman et al. (1994) conclude that texture is less useful as ilar decline has been described by Ryherd and Woodcock a tool for the interpretation of ERS-1 images due to the rela(1996) while applying a different algorithm to optical images. tively coarse resolution. If the height of the pyramid is kept constant while the Because the extraction of textural features from the backroot level is being varied, the classification accuracy can be scatter images is a very time consuming process (several hours determined as a function of the root level (Figure 11).The processing time) and, furthermore, the gains in accuracy are rather limited, it appears that the addition of a textural chan- maximum root level will be equal to the height of the pyramid (seven in the current case). It appears that the general nel can not straightforwardly be recommended. tendency is a decreasing accuracy with increasing root level. This is due to the fact that a higher root level tends to reduce the effect of the root intervals that have been defined, because no optional linking exists below the root level. In fact, the case where the root level equals the pyramid height corresponds to the case where no root intervals have been
ta
smmll &ocmacy t%) 90
I0 0
,
b
?
2
4
B
L)
t0
rn.Idh.lphE
Figure 9. Texture image.
PHOTOGRAMMETRIC ENGINEERING & REMOTE SENSING
Rgure 10. Acouracy as a function of the pyramid height.
Belgium). The ERS-1.SAR images were made available by ESA. Mentioning trade names does not imply any kind of endorsement by the authors.
References Burt,P.J., 1984. The pvramid as a structure for efficient computation, OveranAccuracy (%)
0
2
4
6
8
I1W hvel
Figure 11.Accuracy as a function of the root level.
TABLE6. COMPARISON BETWEEN CLASSI~CATION RESULTS WITH AND WITHOUT MAJORITYFILTERING.
Overall Accuracy (%) Kappa Coefficient (%) Variance
No Majority
Majority
76.42 57.04 0.000003
76.39 57.02 0.000003
(*) Kappas are significantly different at 95 probability if Z
(*)
0.08
> 1.96
defined at all! From these observations, two conclusions can be drawn: the root level should be kept low and the definition of root intervals is a valuable variation on the basic segmentation algorithm.
Majority Filtering Table 6 shows that no significant differences can be found between the classification results with and without majority filtering. It appears that majority filtering should not be recommended as an indispensable processing step.
Conclusions From the evaluation of the processing chain, the following can be concluded: the classification of multitemporal ERS-1 data can yield a land-cover map with an accuracy of almost 80 percent, the accuracy with which banana plantations are detected is particularly high and indicates a potentially important operational application, filtering and segmentation are essential links in the processing chain, and the use of texture channels yields only limited benefits.
Acknowledgments Funding for this project was provided by the Federal Office for Scientific, Technical and Cultural Affairs (OSTC,Brussels,
~ultiresolution&age Processing and Analysis (A ~oseifeld,editor), Springer-Verlag, Berlin-Heidelberg-New York-Tokyo, pp. 8-35. ESA, 1997. New Views of the Earth. Volume LLl. Engineering Achievements of ERS-1, SP-1176/m, ESA, Noordwijk, The Netherlands, 36 p. Harcourt, C.S., J.A. Sayer, and C. Billington, 1996. The Conservation Atlas of Tropical Forests, The Americas, Simon & Schuster, New York-London-Toronto-Sydney-Tokyo-Singapore,pp. 160-171. Hernandez, C.E., and G.W. Scott, 1996. Evaluating and mauaging the environmental impact of banana production in Costa Rica: A systems approach, Ambio, 25:171-178. Hoekman, D.H., J.J. van der Sanden, and W. Bijker, 1994. Radar Remote Sensing of Tropical Forests: The SAREX-92 Campaign in Guyana and Columbia, First Interim Report, BCRS Report 94-01, Wageningen, The Netherlands, 114 p. Hong, T.H., 1982. Image smoothing and segmentation by multiresolution pixel linking: Further experiments and extensions, BEE Transactions on Systems, Man, Cybernetics, SMC-12:611-622. Hudson, W.D., and C.W. Ramrn, 1987. Correct formulation of the kappa coefficient of agreement, Photogmmmetric Engineering & Remote Sensing, 53:421-422. Keil, M., D. Scales, R.. Winter, H. Kux, and J.R. dos Santos, 1996. Tropical rainforest investigation in Brazil using multitemporal ERS-1 SAR data, Proceedings of the Second ERS Applications Workshop, London, 6-8 December 1995, ESA SP-383, pp. 77-82. Kuntz, S., C. Streck, and F. Siegert, 1996. Multitemporal evaluation of ERS-SAR data for monitoring deforestation of tropical forest, Proceedings of the Second ERS Applications Workshop, London, 6-8 December 1995, ESA SP-383, pp. 83-94. Laur, H., 1992. Derivation of Backscattering oD in ERS-1.SAR.PlU Products, ESAIESRIN, Frascati, Italy, pp. 1-17. Lillesand, T.M., and R.W. Kiefer, 1994. Remote Sensing and Image Interpretation, John Wiley & Sons, Inc., New York, Chichester, Brisbane, Toronto, Singapore, pp. 611-618. Rosenfeld, A,, 1984. Some useful properties of pyramids, Multiresolution Image Processing and Analysis (A. Rosenfeld, editor), Springer-Verlag, Berlin, Heidelberg, New York, Tokyo, pp. 8-5. Rosenfield, G.H., and K. Fitzpatrick-Lins, 1986. A coefficient of agreement as a measure of thematic classEcation accuracy, Photogrammetric Engineering 6.Remote Sensing, 52:223-22 7. Ryherd, S., and C. Woodcock, 1996. Combining spectral and texture data in the segmentation of remotely sensed images, Photogrammetric Engineering & Remote Sensing, 62:181-194. Stoorvogel, J., and G.P. Eppink, 1995. Atlas de la Zona Atldntica Norte de Costa Rica, Programa Zona Atlhtica (CATIE-UAWMAG), Guhpiles, Costa Rica, pp. 70-73. (Received 15 October 1997; revised and accepted 07 October 1998; revised 01 December 1998)