Aug 27, 1997 - Computation of medians and 95% prediction intervals based on the above pdf. Mapping of predictions and prediction uncertainties over a ...
An Implementation of the Bayesian Transformed Gaussian Spatial Prediction Model David Bindel Victor De Oliveira University of Maryland University of Maryland Benjamin Kedem University of Maryland August 27, 1997
1 Introduction The problem of statistical spatial prediction or interpolation arises in meteorology, geology, epidemiology, and other sciences that analyze spatial data. A spatial phenomenon is measured at a nite number of locations, but the behavior of the phenomenon at many other unmeasured locations is of interest. For example, a meteorologist who has rain gauge measurements of rainfall accumulation at a small number of locations may be interested in the accumulated rainfall at a location where it is impractical to place an additional rain gauge. The problem is how to predict the phenomenon of interest (here, rainfall accumulation) and attach an uncertainty measure to this prediction. One way to model a spatial phenomenon is to view it as a realization of a random eld Z (�) and to consider the observations as a sample from that random eld. The data and any known location-dependent covariates are then used to predict the value Z (s0 ) at some unmeasured location s0 , and to attach to this prediction an uncertainty measure �(s0 ). Ordinary kriging, a popular spatial prediction technique, is based on the assumption that the random eld Z (�) is Gaussian. However, many natural phenomena, including our example of rainfall, seem distinctly non-Gaussian. One way to model non-Gaussian behavior is to assume that the random eld Z (�) can be approximated by applying a nonlinear transformation to a Gaussian random eld Y (�). Trans-Gaussian kriging is the standard model for prediction in such transformed elds. In trans-Gaussian kriging, a transformation is selected that makes the data approximately Gaussian, the methods of ordinary kriging are used to predict in the Gaussian eld, and the resulting prediction is back-transformed with a correction for bias. The Bayesian Transformed Gaussian (BTG) model is an alternative to transGaussian kriging. Under the BTG model, no single transformation function is explicitly chosen. Instead, a parametric family of possible transformations is 1
considered, where the transformation parameter itself is considered unknown. In this way, the e�ects of choosing an incorrect transformation function are reduced.
2 Synopsis of the btg program The btg program is an implementation of the BTG model. For the source information on the BTG model for spatial prediction, see the paper by De Oliveira, Kedem, and Short [3], from which the notation used in this paper is derived. The btg program can perform: � Plotting of the predictive density function for any speci ed location � Computation of medians and 95% prediction intervals based on the above pdf � Mapping of predictions and prediction uncertainties over a rectangular region � Cross-validation assessment � Estimation of transformation and correlation parameters Ordinary users can easily change program settings and do computations through the graphical user interface. Users with C++ programming background can use the computational engine in their own programs or extend the existing program.
3 The basic algorithm Predictions produced by btg are based on the Bayesian predictive density function p(z0 jz ), where z = (z1 ; : : : ; zn )0 is the vector of observations. As described in the paper by De Oliveira, Kedem, and Short [3], the density p(z0 jz ) is a mixture of transformed t-densities with mixing distribution p(�; �jz ) Z Z
p(z0 j�; �; z )p(�; �jz ) d� d� R� R � p(z j�; �; z )p(z j�; �)p(�)p(�) d� d� = � � R R0 � � p(z j�; �)p(�)p(�) d� d�
p(z0 jz ) =
where � and � are respectively the correlation and transformation parameters, which in the BTG model are assumed random. Expressions for p(z0 j�; �; z ) and p(z j�; �) are given in the aforementioned reference. Because the � and � parameters cannot be integrated out analytically, a Monte Carlo algorithm is used to approximate the predictive density numerically. Approximations for the pdf p(z0 jz ) and the cdf F (z0 jz ), respectively given 2
by p^m(z0 jz ) and F^m (z0 jz ), are obtained by generating independently �1 ; : : : ; �m i.i.d. � p(�) and �1 ; : : : ; �m i.i.d. � p(�) and computing
p^m (z0 jz ) = F^m (z0 jz ) =
m X i=1 m X i=1
p(z0 j�i ; �i ; z )w(�i ; �i ); F (z0 j�i ; �i ; z )w(�i ; �i );
w(�i ; �i ) = Pmp(zpj�(zi ;j��i;)� ) : j =1
j j
There is a simple formula for p(z0 j�; �; z ), but there is no closed form for F (z0 j�; �; z ). However, F (z0 j�; �; z ) is a transformed t cdf, and it can easily be transformed back into a standard t cdf. Though the standard t cdf cannot be evaluated directly, it has a simple relation to the incomplete beta function [1], which can be evaluated e�ciently using a continued fraction expansion [5], [6]. The btg program plots densities by discretizing the e�ective range of z0 and computing p^m (z0 jz ) at each point in the mesh. The btg engine computes the approximate median and symmetric 95% prediction interval of F^m (z0 jz ) by using a bisection search to solve the equations F^m (^z0 jz ) = 0:5 F^m (^z0 + xjz ) ? F^m (^z0 ? xjz ) = 0:95 where z^0 is the approximate median and x is the radius of the approximate symmetric 95% prediction interval about z^0 .
4 Estimating model parameters The btg program computes maximum a posteriori parameter estimates by minimizing the function (
f (�; �) = ?p(z j�; �) for � 2 � and � 2 � 0
otherwise
where p(z j�; �) is known up to a positive proportionality constant. Starting from the highest probability parameter draw �i ; �i from the sample for Monte Carlo integration, a Hooke-Jeeves direct search algorithm [4] is used to nd the function minimum.
3
5 Transformation and correlation functions 5.1 Box-Cox transformation
The btg program uses the Box-Cox family of transformations for \normalizing" positive data
g� (x) =
(
x� ?1 for � 6= 0 �
log x for � = 0
The resulting family of distributions includes the Gaussian distribution (� = 1) and the log-Gaussian distribution (� = 0). By default, the parameter � is assumed to have a uniform prior distribution on [-3, 3], but the user can specify a di�erent interval of support.
5.2 Correlation functions
The isotropic correlation functions used by the btg program are
Exponential correlation K� (l) = �1l�2 ; where �1 2 (0; 1) and �2 2 (0; 2].
Mat�ern correlation
� �
� �
�2 K� (l) = 2�2 ?11?(� ) �l K�2 �l ; 2 1 1 where �1 > 0 and �2 > 0 and K�2 is a modi ed Bessel function of the third kind and order �2 [1], [6].
Rational quadratic correlation
�
2 �?�2 x K� (x) = 1 + �2 ; 1
where �1 > 0 and �2 > 0.
Spherical correlation
8 0. 4
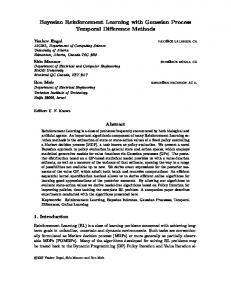
Figure 1: The tkbtg interface layout The value l is the Euclidean distance. In all the above correlation functions, �1 controls the range of correlation of the random eld, while for the exponential, Mat�ern, and rational quadratic correlation functions, �2 controls roughness or
smoothness of the random eld. For the exponential correlation function, �1 is assigned a uniform prior on (0; 1) and �2 is assigned a uniform prior on (0; 2). For the Mat�ern, rational quadratic, and spherical correlation functions, the btg program works with the transformed parameters �~1 = ? log(�1 ) and �~2 = ? log(�2 ), which are assigned uniform priors on (0; 1).
6 The tkbtg interface The tkbtg program is an X windows graphical interface to the btg program. With tkbtg, users can interactively manipulate program settings and access the functions of the btg engine. The tkbtg console, pictured in gure 6, has three major parts. The menu 5
bar at the top of the screen is used to execute computational tasks, load and save setting script les, and view the online help document. Program output and status messages are displayed on the main window. The console panel displays information about the current data set and allows users to view and update program settings.
6.1 Opening a data le
Data les are straight ASCII text les. On each line are the coordinates and value for one observation. For instance, an observed value of 29.55 at the point with coordinates (6:105; 0:772) would look like 6.105 0.772 29.55
By default, tkbtg will look for data les in the directory ~/btg_data. To change this behavior, create a le .btgrc in the home directory that looks like set btg_path ~/MyData
where ~/MyData is the name of the data directory. To open a data le, click on the \Open data" button on the main screen, then select the data le you want from the le selection dialog. If the le is successfully loaded, the name of the le will appear in the \Current data le" eld, and the ranges of the observation coordinates and values will appear in the \x range," \y range," and \z range" elds.
6.2 Settings
To modify the program settings, change the appropriate eld and click on the \Update settings" button. If you do not update settings, the btg engine will continue to use the old program settings.
Range of z0 Controls the e�ective range over which the predictive density is
considered. When the predictive density function is plotted, this is the range that is used. Predictions and 95% prediction intervals are truncated to this range. For instance, if the median of the approximated prediction density at some location was 75 with a symmetric 95% prediction interval of (45; 105) and the e�ective range of z0 was set at (1; 100), the program would report the truncated interval of (50; 100). The e�ective range of z0 should always be strictly positive, since the domains of the Box-Cox family transformation functions are the positive reals. Mesh size The mesh size is the number of points where the approximate predictive density function is computed. When the program computes the median and 95% prediction interval at a point, the target precision for the root- nding routine is the distance between adjacent mesh points. 6
Sample size Controls the size m of the parameter sample used for the Monte
Carlo integration algorithm. Increasing the sample size decreases the Monte Carlo approximation error, but it also increases the memory required by the program and the time required for predictions. Lambda range The lambda range setting controls the interval of support for the uniform prior distribution of the transformation parameter �. A single transformation can be selected by setting the range of � to include a single value. For instance, using a range of [0; 0] will cause the program to use only the logarithmic transformation. Correlation Controls which family of correlation functions is used. See section 5.2 for descriptions of the correlation functions. Trend order Controls the mean function of the underlying Gaussian random eld. Setting the trend order to n tells the program to use a polynomial of degree n in the location coordinates as the mean value for the Gaussian eld. By default, the trend order is zero, corresponding to a constant mean function.
6.3 Computations
The following computational tasks are available via the tkbtg \Compute" menu: Plot density Writes to a le the plot of the approximate predictive density p^m (z0 jz ) at a speci ed location. For systems where gnuplot is installed, the plot is displayed on the screen. Predict Computes the approximate predictor and 95% prediction interval at a speci ed location. Note that results will be truncated to the range of z0 speci ed by the user (see section 3). Mean squared density approximation error Estimates a bound on the standard error in p(z0 jz ) due to Monte Carlo approximation using the formula r Pm i=0 ((p(z0 j�i ; �i ; z ) ? p^m (z0 jz ))w(�i ; �i ))2 max z0 2S m
where S is the set of mesh points used in the discretization of the e�ective range of z0 . Estimate parameters Computes the maximum a posteriori estimates of the transformation parameter � and the correlation parameters �. Cross-validate Does single-point-deletion cross-validation for each point in the data set, and writes the results to le. For each point, the program outputs: � Observation location 7
� � � � �
Observed value Value predicted using the other points 95% prediction interval Residual Scaled residual (residual divided by a quarter 95% prediction interval width) In addition, the program outputs a summary of the mean square of the residuals and the actual coverage of the approximate 95% prediction intervals. Map Outputs maps of predictions and uncertainty measures over a rectangular region. Prediction is done at each point on a grid with block size speci ed by the user, and at each point the prediction and the uncertainty measure (de ned as a quarter the 95% prediction interval width) are written to disk. When the mapping is complete, the user will have two ASCII text les containing matrices for the prediction map and the uncertainty map. The ordering of the (i; j ) indices into the matrices corresponds to the ordering of the (x; y) coordinates for the grid points. Thus, the rst row of the matrix corresponds to the bottom of the grid, and the rst column corresponds to the left side of the grid. Initialize engine Reinitializes the prediction engine. Each time the prediction engine is initialized, a new sample is taken for Monte Carlo integration. The engine is automatically initialized before the rst computation any time a new data le is loaded or the settings are updated.
6.4 Loading and saving scripts
Once a data set has been loaded and the program settings have been tuned, it may be useful to save the settings for later use. This can be done using the \Save script" command under the \File" menu. The saved script will contain the currently displayed settings and the name of the currently loaded data le. If the settings have been altered since the last time the engine settings were updated, the displayed settings will be saved, not the settings being used by the prediction engine. Settings scripts can be loaded using the \Load script" under the \File" command. Loading a settings script causes the program to load the data le named in the script with the saved settings. Loading a settings script automatically updates the prediction engine settings.
7 Error messages The following is the list of btg error messages and their probable causes 8
Error: no data loaded The program has tried to perform a computation and
discovered that no data set has been loaded. Error: could not open le The speci ed le could not be opened for output when loading data or when doing a density plot, cross-validation, or mapping. Error: could not compute Student t cdf The program could not compute the value of a transformed Student t cdf. at some point in the speci ed e�ective range for z0. This error may occur when the user-speci ed range contains values that are negative or are too close to zero. In particular, this error may occur if the default setting of the e�ective range has not been changed after loading a new data set, or if the engine settings have not been updated after a change to the range setting. Error: could not compute p(z j theta, lambda, i) An error occured when the program tried to compute p(z j�i ; �i ). This may occur if the data set contains negative values, or if there was a numerical problem in a computation. The error might be xed by trying again; if it recurs, it may be because the current implementation of the btg engine is unable to handle the data set in its current form. This error can occur if the data set is badly scaled. Error: could not compute quantile to desired accuracy The root- nding routine used to determine the quantiles of the approximated predictive cdf could not achieve the desired precision. The target precision is the length of the e�ective range of z0 divided by the mesh size. This error may occur if the length of the interval z0 is incorrectly speci ed or if the target interval is very short and a large mesh size is used, leading to a target precision very close to (or less than) the machine epsilon. Error: could not compute modi ed Bessel function K The btg program could not evaluate a modi ed Bessel function when it tried to evaluate the Mat�ern class correlation function. The error might be xed by trying again; if it recurs, it may be because the current implementation of the btg engine is unable to handle the data set in its current form. Error: correlation is outside [0; 1] The btg program encountered an error when evaluating the correlation function. The error might be xed by trying again; if it recurs, it may be because the current implementation of the btg engine is unable to handle the data set in its current form. Error: could not factor matrix A correlation matrix was numerically singular and could not be factored. The error might be xed by trying again or by using a di�erent correlation function. If the error persists, it may because the current implementation of the btg engine is unable to handle the data set in its current form. Large data sets are more likely to have this problem; using only a subset of the observations may x the error. 9
This error is also likely to occur if observation points are very close to each other. If this is the case, rescaling the observation coordinates may help. The btg engine can produce other errors, but these errors should not occur even if there is a problem with the data set. If an error not listed above occurs, it is probably because of a bug in the btg program.
A Program organization The prediction program is constructed in four main layers Support code These are auxiliary routines, largely adapted from public domain sources, that are used by the btg prediction engine. Support routines include LAPACK linear algebra routines [2]; a C translation of the RKBESL routine for evaluating modi ed Bessel functions of the third kind, which is from the SPECFUN library written by W. J. Cody; and a modi ed version of a Hooke-Jeeves [4] optimization routine written by Mark Johnson. The unmodi ed versions of these routines are available from the Netlib software repository (http://www.netlib.org). The dmat and dmatchol classes for double precision matrices and Cholesky factorizations are written speci cally for the btg program. The errorhandling class used by the btg program is also speci cally written for the btg program. Prediction engine code These routines implement the core functionality of the prediction engine. Most of the routines are members of the Predictor class. Transformation, correlation, and covariate functions These routines are speci ed indepenedently of the prediction engine so that it is possible for a user to specify a new transformation, correlation, or covariate function without altering the prediction engine code. Interface code The interface code consists of two parts: a C++ program, which makes calls to the prediction engine and does some additional errorchecking and manages I/O; and a Tcl/Tk program, which communicates with the C++ program via a Unix pipe.
A.1 Support code
A.1.1 Interface to LAPACK routines
The LAPACK is a widely-used set of linear algebra routines based on the BLAS (Basic Linear Algebra Subprograms). The LAPACK source is publically available from Netlib, but many vendors supply optimized versions for speci c architectures. The LAPACK and BLAS routines are implemented in FORTRAN 77, though there is a C translation (CLAPACK), and there has recently been work 10
on a C++ interface to the routines (Lapack++). The btg program uses a specially designed C++ interface that handles the issues associated with interfacing code that uses C semantics with code that uses FORTRAN semantics. The dmat class implements a double precision matrix type with support for basic arithmetic operations. Storage allocation and indexing is handled automatically by the class, which stores matrices internally in a column-major (FORTRAN style) order rather than in the standard C row-major order. Arithmetic operations are implemented by calling the appropriate BLAS routines. The dmatchol class implements the routines to factor and solve linear systems using a Cholesky decomposition. Storage is indexed using the LAPACK packed matrix format, and the routines to factor and solve call LAPACK routines.
A.1.2 The error-handling mechanism
Though the draft ANSI C++ standard includes an exception handling mechanism, most compilers do not yet include complete support for exception handling. As a result, the btg program uses a less elegant, but more portable, method for handling errors. Errors are signalled by setting an error ag and saving a description of the error. Other code checks the setting of the error
ag before performing computations, and returns prematurely if the ag is set. In this manner, errors trigger a series of premature subprogram returns until control returns to the interface code (or whatever other code called the prediction engine). The interface then outputs the error message and clears the error status ag.
A.2 The prediction engine
To minimize repeated computations, the btg prediction works in three main phases. 1. A sample of parameters is generated to be used in the Monte Carlo integration algorithm. For each parameter draw of �i ; �i , the btg engine does the computations that involve only the original data and the parameters, and saves the results for use in later steps. 2. Before doing speci c computations at a location, the btg engine does general computations that depend on the original data, the parameter sample, and the prediction location. 3. Any speci c prediction tasks are performed. The rst step only needs to be performed when a new data set is loaded or when the program settings are changed. The second and third steps need to be performed for every location-dependent prediction task.
11
A.3 The tkbtg interface
The tkbtg program is a Tcl/Tk script which provides a graphical user interface to the btg engine functionality. In the current implementation, the tkbtg program communicates with a C++ text interface program through a Unix pipe. The text interface program interprets commands sent by the tkbtg program, calls the prediction engine to perform requested computations, and outputs an error code and any command output to the pipe.
B Using the Predictor class The prediction engine for the btg program is implemented in a C++ class called Predictor, which can be used by C++ programs to include the functionality o�ered by the prediction engine. The header le for the Predictor class is in the le btg013.hh.
B.1 Transformation, correlation, and covariate functions The following auxiliary public de nitions are found in btgfuncs.hh:
// Pointers to transformation, correlation, and covariate functions typedef double (*PFTransform)(double lambda, double z); typedef double (*PFCorrelation)(double *theta, double x1, double y1, double x2, double y2); typedef double (*PFCovariate)(double x, double y);
The PFTransform type is used to point to a function to compute a normalizing transformation g� or its derivative g�0 . PFCorrelation is used to point to a function for computing a parameterized correlation function K� , and PFCovariate is used to point to functions to compute location-dependent covariates for the underlying Gaussian eld Y . // Transformation (Box-Cox) double BoxCox(double lambda, double x); double DBoxCox(double lambda, double x);
These functions compute the Box-Cox transformation and its derivative. // Correlation functions double ExpCorr(double theta[], double x1, double y1, double x2, double y2); double MaternCorr(double theta[],
12
double x1, double y1, double x2, double y2); double RationalCorr(double theta[], double x1, double y1, double x2, double y2); double SphericalCorr(double theta[], double x1, double y1, double x2, double y2);
These functions compute exponential, Mat�ern, rational quadratic, and spherical correlations. // Covariate functions double double double double double double
UnitFn(double, double); XFn(double, double); YFn(double, double); XYFn(double, double); XXFn(double, double); YYFn(double, double);
These functions compute the location-dependent covariates 1, x, y, xy, x2 , and y2 .
B.2 Predictor class member functions // Initialize / shutdown the predictor Predictor(); ~Predictor();
The constructor: � Sets the transformation type to Box-Cox � Sets the correlation type to exponential � Sets the covariate functions list to 1. � Gives � a uniform prior over (?3; 3). � Sets the Monte Carlo sample size to 500. � Sets the mesh size to 1000. // Set different program options // Syntax for variable argument list commands: // SetCorrelation(PFCorrelation func, int n, // double min1, double max1, ...,
13
// // // //
double minn, double maxn) SetCovariates(int n, PFCovariate f1, ... PFCovariate fn);
void void void void void void void
SetTransform(PFTransform func, PFTransform dfunc); SetCorrelation(PFCorrelation func, int num_parameters, ...); SetCovariates(int num_covariates, ...); SetLambdaRange(double min, double max); SetRange(double min, double max); SetSampleSize(int sample_size); SetMeshSize(int mesh_size);
The SetTransform function tells the prediction engine what functions to use to compute the transformation and its derivative. SetCorrelation sets the correlation function to be used and the ranges of the elements of the structural parameter vector �. SetCovariates sets the list of covariate functions to be used for determining the mean of the underlying Gaussian eld. The unit function, computed by UnitFn should always be included in the list of covariate functions. Some transformation, correlation, and covariate functions are provided with the program, but the user can also use his or her own functions. SetLambdaRange sets the support interval for the uniform prior distribution for �. SetRange sets the e�ective range of z0 used for prediction and plotting. SetSample is used to set the Monte Carlo sample size. SetMeshSize sets the mesh size used to plot the approximate predictive density and to determine the precision to which quantiles of the predictive density are sought. // Load a data set int Load(char *fname); // Get the size of the current data set and the ranges // of the x, y, and z values int GetDataSize(); void GetRanges(double &xmin, double &xmax, double &ymin, double &ymax, double &zmin, double &zmax);
The Load function loads a data set from the named le. If the data is successfully loaded, the function returns 1; otherwise, it returns 0. The GetDataSize function returns the number of points in the loaded data set. GetRanges returns the minimum and maximum values of the x and y observation location coordinates and of the observed z values. If no data set is loaded, the GetDataSize function returns 0 and the GetRanges function sets all its output arguments to 0. 14
// Initialize the engine for different setting or for a new point (x,y) void InitComputations(); void Precompute_pz0(double x, double y);
The InitComputations function is used to initialize the prediction engine. This function must be called before performing computations after loading a new data set or changing settings. The Precompute pz0 function does location-dependent initialization. This routine must be called before doing prediction or plotting at a location. // Compute the median and 95% prediction interval // Also compute the estimated CDF, or other quantiles // and confidence intervals void ComputeStats(double &med, double &lb, double &rb); double ComputeCDF(double z0); double ComputeQuantile(double alpha); double ComputeSymmetricCI(double alpha, double med);
The ComputeCDF function evaluates the approximate predictive cdf F^m (z0 jz ). The ComputeQuantile and ComputeSymmetricCI functions use a bisection search to nd quantiles and symmetric prediction intervals for the approximate predictive density. The ComputeStats function returns the median of the approximate predictive density and left and right endpoints for a 95% symmetric prediction interval about that median. The function Precompute pz0 must be called before using any of these functions. // Diagnostics: Estimate Monte Carlo error for p(z0 | z) // or cross-validate at the kth data point (zero indexed) double ComputeErrorEstimate(double x, double y); void CrossValidate(int k, double &x, double &y, double &actual, double &median, double &lb, double &rb);
The ComputeErrorEstimate function computes an estimate of the maximum standard Monte Carlo error in the approximation of p(z0 jz ) over the speci ed e�ective range of z0 . The CrossValidate function performs cross-validation at the kth observation location (using zero-based indexing), and returns the observation location and value and the predictive density median and the symmetric 95% prediction interval. // Estimate model parameters void EstimateModel(double &lambda, double *theta, int &ntheta_arg);
15
The EstimateModel routine computes maximum a posteriori estimates for the transformation parameter � and the correlation parameter vector �. The function argument ntheta arg is used to return the length of the parameter vector used by the current correlation function. // Plotting routines: plot a distribution or a map of the error // If xflag = 0, don't include coordinates // (density plot is a vector of reals, map is a matrix) // else, include coordinates // (density plot is a vector of x/y pairs, // map is a vector of x/y/z triples) void Plot(ostream &os, int x_flag = 0); void Map(double xmin, double xmax, double ymin, double ymax, double step, ostream &osmap, ostream &oserr, int x_flag = 0);
Tbe Plot function plots the approximate predictive pdf over the e�ective range of z0 and writes the output to os. By default, the output is formatted as a vector of values for p(z0 jz ) for each z0 in the mesh. However, if x flag is nonzero, both the value of z0 and the value of p^m (z0 jz ) will be output for each z0 in the mesh. The Map function summarizes the prediction and uncertainty over a rectangular region speci ed by xmin, xmax, ymin, and ymax. Prediction is done at grid locations step units apart, starting from the lower left corner of the rectangle. Predictions are written to osmap, and uncertainty measures (one quarter the 95% prediction interval width) are written to oserr. By default, the maps are written as matrices, where the rst row corresponds to the bottom of the region and the rst column corresponds to the left side. However, if the argument x flag is given a nonnegative value then the maps will be output as vectors of x; y; z triples
References [1] Milton Abramowitz and Irene A. Stegun, editors. Handbook of Mathematical Functions. National Bureau of Standards, Washington, D.C., 1964. Reprinted by Dover Publications, New York, 1968. [2] E. Anderson, Z. Bai, C. Bischof, J. Demmel, J. Dongarra, J. Du Croz, A. Greenbaum, S. Hammarling, A. McKenney, S. Ostrouchov, and D. Sorenson. LAPACK User's Guide. Society for Industrial and Applied Mathematics, Philadelphia, 1992. Also available in HTML format from Netlib. [3] V. De Oliveira, B. Kedem, and D. Short. Bayesian prediction of transformed gaussian random elds. To appear in the Journal of the American Statistical Association, December 1997. 16
[4] R. Hooke and T. A. Jeeves. Direct search solution of numerical and statistical problems. Journal of the ACM, 8:212{229, April 1961. [5] William H. Press, Brian P. Flannery, Saul A. Teukolsky, and William T. Vetterling. Numerical Recipes in C. Cambridge University Press, Cambridge, 1988. [6] Shanjie Zhang and Jianming Jin. Computation of Special Functions. John Wiley and Sons, Inc., New York, 1996.
17