Institute of Oceanographic Sciences, Wormley, Godalming, Surrey, England GU8 5UB. AND. S. E. CALVERT. Department of Oceanography, The University of ...
An improved alpha scintillation counting method for determination of Th, U, Ra-226, Th-230 excess, and Pa-231 excess in marine sediments D. J. HUNTLEY AND M. K. NISSEN Physics Department, Simon Fraser University, Burnaby, B. C . , Canada V5A 1S6
J. THOMSON Institute of Oceanographic Sciences, Wormley, Godalming, Surrey, England GU8 5UB
Can. J. Earth Sci. Downloaded from www.nrcresearchpress.com by Renmin University of China on 05/28/13 For personal use only.
AND
S. E. CALVERT Department of Oceanography, The University of British Columbia, Vancouver, B. C . , Canada V6T 1 W5
Received July 8, 1985 Revision accepted December 3, 1985 In a previous paper it was shown that thick-source a counting is a simple means for determining Th, U, Th-230 excess, and Pa-231 excess concentrations, and hence sedimentation rates, for deep-sea sediments. Here it is shown that radon escape can lead to inaccurate results if powdered samples are used and that this problem can be overcome by preparing samples as a borate glass before measurement. Glassed samples also permit a novel measurement of the Ra-226 content by measurement of the post-fusion buildup of Rn-222, a determination shown to be necessary for near-surface sediments that have a deficit of Ra-226. It is also shown that Po-210 is lost during the fusion and that this loss can be allowed for in the calculations. The above observations are found on comparisons of measured and calculated a count rates for several Th and U standards and on comparisons with a spectrometry results from four sets of deep-sea core samples. I1 a CtC dCmontr6 dans un article publiC anterieurement qu'un dispositif muni d'une source epaisse d'excitation et d'un compteur a constitue un moyen simple pour dkterrniner les teneurs de Th et de U et les teneurs exckdentes de Th-230 et de Pa-23 1, et ainsi les taux de ~Cdirnentation,pour des sCdiments de mer profonde. Ici, il a kte dCmontrC que la fuite de radon peut introduire des erreurs dans les rksultats si on utilise des Cchantillons en poudre et que ces erreurs peuvent Ctre CliminCes si les Cchantillons a Ctre analysts sont pr6parCs par fusion dans un verre de borate. Les Cchantillons ainsi pn5par6s foumissent une nouvelle f a ~ o nd'Cvaluer la teneur du Ra-226 en mesurant I'accumulation aprks fusion du Rn-222, cette dktermination s'avkre nkcessaire pour les skdiments pauvres en Ra-226. I1 est Cgalement dCmontrC qu'au cours de la fusion il y a perte du Po-210 et que des calculs permettent de compenser pour cette perte. Les rCsultats obtenus ont kt6 contr61Cs par des comparaisons de mesures et de calculs de taux de comptage a sur plusieurs Ctalons d'U et de Th et des comparaisons de rksultats obtenus par spectromktne a pour quatre groupes d'kchantillons de carottes de skdiments de mer profonde. [Traduit par la revue] Can. J . Earth Sci. 23, 959-966 (1986)
Introduction The counting of a particles emitted from the surfaces of minerals has been used for some time to determine uranium and thorium contents (Kulp et al. 1952; Cheny 1963; Aitken 1985). Recently, Huntley and Wintle (1981) extended the method to the determination of excess Th-230 and Pa-231 contents of deep-sea sediments, the motivation being the desire to obtain correct radiation dose rates for thermoluminescence dating, particularly of sediments (Wintle and Huntley 1980, 1982; Berger et al. 1984). The excess Th-230 and Pa-231 contents so obtained can also be used to derive sedimentation rates, and since the a-counting method showed promise of being a much simpler alternative to the commonly used methods of a spectrometry, we have sought to establish this. In the method described by Huntley and Wintle (1981), the dried sediment powder was placed on a ZnS phosphor disc, which in turn was placed on a photomultiplier tube. Alpha particles emitted by the sample and entering the ZnS caused a large light pulse, which was detected using the photomultiplier tube. The count of a pairs in a 4 ms interval (fast pairs) was used to calculate the Pa-23 1 content, and the count of pairs in a 0.4 s interval (slow pairs) was used to calculate the Th-232 content. With an estimate of the uranium content, either by direct measurement or by using an average U/Th ratio for the sediment type in question, the total count rate was then used to calculate the Th-230 excess. Results on one core were found to Printed in Canada 1 Imprime au Canada
be in satisfactory agreement with values measured by a spectrometry; results were presented also for two other cores but with no independent evidence of their validity. We have extended the work on pelagic sediments and have obtained further comparisons with a spectrometry. We have found serious discrepancies between the two methods, which we attribute to disequilibrium resulting from radon escape of up to 50% or more, much more extensive than previously thought. To overcome this problem we have experimented with samples prepared in the form of a borate glass, as suggested by Prescott and Jensen (1980) and shown to be useful by Jensen and Prescott (1983). Recently, McCorkell (1986) has reported radon emanation rates of only 0.01 -0.04 % from fused borate glass discs. Our results obtained on standards and pelagic sediments, including some blind tests, show that this technique is successful. We have found that preparation of samples in the form of a glass has advantages in addition to the prevention of radon escape and is also of value in the simpler case of the determination of uranium and thorium contents of terrestrial samples.
Evidence for radon escape Huntley and Wintle (1981) maintained that radon escape did not cause any significant effect on the a counting of loose sediment powders. The evidence was the agreement between the results of a counting and a spectrometry on core RC8-39
960
CAN. J. EARTH
SCI. VOL.
23, 1986
TABLE1. Sediment core Discovery 9940K (lat. 34"10.8'S, long. 09"57.8'E, water depth 4975 m) Th-232 (ppm)
Can. J. Earth Sci. Downloaded from www.nrcresearchpress.com by Renmin University of China on 05/28/13 For personal use only.
Depth (cm)
a spectrometry
(Y
Powder
Th-230 excess (dpmlg)
counting Glass
a spectrometry
a counting Powder
Glass
NOTES: Comparison of Th-232 and Th-230 excess contents determined by a spectrometry with apparent values determined by gross a counting of sample powden and glasses. For calculating the Th-230 excess from the a count rates, the uranium contents determined by a spectrometry were used.
and no detectable increase in a count rate on sealing the samples. Aitken (1978) suggested that in the latter case, radon escape is not important unless the count rate increases by more than 10% . Subsequent measurements led us to conclude that radon escape is indeed substantial and that application of the a! counting method to powder samples leads to incorrect Th-230 and Th-232 contents. Table 1 shows the results obtained on core Discovery 9940K. It is clear that a counting gave erroneously low figures for the Th-230 excess in the upper part of the core and for the Th-232 in the lower part when compared with the a spectrometry data. For these samples we also observed a! count rate increases on sealing the loose powder samples both for the slow pairs and the total counts. The degree to which radon escape can affect the measured a! count rates can readily be calculated as outlined in Huntley and Wintle (1981) or from the more detailed listing of Bowman (1983). The Th-232 content is determined from a pair of a particles emitted after Rn-220 in the decay chain; thus 100% Rn-220 loss would result in zero apparent Th-232. The apparent Th-232 contents in Table 1 are as low as half the true values and thus indicate up to 50% Rn-220 loss. For the Th-230 excess, the effect of Rn-222 loss will depend on the storage condition since collection because of the 21 year half-life of Pb-210. The escape of radon in the wet sediment is not expected to affect any activities because of its short diffusion distance; from the data of Tanner (1964) we calculate this to be about 1 cm. On the other hand, in a dry sediment the Pb-210 activity would be expected to decrease with time if the Rn-222 is not retained. We calculate that for a recently dried sediment, complete Rn-222 loss would cause a 62 % reduction in the a! count rate. The figure would rise with time towards a limiting value of 77% when all the Pb-210 has decayed. The ratio of apparent to true Th-230 excess contents of Table 1, as low as 36%, can thus be interpreted to result from complete Rn-222 loss. As will be seen later, this is probably an overeitimate, because no allowance has been made for a deficit of Ra-226, which often occurs in the top 20-30 cm of pelagic sediments (Broecker 1974; Cochran and Krishnaswami 1980).
Methods The advantages of preparing a counting samples in the form of a glass were first realized by Jensen and Prescott (1983). The objectives were to prevent radon escape and to homog-
enize samples for which the radioactivity was not uniformly distributed among the various grain sizes. An additional advantage is the reduction in the variability of sample reflectivity (Huntley and Wintle 1978). The flux we use here is the Norrish and Hutton (1960) lithium tetraborate - lithium carbonate mix without any lanthanum oxide. The composition by weight is:
Lithium tetraborate (anhydrous) Lithium carbonate Sodium nitrate
This composition was chosen to maximize the amount of sample that could be dissolved in order to maximize the a count rate. The samples, made into glass discs up to 4 cm in diameter and 0.5 - 1 mm thick, are prepared as follows. The flux, predried at 500°C, is weighed with the sample into a nonwetting, 95% Pt - 5 % Au crucible. This is placed, with lid, on a silica tray in a furnace at 1100°C until the flux and sample are well fused. The crucible is then removed, allowed to cool, and weighed in order to obtain the weight loss. The glass is remelted over a large gas burner, the melt is poured into an aluminum mold at 325"C, and a heated brass block is quickly brought down onto it to spread the melt in the mold and to produce a flat surface for measurement. The bottom of the mold is bevelled so that the melt runs to the centre, and the edges are bevelled to allow the cooled glass disc to release easily. The mold is covered and allowed to cool slowly for 5 min to anneal the glass (otherwise it cracks) and then cooled more quickly to room temperature. With this procedure and a 2: 1 fluxlsample ratio it is possible to make glass discs filling a 4 cm diameter mold. With a 1:1 ratio the viscosity of the fluid prevents complete filling, and in such cases we stick tape around the edges to prevent alpha particles from them reaching the ZnS phosphor. The ratios quoted refer to the weights after fusion of the flux during which the lithium carbonate dissociates and the CO, is lost. For the later part of the work a prefired and grouid flux was used. The purpose of the sodium nitrate in the flux is to ensure an oxidizing condition and inhibit sublimation of polonium.
HUNTLEY ET AL.
TABLE2. Alpha count rates calculated for the various decay chains for sample only and two fluxlsarnple mixes a!
A,
Can. J. Earth Sci. Downloaded from www.nrcresearchpress.com by Renmin University of China on 05/28/13 For personal use only.
Initial nuclide
Concentlation (PP~)
nuclide only (d~m/g)
count rate from decay chain (Ms-I ~ m ' ~ ) 1:l fluxlsample
Sample
2:1 fluxlsample
Complete chain 0.244 37.2 0.737 122.2 0.0343 5.9 128.1 1.00 136 1.00 158
Th-232 U-238 U-235 U total Th-230 Pa-23 1
-
Po-210 lost
1.00
113 116
NOTES:For the glass samples the concentration is that of the nuclide in the glass (i.e., the reduction of count rate due to the dilution is not included here). As before (see Huntley and Wintle 1981), the residual range is chosen so that the count rate for Th-232 is 85% of the total. The values for the sample and 1: 1 and 2: 1 mixes are 1.08, 0.98, and 0.95 mg/cm2, respectively. Ms = lo6 s; dpm = disintegrations per minute.
TABLE3. Pair count rates for the two pairs of interest
Chain Th-232 U-235 Pa-23 1
Alpha pair emitters Rn-222 PO-216 Rn-219 PO-215 Rn-219 Po-2 15
Pair count rate (pairs Ms-I ~ m ' ~ ) Sample
1:l fluxlsample
1 ppm Th
2.31r
2. lor
2.04r
1.78 ms
1 PPm U
0.374r
0.344r
0.333r
1.78 ms
1 dpmlg of Pa-231
Half-life
Amount
0.145 s
10.9r
10.0r
2:1 fluxlsample
9.71r
NOTE:r is the fraction of detectable pairs actually counted due to finite gate opening times on the appropriate pair counter and is given by eq. [3] of Huntley and Wintle (1981).
This was recommended, but not actually used, by Jensen and Prescott (1983). There is some evidence that it is desirable. Jensen and Prescott found a 10% difference in glasslpowder count rate ratios of thorium and uranium standards, which R. A. Akber (1982, private communication) has suggested could be explained by Po sublimation. Recent measurements by Akber et al. (1985) have led them to suggest that their Po-210 loss was complete. Our first glass uranium standards were prepared without the sodium nitrate and yielded count rates 10% lower than calculated, consistent with the hypothesis of polonium loss. Although Eakins and Morrison (1978) have shown that polonium nitrate does not sublime up to 800°C, we present evidence later to show that significant Po-210 is lost in our fusions. The a spectrometry data were obtained using the method of Thomson (1982).
Conversion factors The total and pair CY count rates expected from various decay chains were calculated as described by Huntley and Wintle (1981) and are qiven in Tables 2 and 3. Here we have assumed an effective atomic weight for the sample equal to 21.4 and
that all the Li,CO, dissociates and the CO, is lost during fusion. For the a particle ranges, we have used the recent tables of Ziegler (1977) for individual elements and combined them to obtain an effective range, Reff, in the mixture using the formula
Here Yiis the weight fraction of element i in which the a particle range is Ri. Use of the Bragg-Kleeman rule instead would lead to a significant error because it does not accurately predict a particle ranges in elements of low atomic number. There are several possibilities for disequilibrium in the U-238 decay sequence, and since these will be discussed later, we list in Table 4 the calculated count rates arising from each CY particle in the sequence. We also include in Table 2 the a count rates for 1 ppm U and 1 dpmlg Th-230 with complete Po-210 loss but otherwise in secular equilibrium. The numbers shown in Tables 2 and 3 for powder samples are 4- 8% higher than those in Huntley and Wintle (1981): the reason being the use of more recent range tables in the present calculation. The difference gives some indication of the uncertainties associated with calculated count rates.
CAN. J. EARTH SC'I. VOL. 23, 1986
962
TABLE 4. Calculated alpha particle count rates from 0.737 dpmlg of individual nuclides of the U-238 decay chain
Results Results from U and Th standards We have prepared and measured several glass discs of U and Th powder standards. The resulting count rates are compared with calculated ones in Table 5. For the three thorium standards the agreement is satisfactory except for the slow-pair count rate of NBL-106. In the case of the uranium standards, the situation is complicated by expected radon loss and the possibility of polonium loss during fusion. Radon loss is dealt with most simply by delaying measurement until at least 3 weeks after fusion so that secular equilibrium is established. This was done for all the standards of Table 5, but even so the measured count rates were about 10% less than the calculated ones. Agreement is obtained, however, if it is assumed that Po-210 is lost during fusion. To test for loss of Po-210 we have measured the count rate versus time after fusion for two standards. A thorium standard served as a control and showed no change (11%), as expected. The uranium standard, BL-3 (see Table 5), however, showed an increase with time, corresponding to 70 f 15% Po-210 loss. We have used this figure in obtaining the calculated count rates shown in Table 5, although we recognize that some variation from sample to sample may be expected. Additional evidence for the correctness of the count rates was obtained by observing the count rate versus time for a uranium standard over the month required for the Rn-222, Po-2 18, and Po-2 14 to return to equilibrium with a half-life of 3.824 days.
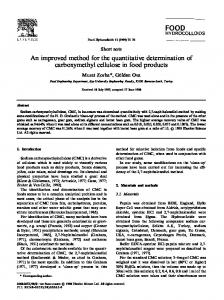
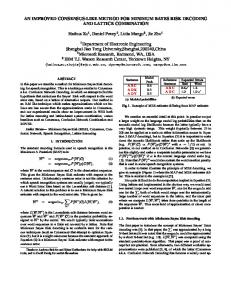
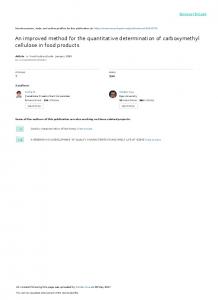
0.055 for the U/Th ratio of deep-sea sediments containing less than 60% CaC03 (Heye 1969). The count-rate conversion factors given in Tables 2 and 3 were used, and we have assumed 70% Po-210 loss. The calculations were performed in the thick-source limit, in which the sample is assumed to be thicker than the largest a particle range. Increasing the thickness over this value causes no change in the count rate. The largest a particle range is 12.8 mg/cm2 (for Po-212); thus any solid sample must be at least 50 pm thick. One should note that half of the alpha particles emitted originate less than 2 mg/cm2 ( - 7 pm) from the surface and that serious error would result if the outer few micrometres of the sample were not representative of the bulk. The results for seven of the samples from Discovery 9940K, previously counted as powders and now made into glass with a 1:l sample/flux ratio, are shown in Table 1 and Fig. 1. The U contents measured by a spectrometry (range 1.4 -2.6 ppm) were used in deriving the Th-230 excess values. The resulting Th-232 and Th-230 excess contents are in good agreement with the a spectrometric results, the major disagreement found with powder samples having been eliminated. The Th-232 values, while individually satisfactory, are on average about 14% too low, however. The results for three other cores, 10400/8K, 10164/5BX, and L13-80 NP G6, are shown in Figs. 2, 3, and 4, respectively. For all four cores there is generally good agreement between the a counting and a spectrometric Th-230 excess results except in the top 10-20 cm; here the a counting yields erroneously low Th-230 excess because the deficit of Ra-226 has not been taken into account. A method of dealing with this is described in the next section. For core 10400/8K (Fig. 2), both methods show a marked break in the profile in the 45 -60 cm interval because of the presence of a coarser grained turbidite in an otherwise pelagic clay sequence. The Pa-231 a counting results yield a sedimentation rate similar to that derived from the a spectrometric results over the top 45 cm. In core 10164I5BX (Fig. 3), the Th-230 excess a counting results on samples deeper than 15 cm are in good agreement with those obtained by a spectrometry and yield an identical sedimentation rate. The Pa-231 excess values are also concordant with the results from a spectrometry and yield a similar sedimentation rate. Finally, the limited data obtained on core L13-80 NP G6 (Fig. 4), a North Pacific red clay core (see Kadko 1985), are also satisfactory .
Results from deep-sea cores We have obtained a counting results on four pelagic sediment cores for which we have also determined the Th-230 excess by a spectrometry. In each case, measurements were made at least 3 weeks after casting the disc in order to allow the radon to return to equilibrium. In two cases (cores 1040018K and 10164/5BX), the a counting measurements were carried out blind, i.e., without a prior knowledge of the a spectrometric results. The details of the method used to convert the measured counts to Th and U contents and Th-230 excess and Pa-231 excess have been described by Huntley and Wintle (1981). It involves allowances for random pairs and requires an independent estimate of the detrital uranium content. Where no measurement is available, we use an average value of 0.180
Ra-226 dejcit It is well known that in the top 10-20 cm of many deep-sea sediment cores there is a Ra-226 deficit of up to 70% (Broecker 1974; Cochran and Krishnaswami 1980), and this we believe led to the erroneously low Th-230 excess values deduced for such samples above. We describe now a method for determining Ra-226 contents and hence more accurate Th-230 excess contents. When a sample is fused all the Rn-222 is lost. Subsequently the decay of Ra-226 into Rn-222 returns the Rn-222 to secular equilibrium, along with the short-lived daughters Po-2 18 and Po-214; the return is dominated by the 3.82 day half-life of Rn-222. The a count rate increases as these three isotopes return to secular equilibrium, and this increase can be used to calculate the Ra-226 content using the count rates listed in
ol
Can. J. Earth Sci. Downloaded from www.nrcresearchpress.com by Renmin University of China on 05/28/13 For personal use only.
Nuclide U-238 U-234 Th-230 Ra-226 Rn-222 PO-218 PO-214 Po-210 Total
Half-life
count rate (Ms-' cm-')
1: 1 2: 1 Powder fluxlsample fluxlsample
4.47x lo9 years 2.48 x lo5 years 7.5 X lo4 years 1.6 x10³ years 3.824 day 3.05 min 162 ps 138.4 day
NOTE:This amount corresponds to 1 ppm U or 0.993 ppm U-238 in secular equilibrium.
-
963
HUNTLEY ET AL.
TABLE5. A comparison of calculated and measured count rates of some uranium and thorium standards prepared as glasses using the lithium tetraborate lithium carbonate sodium nitrate flux
+
Can. J. Earth Sci. Downloaded from www.nrcresearchpress.com by Renmin University of China on 05/28/13 For personal use only.
NBL- 106 2: 1
NBL-108 2: 1
Stated U content Stated Th content Total count rate Calculated (ks-' ~ m - ~ ) Measured (ks-I ~ m - ~ ) Slow-pair rate Calculated (Ms-' ~ m - ~ ) Measured (Ms-' ~ m - ~ ) Fast-pair rate Calculated (Ms-' ~ m - ~ ) Measured (Ms" ~ m - ~ )
+
DL-la 1:l
DL-la 2: 1
116f 3 pprn 76 f 4 pprn
116f3 pprn 76 f 4 pprn
7.4f0.2 7.1f0.1
4.78f0.12 4.65k0.04
65.7k3.5 55f13
42k2 41+6
15.8k0.4 17f4
10.2k0.3 7.5k1.7
BL-2 2: 1 0.453 fO.005% 16f 4 pprn 154f3 149f1
BL-3 2: 1 1.02~0.01% 15f 6 pprn 347 +_6 334f3
9f2
8k3
397 k 4 390 f 37
893k9 1060f350
-
-
All numbers are 95% confidence limits. Calculated values are based on the stated U and Th contents and the conversion factors given in Tables 2 and NOTES: 3. The measured pair count rates are given after subtraction of random and cross pairs. The r values were 0.819 and 0.789 for the slow- and fast-pair counters, respectively. The measured values are for two samples each of NBL-106, DL-la(1: I), and BL-2; the results were statistically indistinguishable and thus were averaged; for the other three, one sample of each was made. ks = lo3 s; Ms = lo6 s.
depth, cm
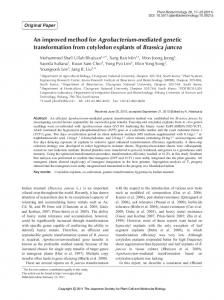
FIG. 1. Comparison of Th-230 excess contents obtained by a spectrometry and a counting for samples from core Discovery 9940K (34O10.8'S; 09"57.8'E, 4975 m water depth). The a counting data were processed using U contents from a spectrometry and assuming 70% Po-210 loss. Error bars in all figures are f l a .
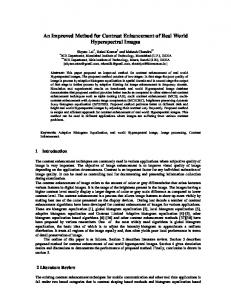
Table 4. The count rate immediately after fusion can then be used to calculate the Th-230 excess. We have tested these ideas on two samples and found these expectations fulfilled. The results for one sample (1040018K 10-12 cm) are now described in detail. The count rate vs. time after fusion is shown in Fig. 5. The exponential fit to the data shows the increase to be 820 f 30 Ms-' cm-'. From Table 4 the Rn-222, Po-218, and Po-214 give a combined count rate
depth, cm
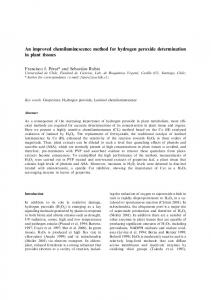
FIG.2. Comparison of Th-230 excess contents obtained by a spectrometry and a counting for samples from core 1040018K (2S042.4'N, 30°57.7'W; 6044 m water depth). Also shown are Pa-231 excess contents obtained by a counting. The a counting data were processed using Heye's (1969) UITh ratio and assuming 70% Po-210 loss. The a spectrometry data are from Colley et al. (1984).
of 54.8 Ms-I ~ m per - pprn ~ U, (uranium equivalent). Thus we deduce the Ra-226 content of the glass to be 15.0 0.5 pprn U, or 11.0 0.4 dpmlg. From the exponential fit the count rate immediately after fusion is deduced to be 772 f 35 Ms-' cm -'. From the a! counting data we calculate the following contributions:
+
+
CAN. J. EARTH SCI. VOL. 23, 1986
50
o,v
a' spectrometry
O , A a' countlng
n
@\
20
Th-230 excess 10
*-*\ 048cm/ia ++ +$-m
-
4-
Can. J. Earth Sci. Downloaded from www.nrcresearchpress.com by Renmin University of China on 05/28/13 For personal use only.
m T
5
-
2
-
dprn/g
0
1
0
I
I
200
I
1
I
400
I
ks
tlrne after casting , Pa-231 excess
I
600
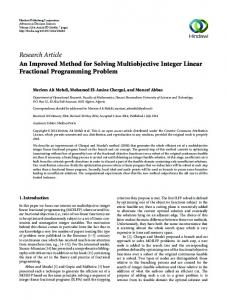
FIG.5. Alpha count rate vs. time after casting for sample 1040018K 10- 12 cm showing the effect of the Rn-222 Po-218 Po-214 buildup. From the increase the Ra-226 content can be calculated. The area of this 2: 1 glass sample was 5.7 cm2. The solid line is an exponential fit to the data using the 3.82 day half-life of Rn-222.
+
0 5
+
I\
and the dilution factor of 2.91 (glass mass / original sample 12 dpmlg. This is in mass), leads to a Th-230 excess of 60 quite satisfactoly agreement with the a spectrometly result of 52.1 f 2.4 dpmlg (see Fig. 2). The result for sample L13-80 NP G6 8 -9 cm, estimated in the same way, is shown in Fig. 4 and is also in good agreement.
+
FIG. 3. As Fig. 2 for core 1016415BX (26"04.9'N, 60°24.7'W; 5613 m water depth). The (Y spectrometry data are from Thomson (1982).
spcclromelry CY countlng
(Y
Th-230 excess
50 Ra-226 measurement
dpm/g 20
-
\,P
10-
0.085 crn/ka
,
50
'
20
10
depth,
30
cm
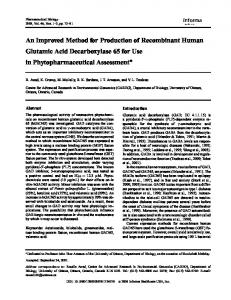
FIG. 4. As Fig. 2 for core L13-80 NP G6 (34"07'N, 143"33'W; 5500 m water depth; see Kadko 1985).
-
Th-232 (complete chain) Pa-231 excess (complete chain) Total Ra-226 alone Total Po-210 alone Detrital U-238, U-234, Th-230 Detrital U-235 (complete chain) Total
169+26 76k13 157+ 5 57+29 28+ 4 5& 1 492 +42
The remainder, 280 $ 55 Ms-' ~ m - must ~ , be due to the Th-230 excess, which, using the conversion factor of Table 4
Discussion The procedure we have devised for obtaining the various radionuclide contents using a counting is simple and straightforward. A sample is fused with a flux, cast as a glass disc, stored for 3 weeks, and then counted for a few days. If the Ra-226 content is required, then the count rate versus time after casting must also be measured. The various radionuclide contents are then calculated from the total, fast-pair, and slowpair count rates using the tabulated conversion factors and making the appropriate assumptions about the uranium content and polonium loss. We regard the results obtained to be satisfactory and adequate for obtaining sedimentation rates. The results are not yet, however, as precise as those of a spectrometly, which in contrast requires much more sample preparation. The accuracy of a counting appears to be mainly limited by counting statistics and uncertainties in the conversion factors; improvements in both are possible. The glass samples had areas typically of 5 - 10 cm2and were counted for several days each. A significant improvement in the statistical errors would be effected if much larger samples, say of 50 cm2, could be prepared, even at the expense of more dilution. This should be possible with a more sophisticated sample preparation procedure. The conversion factors from count rates to isotope contents used in the a -pairs method described here and in Huntley and Wintle (1981) are calculated from a! particle range tables; i.e., there have been no adjustable parameters. The differences between the two sets of ranges used in the present and earlier work suggest an uncertainty of at least 5 % . The agreement between the measured and calculated count rates suggests an accuracy of 3 % . The situation is not as satisfactory for the pair
Can. J. Earth Sci. Downloaded from www.nrcresearchpress.com by Renmin University of China on 05/28/13 For personal use only.
HUNTLEY ET AL.
count rates. This work and other comparisons we have made indicate that the Th-232 contents evaluated from pair counts are about 10% too low; with a Th-232 content of 15 ppm this will lead to an overestimate of the Th-230 excess by 0.4 dpmlg. Use of Heye's (1969) U/Th ratio to estimate U contents should lead to an additional 0.25 dpmlg overestimate. A comparison of U contents evaluated from a counting in this way with those from a spectrometry supports these estimates. The uncertain extent of Po-2 10 loss introduces an error that may be significant. If no Po were lost, as opposed to the 70% loss figure used, the evaluated Th-230 excess figures would be reduced by about 10%. A slight improvement in the accuracy of the results would occur if the uncertainty as to the extent of Po-210 loss were removed. It is clear that the addition of sodium nitrate to the flux did not achieve the desired objective. A strategy that ensures 100% Po-210 loss would appear to be preferable. An additional potential problem with diffusion of U-series nuclides in pelagic clays is the observation that the 234U/238U activity ratio is often less than unity (see Ku 1965). In the present context, however, it can be shown that this leads to a negligibly small effect. The motivation for the present work has been the desire to obtain reliable Th-230 excess contents and derive sedimentation rates from them. We have found concordant Th-230 excess values are generally obtained in core samples deeper than 20 cm below the surface. Hence, so long as a sufficient number of samples are counted below this level, reliable sedimentation rates can be obtained even without the Ra-226 determination. In addition, the determination of Pa-231 excess values (where radium diffusion is not a problem) concurrently with the Th-230 excess determination by the a -pairs method allows a check on sedimentation rate determinations by means of Th-230 measurements. In the methods adopted here for sedimentation rate determinations, Th-230 and Pa-231 excess measurements are routinely made on all samples so that greater confidence can be placed on any one of the individual determinations. While the thrust of the work has been to obtain radionuclide data on deep-sea cores, we should point out that the a counting method is also of value in the much simpler case of Th and U determinations in terrestrial samples. Here the slow-pair count rate is used to determine the Th-232 content. This is then used to determine the Th contribution to the total count rate and the remainder used to calculate the U content.
Conclusion Thick-source a counting of glass samples is a simpler, though less precise, alternative to a spectrometry for the determination of various radionuclide contents of deep-sea sediments. The preparation of samples in the form of a glass has had the desired effect of eliminating radon loss and also permits a measurement of the Ra-226 content and thus the extent of disequilibrium at this point in the U-238 decay chain.
Acknowledgments Sigma Chemicals of Balcatta, Western Australia, provided prefired and ground flux used for the G6 samples. We thank David Kadko for providing Th-230 excess values for core G6 prior to publication, and we thank David Piper for the core G6 subsamples. The technical assistance of J. Kirkey and help-
965
ful comments on the manuscript by G. W. Berger and D. I. Godfrey-Smith are gratefully acknowledged. This research was supported by the Natural Sciences and 'Engineering Research Council of Canada. M. J. 1978. Radon loss evaluation by alpha counting. AITKEN, PACT, 2, pp. 104-114. 1985. Thermoluminescence dating. Academic Press, London, UK. AKBER, R. A., HUTTON, J. T., and PRESCOTT, J. R. 1985. Thick source alpha counting using fused glass discs: corrections for loss of radon and polonium. Nuclear Instruments & Methods, A234, pp. 394-397. BERGER, G. W., HUNTLEY, D. J., and STIPP,J. J. 1984. Thermoluminescence studies on a I4C-dated marine core. Canadian Journal of Earth Sciences, 21, pp. 1145- 1150. BOWMAN, S. G. E. 1983. Alpha particle ranges in pottery. PACT, 6, pp. 61 -66. BROECKER, W. S. 1974. Chemical oceanography. Harcourt Brace Jovanovich, New York, NY, 214 p. CHERRY, R. D. 1963. The determination of thorium and uranium in geological samples by an alpha-counting technique. Geochimica et Cosmochimica Acta, 27, pp. 183- 189. COCHRAN, J. K., and KRISHNASWAMI, S. 1980. Radium, thorium, uranium, and Pb-210 in deep-sea sediments and sediment pore waters from the north equatorial Pacific. American Journal of Science, 280, pp. 849- 889. COLLEY, S., THOMSON, J., WILSON, T. R. S., and Hrccs, N. C. 1984. Postdepositional migration of elements during diagenesis in brown clay and turbidite sequences in the north east Atlantic. Geochimica et Cosmochimica Acta, 48, pp. 1223- 1235. EAKINS, J. D., and MORRISON, R. T. 1978. A new procedure for the determination of lead-210 in lake and marine sediments. Intemational Joumal of Applied Radiation and Isotopes, 29, pp. 531 -536. HEYE,D. 1969. Uranium, thorium, and radium in ocean water and deep-sea sediments. Earth and Planetary Science Letters, 6, pp. 112-116. HUNTLEY, D. J., and WINTLE, A. G. 1978. Some aspects of alpha counting. PACT, 2, pp. 115-119. 1981. The use of alpha scintillation counting for measuring Th-230 and Pa-231 contents of ocean sediments. Canadian Journal of Earth Sciences, 18, pp. 419-432. JENSEN, H. E., and PRESCOTT, J. R. 1983. The thick-source alpha particle counting technique: comparison with other techniques and solutions to the problem of overcounting. PACT, 9, pp. 25 -35. KADKO, D. 1985. Cenozoic sedimentation and metal deposition in the North Pacific. Geochimica et Cosmochimica Acta, 49, pp. 651-661. Ku, T. L. 1965. An evaluation of the 234U/238U method as a tool for dating pelagic sediments. Joumal of Geophysical Research, 70, pp. 3457-3474. KULP,J. L., HOLLAND, H. D., and VOLCHOK, H. L. 1952. Scintillation alpha counting of rocks and minerals. Transactions, American Geophysical Union, 33, pp. 101- 113. MCCORKELL, R. H. 1986. Radon emanation rate studies: interlaboratory reference materials and the effects of powdering and pelletizing. Canadian Mining and Metallurgical Bulletin. (In press.) NORRISH, K., and HUTTON, J. T. 1960. An accurate X-ray spectrographic method for the analysis of a wide range of geological samples. Geochimica et Cosmochimica Acta, 33, pp. 431 -453. PRESCOTT, J. R., and JENSEN, H. E. 1980. Low-level thorium and uranium determination for thermoluminescent dating. Atomic Energy in Australia, 23, pp. 26-32. TANNER, A. B. 1964. Radon migration in ground water: a review. In The natural radiation environment. Edited by J. A. S. Adams and W. M. Lowder. University of Chicago Press, Chicago, IL, pp. 161- 190.
966
CAN. J. EARTH SCI. VOL. 23, 1986
Can. J. Earth Sci. Downloaded from www.nrcresearchpress.com by Renmin University of China on 05/28/13 For personal use only.
THOMSON, J. 1982. Total dissolution method for determination of the cr-emitting isotopes of uranium and thorium in deep-sea sediments. Analytica Chimica Acta, 142, pp. 259 -268. WINTLE,A. G., and HUNTLEY,D. J. 1980. Thermoluminescence dating of ocean sediments. Canadian Journal of Earth Sciences, 17, pp. 348-360.
-1982. Thermoluminescence
dating of sediments. Quaternary Science Reviews, 1, pp. 31 -53. ZIEGLER,J. F. 1977. Helium: stopping powers and ranges in all elemental matter. Vol. 4. The stopping and ranges of ions in matter. Pergamon Press, New York, NY.