An Improved and Fast Methodology for Automatic Detecting and Counting of Red and White Blood Cells Using Watershed Transform Ana Carolina Borges Monteiro1, Yuzo Iano1 and Reinaldo Padilha França1 1- University of Campinas – UNICAMP, Campinas, Brazil
[email protected] Abstract — The necessity for practicality, reliability, and agility has stimulated the creation of new tools for the health area. The blood cell counting is an important exam that helps to diagnose various diseases besides to be an important field of study in biomedical engineering. Currently, the red blood cells count and white blood cells have been performed by the automated method. However, still does not dispense the use of the manual method, through the preparation of blood smears, in specific cases or only for confirmation of diagnostics. In the last years, MATLAB® software has been used to develop algorithms to facilitate cell counting. Thus, the present work implements an algorithm based on Watershed transform, where its results show a better performance of 34% in execution time in comparison with other works developed, as well as a computational performance of 1.98 seconds, as also showing high reliability in your digital count. Keywords — RBC; WBC; Watershed transform. Introduction The human blood consists of plasma and cells: red blood cells, leukocytes and platelets. The erythrocytes are anucleated cells with biconcave disc-shaped, being responsible for the transport of oxygen by the organism. The erythrocytes are also called red blood cells and measure under normal conditions average 7μm of diameter [1, 2]. The red blood cell count (RBC) is express from 4.0 to 6,0 x 10⁶/mm³ blood, according to age and gender of the patient [3, 4]. When there is a decrease in the number of red blood cells (erythropenia), blood loss or anemia is suspected. In turn, the increase in the number of red blood cell (erythrocytosis) may suggest polycythemia, which may to cause stroke and infarction [5]. The leukocytes are also called white blood cells, being the body's defense cells and, the counting WBC vary from 3.500 to 10.500 leukocytes/mm3 of blood, being an increase in this parameter (leukocytosis) suggestive infections or acute or chronic inflammations or even invasion by external etiological agents,
helminths, allergenic agents, bacterial infections, viral infections, among others [2, 5, 6]. Thus, many methodologies have been developed in the last years to facilitate and solve problems as described, with the use of MATLAB® software, as can be observed in [6, 7, 8, 9, 10, 11, 12]. In these studies, the extraction and counting is based on the morphology of the blood cells through the distance found between each pixel, or through the Hough transform realizing the red cell counting through the detection of geometric characteristics, to find the circular center of the image, or through segmentation of erythrocytes, in order to determine the cell boundary, among others. However, some techniques result in poor performance and low accuracy when applied to smears with large agglomerates of cells. Blood cell counts can be done by automated or manual methods. The automated methods are faster, however more expensive, because may be based on the principles of impedance pulses, flow cytometry, absorbance, among others [13, 14]. However, the existing automatic methods do not annul the use of manual methods, when the equipments are unable to analyze blood samples, in cases of children under 5 years old and patients upper 75 years old; cancer patients; patients in grave condition; patients with leukocytosis or leukopenia, cases of color variations, size and shape of red blood cells, among others [13]. The manual methods are cheaper, however more time consuming, because require a confection of blood smear [2, 13]. Only the final portion of the lamina is used to perform the count, because the anterior portions have clustered and/or overlapping cells, preventing a reliable count. Besides of counts and observations of blood cell morphologies, health professionals perform calculations to conclude the diagnoses, which generally consider the total counts of RBC and WBC [2, 5]. The complexity of medical images requires systematic segmentation, which be accurate and presents a reliable method [15]. The implementation of digital image processing of blood cells helps in clinical decisions, through of obtaining results in a way faster, easier and more agile, besides of the reduction of costs with the acquisition of equipment.
Thus, the Watershed transform proposes a morphological approach to the problem of image segmentation and can be applied in several areas of knowledge. This technique interprets the images where each pixel corresponds to a position and the levels gray relative to each of these pixels determine their altitudes, being a powerful tool found to solve the problems approached in this work [3, 10, 14, 15, 16, 17]. The algorithm presented in this paper have the objective of reaches all these points, solving in less processing time and computational cost associated the high precision in the detection in both RBC and WBC, as well as a better execution performance in comparison to other works as [4, 6, 7, 8, 9, 12, 18, 19].
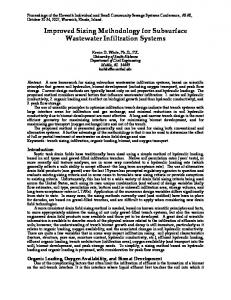
Figure 01 – Diagram representing the algorithm
Material and Methods The algorithm performs the counts of red and white blood cells through a digital image of a peripheral blood smear. The processes of counting and differentiating blood cells are performed based on the recognition of cell nuclei, size differentiation in pixels and color intensity present in each cell type analyzed. Following the segmentation and image processing logic, the algorithm is executed, with objectives of precision and computational costs. The experiments were conducted by blood cells smear, stained and analyzed under an optical microscope under the objective lenses of 40 and 100, resulting in an increase of the image of 400 and 1000 times, respectively. Posteriorly, there was the acquisition of digital images of the fields of the lamina containing red blood cells without agglomerations and presence of leukocytes. The image processing involves some steps such as filtering and treatment of the image, in terms of quality for the next steps of the algorithm, the conversion of RGB images to gray scales and binary scales, having with the goal to solve the illumination problems normally found in images of optical microscopy. In this step, morphological operations were made followed of the use of the Watershed transform, which involves steps such as binary erosion, dilation, opening, closing, and reconstruction of the image [3]. The Watershed transform acts on the processing, calculation, and recognition of distances between nuclei, avoiding possible erroneous counts of overlapping cells. The logic of the algorithm is represented in the diagram of Figure 01 and its execution in Figure 02.
Figure 02 – Execution of the algorithm on sample Results and Discuss In this section, the results will be presented on the evaluations of the algorithm in processing time and the time spent for execution. To obtain the same were performed executions of each command used, on physical machines with different hardware configuration, consisting of an Intel Core i5 processor and 8GB RAM, and another with an Intel Core i3 processor and 4GB RAM. The tic, toc and sim commands were used via the command line at the MATLAB prompt, which measures how long time the algorithm spends on its execution (in seconds). Was also used the cputime command, which returns the total cputime (in seconds) used by the algorithm from the moment was started. The tic and toc function measures the elapsed time the algorithm spend, that is, its execution time. The cputime function calculates its computation time. So together, show the performance and efficiency of the algorithm. Thus, the first execution of the algorithm was analyzed on the described commands, because it is in first execution that the variables are allocated and the memory reserved for the execution of the same, referring to Figures 03 and 04. For this study, 18 digital images were used, being 10 images for RBC and 8 images for WBC. These samples were submitted to manual and digital counts by the algorithm, having better accuracy than [4, 6, 7, 8, 9, 12, 18, 19], as shown in Figures 05 and 06.
those found in the study [18], where in its first execution, there was a 34% improvement in performance, and 42% in the following ones, corresponding to 1.98 seconds and 1.74 seconds, respectively, also consisting of the average time over all samples. These results are presented in Figure 04.
Figure 03 – Execution time spent by the algorithm (i5)
Figure 06 –WBC manual and by algorithm
Figure 04 – Execution time spent by the algorithm(i3) Aiming at the applicability of this work, the executions of the proposal were performed on machines with different hardware, because both possibilities are possible in the daily life of a laboratory. In this way, according to [18], an execution time of 3 seconds per sample was obtained, whereas in the present study a better performance of 15.3% was obtained in its first execution and 34% in the following ones, which correspond to 2,54 seconds and 1.98 seconds, respectively, being the average time of the first execution of all the samples. These results refer to executions performed on an Intel Core i5 machine, according to the data presented in Figure 03.
Were selected 4 images of the total used in this work, with the objective of analyzing the performance of the algorithm on the different characteristics that each of them has, for example, the size, the quantity of red and white blood cells, not being the first execution for this case, and so, detailing further the performance of the algorithm on the samples. The results on this optics are presented in Figures 07 and 08.
Figure 07 – Performance of the algorithm (i5)
Figure 05 – RBC manual and by algorithm The executions performed on the Intel Core i3 machine also demonstrated satisfactory results than
Figure 08 – Performance of the algorithm (i3)
Was noted in Figures 07 and 08, that in machine i3, the computation time was higher, such factor is derived that the i3 processor has 2 cores less than the i5. Besides to the fact, the i5 machine has twice as much RAM. However, even with these differences, the results are still satisfactory regarding the performance of the proposal of this work. The executions displayed in Figures 07 and 08 were compared with [10], where the Table 1 shows the results over better performance obtained. Images 1 2 3 4
Ref. [10] 12,72’’ 2,61’’ 2,72’’ 4,76’’
Proposal i3 i5 84,54% 86,57% 48,87% 44,01% 32,18% 51,26% 66,93% 75,70%
Table 1: Performance Improvement Conclusions In all the scenarios analyzed and on all samples, the algorithm developed in this work obtained better execution results when compared to other works performed, also solving the problems encountered during the counts of red blood cells and leucocytes, succeeding in a satisfactory performance, both in efficiency and reliability, which are paramount during the conclusion of a laboratory diagnosis. The good performance of the proposal on the machines with different hardware configurations concludes that the algorithm is feasible for the different realities of the laboratories. The area of health is a broad field directly linked to medical diagnoses through images, so the proposal of this study also provides that the results suggestive of more serious pathologies can be stored in digital files for future consultations, dispensing the creation of a physical space, in this case for hospitals. The development of this efficient algorithm for counting red and white blood cells, using current techniques of image processing and segmentation, contributes to medical studies. References [1] Monteiro, A. C. B.; et al., Sickle Cell Anemia, A
Genetic Disorder Characterized By The Change In Shape Of Red Blood Cells. Saúde em Foco, Edição nº: 07/Ano: 2015. [2] Turgeon, M. L., Clinical hematology theory and procedures. 4ª ed. Philadelphia: Lippincott Williams and Wilkins, 2004.
[3] Mohammed, E. A.; et al., Chronic Lymphocytic
Leukemia Cell Segmentation From Microscopic Blood Images Using Watershed Algorithm And Optimal Thresholding. 26th IEEE (CCECE), 2013. [4] Sahastrabuddhe, A. P.; Ajij, S. D., Blood group Detection and RBC, WBC Counting: An Image Processing Approach. International Journal Of Engineering And Computer Science ISSN: 2319-7242 Volume 5 Issue 10 Oct. 2016. [5] Bernadette, F.; Rodak, G. A.; Fristma, K. D., Hematology – Clinical principles and aplications. New York: Elsevier, 2015. [6] Mazalan, S. M.; Mahmood, N. H.; Razak, M. A. A., Automated Red Blood Cells Counting in Peripheral Blood Smear Image Using Circular Hough Transform. First International Conference on Artificial Intelligence, Modelling & Simulation, 2013. [7] Arivu, S. K.; Sathiya, M., Analyzing blood cell images to differentiate WBC and counting of linear & non-linear overlapping RBC based on morphological features.Elixir Comp. Sci. & Engg. 48 (2012) 94109413. [8] Guitao, C., Cai, Z., Ling, L.;Jun, D., “Detection of Red Blood Cell in Urine Micrograph”. The 3rd ICBBE. 2009. [9] Heidi, B., Dale, T., Sriram, K.;Douglas, T. S.; Improved Red Blood Cell Counting in thin Blood Smears. Proceedings of ISBI, 2011. pp.204-207. [10] Hemant, T.; Sexena, S.; Vadak, N., Segmentation Using Morfological Watershed Transformation Counting Blood Cells. International Journal of Computer Applications & Information Technology Vol. 2, Issue III Apr-May 2013. [11] Kaur, R.; Kaur, H., Comparative Analysis of White Blood Cell by Different Segmentation Methods Using Knowledge Based Learning. International Journal of Advanced Research in Electrical, Electronics and Instrumentation Engineering (An ISO 3297: 2007 Certified Organization Vol. 3, Issue 9, September 2014. [12] Mogra, M.; Srivastava, V., A Comprehensive Review of Analysis of Counting Blood Cells Using Different Image Processing Algorithms. International Journal of Engineering Science Invention ISSN (Online): 2319 – 6734, ISSN (Print): 2319 – 6726 www.ijesi.org Volume 3 Issue 6 ǁ June 2014 ǁ PP.29-31. [13] Failace, R.; et al., Hemograma, Manual De Interpretação. 5ª. Porto Alegre: Artemed, 2009. [14] Sobhy, N. M.; Salem, N. M.; Dosoki, M., A Comparative Study of White Blood cells Segmentation using Otsu Threshold and Watershed Transformation. Journal of Biomedical Engineering and Medical Imaging. Society Science and Education. United Kingdom. V:3, issue 3. [15] Cuevas, E.; et al., A Comparative Study of White Blood cells Segmentation using Otsu Threshold and Watershed Transformation. Hindawi Publishing Corporation.Computational and Mathematical Methods in Medicine. Volume 2013, Article ID 137392. [16] Vincent, L.; Soille, P., Watersheds in digital spaces: An efficient algorithm based on immersion simulations. IEEE Transactions on Pattern Analysis and Machine Intelligence, 13(6):583–598, 1991. [17] González, R. C.; Woods, R. E., Digital Image Processing. Prentice Hall, 2 edition, 2002. [18] Mahmood, N. H., Mansor M. A., “Red blood cells estimation using hough transform technique” Signal & Image Processing: An International Journal (SIPIJ) Vol.3, No.2, April 2012. [19] Soltanzade, R.,et al. “Classification of Three Types of Red Blood Cells in Peripheral Blood Smear Based on Morphology. Proceedings of ICSP, 2010.