Journal of Microscopy, Vol. 224, Pt 3 December 2006, pp. 322– 327 Received 8 May 2006; accepted 19 July 2006
An improved method for angular-resolved characterization of the optical anisotropy of pyrolytic carbon Blackwell Publishing Ltd
B . R E Z N I K *, D. G E RT H S E N * & E . B O RT C H AG OV S K Y † *Laboratorium für Elektronenmikroskopie, Universität Karlsruhe (TH), 76128 Karlsruhe, Germany †Institute of Semiconductor Physics, prospekt Nauki 45, Kiev, 03022, Ukraine
Key words. Carbon–carbon composites, image processing, polarized light microscopy, pyrolytic carbon.
Summary A description is given of an experimental technique that improves the accuracy of the measurement of light extinctions by polarized light microscopy from deposits of pyrolytic carbon. The measurements were performed using a specially developed digital photometric image-analysis procedure providing high spatial and angular resolution of light extinctions over the reflecting optical domains with a high dynamic range of grey levels. The digital image acquisition and data processing are illustrated using circular-shaped pyrolytic carbon matrices of infiltrated carbon fibre felts and planar layers of pyrolytic graphite. The calculated value of the extinction angle for single crystalline graphite is discussed with respect to the experimental values for pyrolytic carbon with different degrees of optical anisotropy. Practical requirements for the accuracy of the method are discussed. Received 8 May 2006; accepted 19 July 2006
Introduction Pyrolytic carbon is a graphite-like material that is obtained by low-temperature pyrolysis of hydrocarbons (Fitzer & Manocha, 1998). This material is chemically similar to carbon fibres and is therefore used as a matrix component for fibre-reinforced composite materials. The physical and mechanical properties of carbon-fibrereinforced carbon matrix composites are determined in a significant way by the matrix texture, which is a measure for the degree of preferential orientation of the graphene layers with respect to a fibre/substrate surface. For example, the texture influences the thermal (Blanco et al., 2002), mechanical (Fitzer & Manocha, 1998) and optical properties (Oberlin, 2002). Accurate and reproducible techniques for texture degree characterization are therefore indispensable for the production Correspondence to: Dr B. Reznik. Tel: +49 (0) 7216083720; Fax: +49 (0) 7216083721; e-mail:
[email protected]
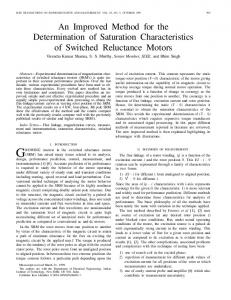
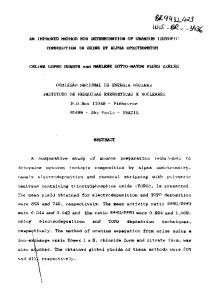
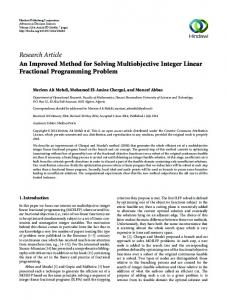
of material with desired characteristics. Texture characterization is also important to establish an understanding of the correlation between carbon formation processes and the resulting properties. Polarized light microscopy (PLM) is one of the techniques that is widely used in industry and basic research for a rapid texture characterization of pyrolytic carbon coatings (Oberlin, 2002). The technique relies on the correlation between the structural and optical anisotropy of pyrolytic carbon. The optical anisotropy is characterized by the extinction angle Ae, which is frequently determined by visual inspection by a human operator as illustrated by the following example. Figure 1 shows typical PLM micrographs of a polished section of an infiltrated carbon fibre felt that was studied previously (Reznik & Gerthsen, 2003). The carbon fibres are covered by a circular-shaped pyrolytic carbon matrix composed of two circular layers labelled 1 and 2 in Fig. 1(a). Under crossed polarizer and analyser Nicols (Fig. 1a), an extinction contour with the shape of a Maltese cross is observed within the circular layer labelled 2. This layer contains fibrous-shaped regions of different brightness that are considered in the following as optical domains. By rotation of the analyser, light quadrants located at an angle of 45° with respect to the Nicols axes (e.g. see the quadrant marked by the black arrow in Fig. 1a) are extinguished in Fig. 1(b). The angular analyser position, at which the selected quadrant is extinguished, is denoted as extinction angle Ae and is a measure of the optical anisotropy (Bourrat et al., 2000). The sample shown in Fig. 1 has been analysed by different operators in our laboratory during the past 7 years. The measured Ae values scatter largely between 17° and 23° giving a mean Ae value of 20 ± 2.2°. In theoretical calculations of the extinction angle Ae (Bourrat et al., 2000; Bortchagovsky et al., 2003; Pfrang & Schimmel, 2004) it is assumed that a circular-shaped pyrolytic carbon coating is composed of segments of uniaxial crystals of graphite (Fig. 2a). On this basis, the observed black Maltese cross (Fig. 1a) is explained as a result of the extinction of linearly © 2006 The Authors Journal compilation © 2006 The Royal Microscopical Society
O P T I CA L A N I S O T RO P Y O F P Y RO LY T I C CA R B O N
323
Fig. 1. Polarized light microscopy micrographs of a polished section of an infiltrated carbon fibre felt with insets showing Nicols positions. (a) Analyser is perpendicular to polarizer and the quadrant lying at about 45° (black arrow) is light; (b) analyser is apart from the 90° (angle Ae) and the quadrant lying at about 45° is extinguished.
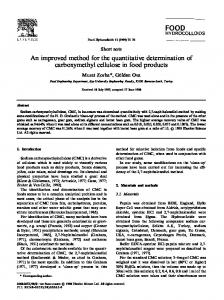
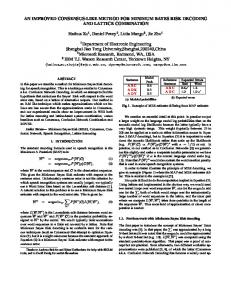
Fig. 2. Scheme of light extinction in a circular-shaped coating composed of (a and b) single crystals of graphite and (c) polycrystalline graphite in relation to the Nicols positions (insets). The dashed rectangle in (c) indicates the selected region of interest lying precisely at an angle of 45° with respect to the crossed Nicols.
polarized light in reflection if the light propagates exactly parallel (positions 3 and 7, Fig. 2a) or perpendicular (positions 1 and 5, Fig. 2a) to the optical axis (parallel to the [0001] direction) of the crystallite. Between the extinction positions the intensity of light increases to a maximum at an angle of 45° and the positions marked with even numbers in Fig. 2(a) appear bright. Alternatively, the reflected light intensity of a single crystal lying with its optic axis at an angle of exactly 45° can also be extinguished (or compensated) if the analyser is rotated (Fig. 2b). Using the Fresnel reflection coefficients given by Ergun (1967), Bourrat et al. (2000) calculated that the corresponding analyser position or the value of the extinction angle Ae for a graphite crystal is 16.4°. Later, Bortchagovsky et al. (2003) showed that the extinction angles for deposits with planar and circular shape have to be distinguished. Moreover, the phase shift between the complex Fresnel reflection coefficients should be taken into account. The calculated Ae value for a planar graphite deposit was refined to 17.9° whereas an ‘extinction angle’ of 27.4° was obtained for a hypothetical circular-shaped graphite (Bortchagovsky et al., 2003; Bortchagovsky, 2004). It was pointed out by Reznik et al. (2004) that the latter angle is a result of the coalescence of two intensity minima in the area lying around 45° with respect to the crossed Nicols. For this reason it was proposed to denote this angle as coalescence angle (Reznik et al., 2004). Consequently, for a circular deposit the main extinction minimum at an angle of 45° is difficult to detect by visual inspection (Bortchagovsky, 2004; Reznik et al.,
2004), which considers only a total darkening within a diagonal quadrant (Fig. 1). It can be concluded that Ae varies significantly for measurements performed by different human operators due to both the complex angular light extinction for circularshaped pyrolytic carbon deposits and different eye sensitivities. Recently, Vallerot & Bourrat (2006) measured light extinctions in infiltrated carbon fibre felts using a spectrometer coupled with a microscope. The measured extinction angles are also lower than these visually assessed angles (the maximum Ae value reaches 20°). Indeed, such an approach is useful in the analysis of the optical properties of circular-shaped pyrolytic carbon matrices. However, a precise and simple method based on the fast determination of the extinction angle in deposits with different morphology must be developed. We present here a novel method for the measurement of the extinction angle − applicable to circular and planar pyrolytic carbon deposits − that also improves the spatial and angular resolution compared with the conventional measurement procedure. The proposed experimental setup makes use of a digital camera and a specially developed interactive imageanalysis procedure that objectifies the determination of Ae. Materials and methods The proposed technique relies on the capture of PLM images by a digital camera system that contains a charge-coupled device detector. The dynamic range of a charge-coupled device is larger than the human eye, which provides a significant
© 2006 The Authors Journal compilation © 2006 The Royal Microscopical Society, Journal of Microscopy, 224, 322–327
324
B. REZNIK ET AL.
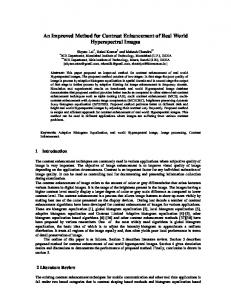
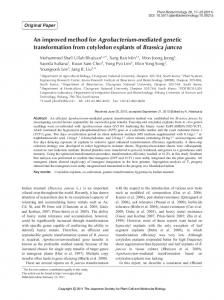
advantage for the measurement of light extinctions. For example, an 8-bit charge-coupled device camera distinguishes between 256 grey levels whereas the human eye can only distinguish less than one quarter of them (Galer, 2001). Moreover, the changes in grey levels can be angular resolved with high accuracy and speed. Extinctions of reflected light were measured using a digital JVC TK-C1380 (JVC, Fukuoka, Japan) video camera attached to a Leitz DM RX microscope (Leica, Wetzlar, Germany) equipped with a polarizer and a rotable analyser. The accuracy of the analyser setting was ±1°. A standard XY table was used. The 1/2-inch charge-coupled device detector provided a resolution of 440 000 [752(H) × 582(V)] effective pixels. The camera was computer-controlled through a PC computer (Intel Pentium IV, 2.8 GHz) with a Matrox Meteor Frame grabber (Matrox Graphic Inc., Quebec, Canada) and handling software (analysis, Soft-Imaging Software, Münster, Germany). This software includes a specially developed module for photometric analysis. A halogen lamp served as illumination source. The repeated measurement of light intensities from the same sample region yielded variations of less than 0.3%. A measuring procedure and image-analysis software were developed to allow a precise, interactive positioning of the region of interest (ROI) and evaluation of light extinctions. The procedure started with the acquisition of a live PLM image. In Fig. 3, the menu of the driving software interface (analysis software package, Soft-Imaging System) for the evaluation of the light micrograph is shown. The next step was the selection of an ROI lying at an angle of 45° with respect to the crossed analyser and polarizer (dashed rectangle, Fig. 2c). For this purpose a transparent template foil with marked 45° and 90°
positions was placed on the screen of the computer. The geometrical centre of the template was coincident with the sample area located on the optical axis of the microscope. The shape, size and angular position of the ROI were then defined interactively by the photometric module (arrow in Fig. 3a). ROIs as small as 1 × 1 µm2 can be selected. Using the template foil the angular position of the ROI can be adjusted with an accuracy of about ±1°. Next, the mean value of grey levels (light intensity) within the selected ROI was measured (Fig. 3b) as a function of the manually changed angular position of the analyser (Fig. 3c). The collected data were presented in the form of a table (Fig. 3d) containing values of analyser angles (column ‘Winkel’) and collected amount of grey levels (column ‘Grauwert’). Using these data, photometric plots of ‘grey levels vs. analyser position’ were obtained. The Ae value was determined as the analyser position at the minimum value of grey levels using origin-software© (Microcal Software, Northampton, USA). Specimens For the test of the experimental setup, pyrolytic carbon matrices of infiltrated carbon fibre felts and samples of pyrolytic graphite were studied comparatively. Carbon fibre felts had been infiltrated with high-textured (sample ‘composite 1’) and duplex (medium/high-textured) pyrolytic carbon matrix (sample ‘composite 2’). The samples composite 1 and composite 2 were studied previously in Reznik & Gerthsen (2003) and Reznik et al. (2003), respectively. Planar plates of pyrolytic graphite were purchased from GE Advanced Ceramics (GE Advanced Ceramics, Cleveland, USA). The pyrolytic graphite was derived from natural propane at low pressure and high temperature (1900–2200 °C). Thermal pyrolytic graphite was obtained by thermal annealing of the material around 2900 °C, which is near the theoretical density of graphite and exhibits a much higher texture degree of graphitic crystallites. Before the PLM measurements, the samples were mounted in epoxy resin and polished using an SiO2 paste with a 0.5-µm grain size in the final stage of the polishing procedure. Results and Discussion
Fig. 3. Driving software interface for the measurement of the extinction angle Ae including (a) selection of the shape and size of region of interest (ROI), (b) determination of the mean grey level within the selected ROI, (c) setting of the analyser angle (Winkel) and counting the mean grey level as a function of the analyser angle position, and (d) presentation of a table containing the analyser angle (column ‘Winkel’) and collected amount of grey levels (column ‘Grauwert’).
Polarized light microscopy micrographs of a polished crosssection of a pyrolytic graphite plate taken at different magnifications are presented in Fig. 4(a and b). Both images show elongated optical domains with optical axes that can be rotated within and tilted towards the sample surface (Fig. 2c). For this reason we defined an effective optical axis that is denoted as [0001]* axis. This axis was aligned parallel to the polarizer position if minimum intensity was achieved as shown schematically by segment 3 in Fig. 2(a). The microscope stage was then rotated at an angle of 45°. This sample position was used for further photometric measurements. Rectangularshaped ROIs were selected and adjusted at the 45° position by
© 2006 The Authors Journal compilation © 2006 The Royal Microscopical Society, Journal of Microscopy, 224, 322–327
O P T I CA L A N I S O T RO P Y O F P Y RO LY T I C CA R B O N
325
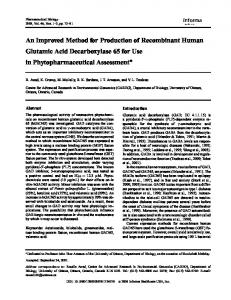
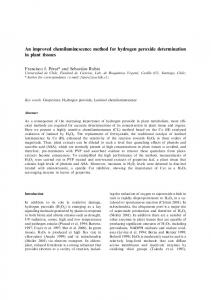
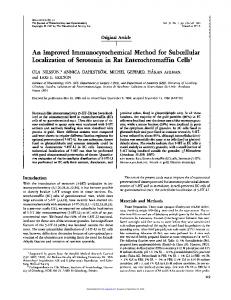
Fig. 4. (a and b) Polarized light microscopy micrographs of a polished cross-section of a pyrolytic graphite. (c) Photometric plots 1 and 2 acquired within region of interest (ROI)-1 and ROI-2 selected in (a) and (b).
Fig. 5. (a and b) Polarized light microscopy micrographs of a polished cross-section of a thermally annealed pyrolytic graphite. (c) Photometric plots 1 and 2 acquired within region of interest (ROI)-1 and ROI-2 selected in (a) and (b), respectively.
the photometric module. Note that these sections are a particular case of a circular-shaped coating, i.e. they correspond to a coating segment lying at about 45° with respect to the crossed analyser and polarizer Nicols (Fig. 1). In other words, the developed technique reduced the problem of coatings shaped differently by selecting a planar optical domain (Fig. 2c). Correspondingly, the technique eliminated any ambiguity in the determination of the extinction angle. Figure 4(c) shows typical photometric plots acquired within the selected ROIs. In both cases (Fig. 4c, curves 1 and 2), a well-developed extinction minimum was detected at an angle Ae that depended on the size of the ROI (10° for ROI-1 and 13° for ROI-2). The measured Ae values were significantly lower than the calculated value for single crystalline graphite (Bourrat et al., 2000; Bortchagovsky et al., 2003; Pfrang & Schimmel, 2004). This could be expected due to the orientation distribution of optical domains in the analysed regions, which reduced the optical anisotropy of the material. The measured Ae may be further reduced if the effective optical axis is tilted with respect to the sample surface, which has to be taken into account if Ae values from different samples are compared. The difference between the Ae values in ROI-1 and ROI-2 can be explained as follows. The larger ROI-1 contained a larger number of optical domains with a wider orientation
distribution of optical axes compared with ROI-2 (see also Fig. 2c), which resulted in a lower average anisotropy for ROI1 and consequently in a lower value for the extinction angle. The size of optical domains increases after high-temperature annealing (Fig. 5a and b). Correspondingly, the anisotropy (‘single crystallinity’) of the sample increases and therefore the Ae value extracted by different ROIs (Fig. 5c) was almost the same. In addition, a relatively flat region spreading from 12° to about 17° can be recognized in curve 2 (Fig. 5c). This behaviour can indicate that the effective optical axis [0001]* of the selected region is tilted with respect to the polished sample surface. However, this effect cannot be investigated in detail using a standard XY stage. A universal, goniometerequipped stage is required for this purpose. Nevertheless, based on the data presented in Figs 4 and 5 an important conclusion can be drawn. The developed photometric procedure of the angular measurement of light extinction was sensitive to the increasing crystallization degree of pyrolytic graphite. Figure 6 shows a PLM micrograph of a polished crosssection of the sample ‘composite 1’, which is also depicted in Fig. 1. Two regions were selected for analysis within end-on (ROI-1) and longitudinally (ROI-2) sectioned matrix regions. Both sections were equivalent from the point of view that the orientation of the effective optical axis aligned at an angle of
© 2006 The Authors Journal compilation © 2006 The Royal Microscopical Society, Journal of Microscopy, 224, 322–327
326
B. REZNIK ET AL.
Fig. 6. (a) Polarized light microscopy micrograph of a polished section of an infiltrated carbon fibre felt. (b) Photometric plots 1 and 2 acquired within region of interest (ROI)-1 and ROI-2 selected in (a).
Fig. 7. (a) Polarized light microscopy micrograph of a polished section of the infiltrated carbon fibre felt shown in Fig. 6(a). (b) Photometric plots A and B acquired within region of interest (ROI)-A and ROI-B selected in (a) and the image contrast plot (B − A)/ (B + A).
45° with respect to the orthogonal image coordinates. The difference between the Ae values in ROI-1 and ROI-2 was related to the orientation distribution of optical domains within the selected regions and different tilts of the effective optical axis with respect to the sample surface. The extracted Ae values (Fig. 6b) of 12° and 14° were lower than the coalescence angle of 20° ± 2.2° that was determined visually by the conventional procedure. The discrepancy of the results obtained by the visual and photometric technique for the circular-shaped morphology can be understood by the plots presented in Fig. 7. Plot A was acquired within ROI-A (corresponding to ROI-1 in Fig. 6a), whereas plot B was acquired within ROI-B orientated at an angle of 45° with respect to ROI-A. The curve (B − A)/(B + A) describes the image contrast (right-hand side Y-axis in Fig. 7b). The intensity of parabolic curve A exhibited a minimum around 12° whereas the intensity of curve B increased more rapidly up to 26°. The contrast [(B − A)/(B + A) in Fig. 7b] increased up to about 17° and saturated at a plateau of high contrast for analyser angles larger than 17°. The human eye is sensitive to contrast changes rather than to absolute values of brightness (Galer, 2001). For this reason, the main extinction minimum around 12° (curve A in Fig. 7b) cannot be recognized properly by a human observer who will have a false impression that the image within the ROI-A becomes darker for analyser angles > 12°. However, the image intensity did not further decrease at analyser positions above 12° (curve A in Fig. 7b). Instead, an increasing contrast up to an analyser angle of approximately 17° was observed [curve (B − A)/(A + B) in Fig. 7b] where the contrast saturated. As a
result, the human observer measures intuitively a higher Ae value. The analyser positions at maximum contrast may be falsely mistaken as extinction angle. The extended plateau of high contrast at analyser angles around 17° may also explain the large scatter of visually determined extinction angles. An even more complex measuring situation for a human operator can occur in the case of multilayered pyrolytic carbon coatings that exhibit different optical properties (Reznik & Gerthsen, 2003; Reznik et al., 2003). Figure 8(a) shows a PLM micrograph of a polished crosssection of ‘composite 2’. The carbon fibres were covered with a duplex pyrolytic carbon matrix consisting of medium- and high-textured concentric regions (1 and 2 in Fig. 8a). Figure 8(b) displays photometric plots acquired within matrix regions 1 and 2 using an ROI size of 8 × 8 µm2. A single extinction minimum at Ae = 5° and Ae = 12° was detected in curves 1 and 2 (Fig. 8b). This last example illustrates that the method allowed sensitive distinction of pyrolytic carbon with alternating texture degree at the micrometer scale. In addition, the potential for improving the spatial resolution of the measurement was high because ROIs as small as 1 × 1 µm2 can be selected. Note that the optical anisotropy (Ae = 12°) in region 2 of composite 2 was similar to that measured for composite 1 (Fig. 6b, curve 1). These results are consistent with previous data obtained by selected-area electron diffraction in a transmission electron microscope showing that both regions contain pyrolytic carbon with a high texture (Reznik & Gerthsen, 2003; Reznik et al., 2003). In the present study, a halogen lamp (white light) served as illumination source. According to Vallerot & Bourrat (2006) the phase shift is wavelength dependent. Further studies are
© 2006 The Authors Journal compilation © 2006 The Royal Microscopical Society, Journal of Microscopy, 224, 322–327
O P T I CA L A N I S O T RO P Y O F P Y RO LY T I C CA R B O N
327
Fig. 8. (a) Polarized light microscopy micrograph of a polished section of an infiltrated carbon fibre felt with duplex pyrolytic carbon matrix. (b) Photometric plots acquired within region of interest (ROI)-1 and ROI-2 selected in (a).
ongoing on the effect of wavelength on the extinction minimum position derived by the developed digital photometric imageanalysis procedure.
Acknowledgements
Conclusions
The present study was performed in the Center of Excellence 551 in research on ‘Carbon from the gas phase: elementary reactions, structures, materials’. Financial support by the German Research Foundation (DFG) is gratefully acknowledged.
An improved technique for measurements of the extinction angle of pyrolytic carbon deposits by polarized light microscopy has been developed and tested successfully. The chargecoupled device camera-based technique provides significant advantages over the method relying on visual inspection of extinction contours by a human operator. Reliable intensity data with high angular and spatial resolution can be obtained. The procedure can be further improved by using a universal, goniometer-equipped stage to compensate for the tilt of the optical axis with respect to the sample surface and by automation of the analyser movement. For the first time, an unambiguous common rule for the measurement of the extinction angle Ae in circular-shaped as well as planar deposits of pyrolytic carbon is suggested. The developed procedure gives a basis for unified practical assessment of the optical anisotropy of pyrolytic carbon, which is important for a better use of the material. Moreover, the technique can also be applied for the investigation of the optical properties of other carbon-based materials, e.g. carbon fibres, pitches and cokes, as well other non-carbon materials, e.g. glazes and semiconductors exhibiting anisotropic optical properties. The measured Ae values are, as expected, lower than the calculated value for single crystalline graphite (Bourrat et al., 2000; Bortchagovsky et al., 2003; Pfrang & Schimmel, 2004). They depend on the optical anisotropy of the material, which is a measure of the structural anisotropy. It was shown that the real microstructure of the material, which defines the size and orientation distribution of optical domains, plays an important role in the measured value of Ae. The presented technique may also pave a way to correlate quantitatively the optical anisotropy of single crystalline graphite and pyrolytic carbon deposits, which motivates theoretical studies of the optical anisotropy of pyrolytic carbon taking the real microstructure of the material into account.
Blanco, C., Appleyard, S.P. & Rand, B. (2002) Study of carbon fibres and carbon–carbon composites by scanning thermal microscopy. J. Microsc. 205, 21–32. Bortchagovsky, E.G. (2004) Reflection polarized light microscopy and its application to pyrolytic carbon deposits. J. Appl. Phys. 95, 5192–5199. Bortchagovsky, E., Reznik, B., Gerthsen, D., Pfrang, A. & Schimmel, Th (2003) Optical properties of pyrolytic carbon deposits deduced from measurements of extinction angle by polarized light microscopy. Carbon, 41, 2430 –2433. Bourrat, X., Trouvat, B., Limousin, G., Vignoles, G. & Doux, F. (2000) Pyrocarbon anisotropy as measured by electron diffraction and polarized light. J. Mater. Res. 15, 92–101. Ergun, S. (1967) Determination of longitudinal and transverse optical constants of absorbing uniaxial crystals – Optical anisotropy of graphite. Nature, 14, 135 –136. Fitzer, E. & Manocha, L.-M. (1998) Carbon Reinforcements and Carbon/Carbon Composites. Springer-Verlag, Berlin. Galer, M. (2001) Digital Imaging. Les Horvat. Focal Press, Oxford. Oberlin, A. (2002) Pyrocarbons. Carbon, 40, 7–24. Pfrang, A. & Schimmel, Th (2004) Quantitative analysis of pyrolytic carbon films by polarized light microscopy. Surf. Interface Anal. 36, 184 –188. Reznik, B. & Gerthsen, D. (2003) Microscopic study of failure mechanisms in infiltrated carbon fiber felts. Carbon, 41, 57–69. Reznik, B., Gerthsen, D., Zhang, W. & Hüttinger, K.J. (2003) Texture changes in the matrix of an infiltrated carbon fiber felt studied by polarized light microscopy and selected area electron diffraction. Carbon, 41, 376–380. Reznik, B., Gerthsen, D. & Bortchagovsky, E. (2004) On the measurement of optical anisotropy of graphite and pyrolytic carbon by polarized light microscopy. CD-ROM of Extended Abstracts of International Conference on Carbon, Providence, Paper M0G006. Brown University, Rhode Island, USA, 11–16 July, 2004. Vallerot, J.M. & Bourrat, X. (2006) Pyrocarbon optical properties in reflected light. Carbon, 44, 1565 –1571.
References
© 2006 The Authors Journal compilation © 2006 The Royal Microscopical Society, Journal of Microscopy, 224, 322–327