An Information Model for Software Quality Measurement with ISO Standards Alain Abran École de Technologie Supérieure University of Québec , 1100 Notre -Dame Ouest, Montréal, Québec H3W 1T8, Canada
[email protected]
Rafa Al Qutaish École de Technologie Supérieure , Univer sity of Québec, 1100 Notre-Dame Ouest, Montréal, Québec H3W 1T8, Canada
[email protected]
Jean-Marc Desharnais École de Technologie Supérieure University of Québec , 1100 Notre -Dame Ouest, Montréal, Québec H3W 1T8, Canada
[email protected]
Naji Habra University of Namur Institut d'Informatique, Rue Grandgagnage, 21 5000 – Namur, Belgium
[email protected]
Abstract. Within the ISO’s mandate to upgra de its set of technical reports on the measurement of the quality of software products (ISO 9126), the ISO working group associated with it has come up with a proposed new structure, with some interesting contributions. This paper investigates the maturity of two new concepts proposed (measurement primitives and quality measures), highlights some of their weaknesses and proposes a way to address these using the measurement information model of ISO 15939 on software measurement process. Keywords: ISO 9126, Software Product Quality, Software Measurement, ISO 15939
1. Introduction In 1991, the ISO published its first international consensus on the terminology for the quality characteristics for software product evaluation (ISO 9126:1991) [2]. From 2001 to 2004, the ISO published an expanded version, containing both the ISO quality models and inventories of proposed measures for these models. The current version of the ISO 9126 series of standards now consists of four documents [4], [6]-[8]: - Quality models - ISO 9126-1. - External metrics 1 - ISO TR 9126-2. - Internal metrics - ISO TR 9126-3. - Quality in use metrics - ISO TR 9126-4. The ISO has now recognized a need for further enhancement of ISO 9126, primarily as a result of advances in the fields of information technologies and changes in environment [1]. Therefore, the ISO is now working on the next generation of software product quality standards [12], which will be referred to as Software Product Quality Requirements and Evaluation (SQuaRE - ISO 25000). This series of standards will replace the current ISO 9126 and ISO 14598 series of standards. The SQuaRE series will consist of five divisions, as in Figure 1 [9]: - Quality management division (ISO 2500n). - Quality model division (ISO 2501n). - Quality measureme nt division ( ISO 2502n). 1
The term ‘metrics’ used in ISO/IEC 9126 is replaced by ‘measures’ in the new series of standards in accordance with ISO/IEC 15939.
1/18
- Quality requirements division (ISO 2503n). - Quality evaluation division (ISO 2504n).
Quality Requirements Division 2503n
Quality Model Division 2501n Quality Management Division 2500n Quality Measurement Division 2502n
Quality Evaluation Division 2504n
Figure 1 WG6’s proposed organization of the SQuaRE series of standards
One of the main objectives of (and differences between) the SQuaRE series of standards and the current ISO 9126 series of standards is the coordination and harmonization of its contents with ISO 15939 [9]. Figure 2 shows the proposed structure of the quality measurement division (ISO 2502n) series that is to replace the current four-part ISO 9126 series of standards [10]. This proposed quality measurement division (ISO 2502n) would consist of five standards [10]: - Measurement reference model and guide (ISO 25020) - Measurement primitives (ISO 25021) - Measurement of internal quality (ISO 25022) - Measurement of external quality (ISO 25023) - Measurement of quality in use (ISO 25024) Measurement Reference Model and Guide (ISO 25020)
Measurement of Internal Quality (ISO 25022)
Measurement of External Quality (ISO 25023)
Measurement of Quality in Use (ISO 25024)
Measurement Primitives (ISO 25021) Figure 2 WG6 proposed structure of the Measurement division (ISO 2502n series)
This paper is organized as follows. Section 2 presents the ISO Measurement Information Model adopted in ISO 15939. Section 3 analyzes the concept of ‘measurement primitives’ proposed by WG6, and section 4, the concept of ‘quality measures’, including our proposed solution for alignment with the measurement information model of ISO 15939. Finally, examples are presented in section 5, and conclusions in section 6.
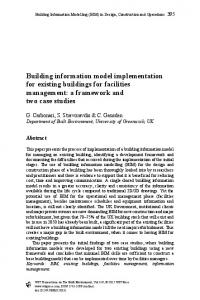
2. ISO Measurement Information Model Within ISO 15939 (2002), ISO produced an information model (Figure 3) to help in determining what has to be specified during measurement planning, performance and evaluation [5].
2/18
Figure 3 shows that a specific measurement method is used to collect a base measure for a specific attribute. Then, the values of two or more base measures can be used within a computational formula (by means of a measurement function) to produce and construc t a specific derived measure. These derived measures are then used in the context of an analysis model to arrive at an indicator which is a value, and to interpret the indicator’s value to explain the relationship between it and the information needed, in the language of the measurement user, to produce an Information Product for his Information Needs [5]. Information Product Information Needs Interpretation
Indicator
(Analysis) Model
Derived Measures
Measurable Concept
Entity
Derived Measures
Measurement Function
Base Measures
Base Measures
Measurement Method
Measurement Method
Attribute
Attribute
Figure 3 Measurement Information Model from I S O 15939 (2002)
2
There already exists a very mature measurement terminology, and it is well documented in the ISO International Vocabulary of Basic and General terms in Metrology (VIM) [3]. This terminology is widely accepted and used in most fields of science, and has been adopted in ISO 15939 as the agreed upon measurement terminology for software and system engineering related ISO standards.
2
We added the arrows to the ISO/IEC 15939 Measurement Information Model to point up the dataflow relationships. Ovals represent activities and rectangles represent the input and output of an activity.
3/18
3. Measurement Primitives: Issues 3.1 WG6 work in progress In 2004, ISO working group six (WG6) of software engineering subcommittee seven (SC7) proposed the introduction of two new concepts, namely ‘measurement primitives’ and ‘quality measures’. The introduction of these two new terms by WG6 raises the following concern: either the proper mapping to the set of classic metrology concepts has not yet been performed, or there are concepts missing from the metrology. The latter would be rather surprising. In this paper, we revisit the WG6 proposal in order to recommend the proper mapping of concepts to the related metrology terms and the ISO 15939 Measurement Information Model. Figure 4 shows the WG6 proposed process for constructing the new ‘measurement primitives’ concept, which would either be a base or a derived measure [10]. Measurement Primitives
Base Measure
Derived Measure
OR
Measurement Function
Base Measure
Base Measure
Measurement Method
Measurement Method
Measurement Method
Attributes for Quality Measure
Attributes for Quality Measure
Attributes for Quality Measure
Figure 4 WG6 proposed process for constructing a Measurement Primitive
The current WG6 proposal recommends a set of measurement primitives to be used within the software product life cycle as an input for external, internal and qua lity in use measures Table 1 - in ISO PDTR 25021 [11]. Table 1 WG6 recommended set of Measurement Primitives (MP) MP Class Name External Metrics
MP Name Time Number of Functions Number of Faults Number of Data Number of Operations Number of Test Cases
In addition to the recommended set of measurement primitives, WG6 is also proposing a list of quality measures for internal, external and quality in use assessment, all of them to be
4/18
derived from measures selected from the set of measurement primitives; Table 2 shows the subset of these quality measures proposed in [11]. Figure 5 shows the WG6 proposal for the means for constructing the new quality measure concept: measurement primitives are to be used to construct quality measures by applying a measurement function on them based on (e.g. the dotted lines) the quality characteristics and subcharacteristics of a software product [10]. It is to be noted that the relationship represented by the dotted line in Figure 5 is not described and remains ambiguous 3. Table 2 WG6 recommended set of Quality Measures Quality Group Name
Quality Measure Name
Internal Quality Measures
Functional Adequacy Precision Restartability Physical Accessibility Computational Accuracy Access Controllability Operational Consistency Installation Flexibility Task Completion Productive Proportion Discretionary Usage
External Quality Measures
Quality in Use Measures
Software Product Quality
Quality Measures Quality Characteristics Measurement Function
Quality Sub-characteristics
Measurement Primitives
Figure 5 WG6 proposed construction of Quality Measures
3.2 Identification of issues An analysis of WG6’s early 2005 draft document identifies a number of issues with the proposed concept of measurement primitives: - The WG6 definition of measurement primitives does not provide criteria which allow verification that the proposed list (Table 1) is complete and correct. 3
Conventions are not defined for the symbols in Fig. 5. Content of the rectangles cannot be assumed to be at the same abstraction level and with similar interpretation.
5/18
- The WG6 proposed list of measurement primitives contains only base measures; it has therefore not been demonstrated yet that there is an instance of a measurement primitive being a derived measure. - No rationale has been provided for not using accepted terminology of metrology, including base and derived measures. - It is mentioned that the items in Table 1 have been identified and selected by means of a survey [11], but criteria for this survey are not documented and therefore it lacks transparency. - Even though the WG6 proposal mentions that the def inition of measurement primitives is based on ISO 15939 [11], it is not traceable back to that standard. - The term ‘measurement function’ is used twice in the proposed hierarchy, that is, below the concept of ‘measurement primitives’ in Figure 4 as well as above it in Figure 5. However, it cannot be assumed that it means the same thing in both instances. On the contrary, such a double use of the terminology in a hierarchy of concepts leads both to ambiguity in expressing concepts, and to serious misunderstanding on the part of users of such documents. - The items listed on the right-hand side of Table 2 are referred to as ‘quality measures’; however, they refer to the name of the attribute being measured at the level of the subcharacteristic (for internal and external quality of software products) or at the level of the quality characteristic for the quality in use of the software product. By contrast, the quality model described in ISO 9126 does not refer to the measurement of individual itemized attributes, but to the combination of the measures of these various attributes within the multi-level model of quality adopted in ISO 9126-1. - In Table 2, there are a number of so-called quality measures not present in ISO 9126 documents. 3.3 Mapping terminology with VIM and ISO 15939 We illustrate now how the issue of ambiguity and redundancy in WG6’s proposed new term ‘measurement primitives’ can by avoided through the use of the corresponding metrology concepts and terms. The related concepts in metrology are the following [ 3], [5]: - Base measure: the measure that is defined in terms of an attribute and the method for quantifying it. - Derived measure: the measure that is defined as a function of two or more values of base measures. In practice, the data collection ass ociated with a property of an object (or concept), and quantification of it, happens at the base measure level, at which time a measurement unit is assigned based on the rules of the measurement method used for the quantification. At the derived measure level, the base measures have been already collected and are being assembled according to the combination rules (e.g. a computational formula) defined within each derived measure. A derived measured is therefore the product of a set of measurement units pr operly combined (through a measurement function). This combination is then labeled to represent an attribute (of a characteristic or subcharacteristic of the quality) of a software product. Table 3 shows examples of base measures used in the definitions of the measures documented in ISO 9126-2, -3 and -4 [6]-[8]. Table 3, shows the name of each base measure and the unit of measurement that is given to its value. These base measures can then be used to calculate
6/18
each of the derived measures (akin to metric s) in ISO 9126-4. The full list for ISO 9126-2, -3 and -4 is provided in Appendix A. Table 3 Examples of base measures in ISO 9126-4
1 2 3 4 5 6 7 8 9 10
Quality in use Base Measures Measure Name Task Effectiveness Total Number of Tasks Task Time Cost of the Task Help Time Error Time Search Time Number of Users Total Number of People Potentially Affected by the System Total Number of Usage Situations
Unit of Measurement (a given weight) Task (number of) Minute Dollar Second Second Second User (number of) Person (number of) Situation (number of)
Each of these base measures must be collected individually. They can be used at least once, or multiple times, for obtaining the derived measure required to quantify the software properties specified in the ISO 9126 quality model. Table 4 provides an example of where some base measures are used throughout ISO 9126-3: for instance, the base measure, ‘number of inaccurate computations encountered by users’, is used only once in ‘external functionality accuracy measures’, while the base measure, ‘number of items requiring compliance’, can be used in 6 subcharacteristics of external quality (ISO 9126-1) [4]. The construction of derived measures is based on a computational formula consisting of two or more base measures. An example of a cross-reference table is provided in Appendix B. Table 4 Examples of the use of base measures in ISO 9126-2 Measure Name
Unit
Functionality F1 F2
1 2
3
4 5
6
7
8
Number of Functions Operation Time Number of Inaccurate Computations Encountered by Users Number of Data Formats Number of Illegal Operations Number of Items Requiring Compliance Number of Interfaces Requiring Compliance Number of Faults
F3 F4
F5
Reliability R1
R2
R3
R4 U1 U2 U3 U4
Function ? ? ??
Case
?
Operation
?
E2
Maintainability
E3 M1 M2 M3 M4 M5
?
Portability P1
P2
P3 P 4
?
? ?
? ?
? ? ?
?
P5
? ?
? ?
Item
?
Interface
?
Fault
U5 E1
? ? ?
Minute
Format
External Usability Efficiency
?
?
?
?
?
?
? ?
Such lists of base measures and of the usage cross-references are currently missing from ISO 9126 and would be helpful to those designing programs for implementing measurement of the quality of software products using ISO 9126 quality models and related measures. In particular, these lists can help in:
7/18
- Identifying, selecting and collecting a base measure (once), and then using this base measure to evaluate a number of derived measures. - Knowledge of which base measures are required to evaluate specific software quality attributes (characteristics and subcharacteristics). In summary, from our point of view, issuing a new term such as ‘measurement primitives’ is not necessary: the terminology and concepts in ISO VIM [3] and in ISO 15939 [5] are sufficient.
4. Mapping the Quality Model to the Measurement Information Model 4.1 Current WG6 work in progress and related issues Figure 6 shows the WG6 proposed relationship between the SQuaRE Software Product Quality Measurement – Reference Model (SPQM-RM) and the ISO 15939 Measurement Information Model. This figure leads to the conclusion that every quality measure is necessarily a derived measure, that a measurement primitive can be a base or a derived measure. It can also be observed that there is no mapping to the analysis model, indicator or interpretation between the SQuaRE and ISO 15939 models. In Figure 5, there is some mapping between quality measures and quality characteristics and subcharacteristics, but this is at the level of the derived measures and through an unspecifie d relationship – the dashed arrow in Figure 5. Information Product Interpretation
Indicator
Analysis Model Quality Measures
Derived Measure
Measurement Function
Measurement Function
Measurement Primitives
Base Measure
Measurement Method
Measurement Method
Attributes for Quality Measure
Attributes
SQuaRE SPQM -RM
ISO/IEC 15939
Figure 6 WG6 proposed relationships between the SQuaRE SPQM-RM and the ISO 15939 Measurement Information Model
8/18
4.2 Mapping with ISO 15939 In this section, we propose a mapping of both the measures and of the quality models in ISO 9126 to the measurement information model described in ISO 15939. As a first step, we refer to the bottom section of Figure 7 by the term ‘Data Collection’ (e.g. the measurement methods and the base measures), the middle section by the term ‘Data Preparation’ using agreed upon mathematical formula and related labels (e.g. measurement functions and derived measures) and the top section by the term the ‘Data Analysis’ (e.g. analysis model, indicator and interpretation). Information Product
Data Analysis Interpretation
Indicator
Analysis Model
Data Preparation Derived Measure
Measurement Function
Data Collection Base Measure
Measurement Method
Attributes Figure 7 ISO 15939 (2002) Measurement Information Model – three different sections
Both data collection and data preparation having already been discussed in section 3, we now focus on the ‘Data Analysis’ section.
9/18
It is in the ‘Analysis Model’ part of the ISO 15939 measurement information model that the ISO 9126 models of software product quality are to be put to use. Figures 8, 9 and 10 present these generic models of ISO 9126 [4]. Process
Effect of Software Product
Software Product influences
Internal Quality Attributes
Process Quality depends on
influences
influences
External Quality Attributes
Quality in use Attributes
depends on
depends on
Context of use External Measures
Process Measures
Internal Measures Figure 8 Quality in the lifecycle – ISO 9126 -1 [4]
Use and feedback
User Quality Needs
Quality in use Measures
Quality in use
Contribute to specifying Indicates External Quality Requirement
External Quality
Validation
Contribute to specifying Indicates Verification
Internal Quality Requirement
Internal Quality
Figure 9 Quality in the software lifecycle – ISO 9126-1 [4]
External and Internal Quality
Functionality
Reliability
- Suitability - Accuracy - Interoperability - Security - Functionality Compliance
- Maturity - Fault Tolerance - Recoverability - Reliability Compliance
Usability
Efficiency
- Understandability - Learnability - Operability - Attractiveness - Usability Compliance
- Time Behavior - Resource Utilization - Efficiency Compliance
Maintainability
- Analyzability - Changeability - Stabilit y - Testability - Maintainability Compliance
Portability
- Adaptability - Installability - Co-existence - Replaceability - Portability Compliance
Figure 10 Quality model for External and Internal Quality (characteristics and sub-characteristics) – ISO 9126-1 [4]
10/18
These generic ISO models are to be instantiated in any particular context of measuring the quality of a specific software product. This is usually performed in a four-step process: 1. Identification of quality related requirements, that is, the selection of the parts of the ISO quality models that are relevant to a particular context of quality evaluation. 2. Identification of the context of interpretation, that is: - the selection of reference values, such values being either generic or specific threshold values, or - the determination of targets specified for a particular context. 3. Use of the derived measures from the data preparation phase to fill out the instantiated quality model determined in 1. 4. Comparison of the results of step 3 with either the set of reference values or targets determined in step 2. This is summarized in Figure 11. Data Analysis Comparison of the Values (Interpretation Model)
Generic Thresholds Values
OR
Targets Values
(Indicators) Identification of the context of interpretation Identification of quality related requirements
Data Preparation
Measurement Values
Derived Measures
Measurement Function
Data Collection Base Measures
Base Measures
Measurement Method
Measurement Method
Attributes
Attributes
Figure 11 Mapping to the Measurement Information Model
11/18
5. Examples Some examples are presented next illustrating the process described in Figure 11. These include some of the ISO 9126 base measures and how they are combined to construct a derived measure using a computational formula: Example 1: Data Collection: Base Measure 1 (B1): Number of inaccurate computations encountered by users. Base Measure 2 (B2): Operation time. Data Preparation: Derived Measure: B1 / B2 Name of Derived Measure: Computational accuracy. Data Analysis Quality group name: External quality measures. Characteristic: Functionality. Subcharacte ristic: Accuracy. Comparison of values obtained with the indicators (generic thresholds and/or targets). Example 2: Data Collection: Base Measure 1 (B1): Number of detected failures. Base Measure 2 (B1): Number of performed test cases. Data preparation: Derived Measure: B1 / B2 Name of Derived Measure: Failure density against test cases. Data Analysis: Quality group name: External quality measures. Characteristic: Reliability. Subcharacteristic: Maturity. Comparison of values obtained with the indicators ( generic thresholds and/or targets). Example 3: Data Collection: Base Measure 1 (B1): Number of memory related errors. Base Measure 2 (B2): Number of lines of code directly related to system calls. Data Preparation: Derived Measure: B1 / B2 Name of Derived Measure: Memory utilization message density. Data Analysis: Quality group name: Internal quality measures. Characteristic: Efficiency. Subcharacteristic: Resource utilization. Comparison of values obtained with the indicators (generic thresholds and/or targets). Example 4: Data Collection: Base Measure 1 (B1): Task time. Base Measure 2 (B2): Help time. Base Measure 3 (B3): Error time.
12/18
Base Measure 4 (B4): Search time. Data Preparation: Derived Measure: (B1-B2-B3-B4) / B1 Name of Derived Measure: Productiv e proportion. Data Analysis: Quality group name: Quality in use measures. Characteristic: Productivity. Comparison of values obtained with the indicators (generic thresholds and/or targets). Example 5: Data Collection: Base Measure 1 (B1): Number of errors made by user. Base Measure 2 (B2): Number of tasks. Data Preparation: Derived Measure: B1 / B2 Name of Derived Measure: Error frequency. Data Analysis: Quality group name: Quality in use measures. Characteristic: Effectiveness. Comparison of values obtained with the indicators (generic thresholds and/or targets). Example 6: Data Collection: Base Measure 1 (B1): Task effectiveness. Base Measure 2 (B2): Task time. Data Preparation: Derived Measure: B1 / B2 Name of Derived Measure: Task efficiency. Data Analysis: Quality group name: Quality in use measures. Characteristic: Effectiveness. Comparison of values obtained with the indicators (generic thresholds and/or targets).
6. Conclusions Within the ISO’s mandate to upgrade its set of technical reports on the measurement of the quality of software products (ISO 9126), ISO WG6 has come up with a proposed new structure for upgrading the current series of ISO 9126 documents for the measurement of the quality of software products. In this paper, issues have been raised concerning two new concepts proposed by WG6: measurement primitives and quality measures. These concerns can be summarized as follows: - Measurement primitives: non alignment with the classic terminology on measurement is puzzling: - Quality measures: inconsistency in the terminology used, and ambiguity about which level of the ISO 9126 multi-level standard is being applied. We have analyzed some of their weaknesses and proposed ways to address them by using the ISO 15939 measurement information model on software measurement process. In summary, using predefined terms such as ‘base measure’ and ‘derived measure’, as well as the proper mapping to the Measurement Information Model in well-developed standards like ISO 15939,
13/18
and the international vocabulary of basic and general terms in metrology (VIM) is more useful than producing weakly defined terms.
Disclaimer The opinions expressed in this report are solely those of the authors.
References 1. Azuma, M., 2001, “SQuaRE: The next Generation of ISO/IEC 9126 and 14598 International Standards Series on Software Product Quality,” in Proceedings of the European Software Control and Metrics Conference (ESCOM), 2-4 April 2001, London, UK, pp. 337-346. 2. ISO, 1991, ISO/IEC IS 9126, Software Product Evaluation – Quality Characteristics and Guidelines for Their Use, Geneva : International Organization for Standardization. 3. ISO, 1993, International Vocabulary of Basic and General Terms in Metrology (VIM), Geneva: International Organization for Standardization. 4. ISO, 2001, ISO/IEC 9126 -1, Software Engineering – Product Quality – Part 1: Quality model, Geneva: International Organization for Standardization. 5. ISO, 2002, ISO/IEC IS 15939, Software Engineering – Software Measurement Process, Geneva: International Organization for Standardization. 6. ISO, 2003, ISO/IEC TR 9126 -2, Software Engineering – Product Quality - Part 2: External Metrics , Geneva: International Organization for Standardization. 7. ISO, 2003, ISO/IEC TR 9126 -3, Software Engineering – Product Quality - Part 3: Internal Metrics , Geneva: International Organization for Standardization. 8. ISO, 2004, ISO/IEC TR 9126 -4, Software Engineering – Product Quality – Part 4: Quality in Use Metrics, Geneva : International Organization for Standardization. 9. ISO, 2004, ISO/IEC FCD 25000, Software Engineering – Software Product Quality Requirements and Evaluation (SQuaRE) - Guide to SQuaRE, Geneva: International Organization for Standardization. 10. ISO, 2004, ISO/IEC FCD 25020, Software and System Engineering - Software Product Quality Requirements and Evaluation (SQuaRE) – Measurement Reference Model and Guide, Geneva: International Organization for Standardization, January 24, 2005. 11. ISO, 2004, ISO/IEC PDTR 25021, Software and System Engineering - Software Product Quality Requirements and Evaluation (SQuaRE) – Measurement Primitives , Geneva: International Organization for Standardization. 12. Suryn, W.; Abran A.; and April A., 2003, "ISO/IEC SQuaRE: The Second Generation of Standards for Software Product Quality," 7th IASTED International Conference on Software Engineering and Applications, California, USA.
14/18
Appendices Appendix A: The List of ISO/IEC 9126 Base Measures External Base Measures Measure Name
Unit of Measurement
1
Number of Functions
Function (number of)
2
Operation Time
Minute
3
Number of Inaccurate Computations Encountered by Users
Case (number of)
4
Total Number of Data Formats
Format (number of)
5
Number of Illegal Operations
Operation (number of)
6
Number of Items Requiring Compliance
Item (number of)
7
Number of Interfaces Requiring Compliance
Interface (number of)
8
Number of Faults
Fault (number of)
9
Number of Failures
Failure (number of)
10
Product Size
Byte
11
Number of Test Cases
Case (number of)
12
Number of Breakdowns
Breakdown (number of)
13
Time to Repair
Minute
14
Down Time
Minute
15
Number of Restarts
Restart (number of)
16
Number of Restoration Required
Restoration (number of)
17
Number of Tutorials
Tutorial (number of)
18
Number of I/O Data Items
Item (number of)
19
Ease of Function Learning
Minute
20
Number of Tasks
Task (number of)
21
Help Frequency
Access (number of)
22
Error Correction
Minute
23
Number of Screens or Forms
Screens (number of)
24
Number of User Errors or Changes
Error (number of)
25
Number of Attempts to Customize
Attempt (number of)
26
Total Number of Usability Compliance Items Specified
Item (number of)
27
Response Time
Second or Millisecond
28
Number of Evaluations
Evaluation (number of)
29
Turnaround Time
Second or Millisecond
30
Task Time
Minute
31
Number of I/O Related Errors
Error (number of)
32
User Waiting Time of I/O Device Utilization
Second or Millisecond
33
Number of Memory Related Errors
Error (number of)
34
Number of Transmission Related Errors
Error (number of)
35
Transmission Capacity
Byte
36
Number of Revised Versions
Version (number of)
37
Number of Resolved Failures
Failure (number of)
38
Porting User Friendliness
Minute
15/18
Internal Base Measures Measure Name
Unit of Measurement
1
Number of Functions
Function (number of)
2
Number of Data Items
Item (number of)
3
Number of Data Formats
Formats (number of)
4
Number of Interface Protocols
Protocol (number of)
5
Number of Access Types
Access -Type (number of)
6
Number of Access Controllability Requirements
Requirement (number of)
7
Number of Instances of Data Corruption
Instance (number of)
8
Number of Compliance Items
Item (number of)
9
Number of Interface Requiring Compliance
Interface (number of)
10
Number of Faults
Fault (number of)
11
Number of Test Cases
Test-Case (number of)
12
Number of Restoration
Requirement (number of)
13
Number of Input Items Which Could Check for Valid Data
Item (number of)
14
Number of Operations
Operation (number of)
15
Number of Messages Implemented
Message (number of)
16
Number of Interface Elements
Element (number of)
17
Response Time
Second or Millisecond
18
Turnaround Time
Second or Millisecond
19 20
I/O Utilization (Number of Buffers) Memory Utilization
Buffer (number of) Byte
21
Number of Lines of Code Directly Related to System Calls
Line (number of)
22
Number of I/O Related Errors
Error (number of)
23
Number of Memory Related Errors
Error (number of)
24
Number of Items Required to be Logged
Item (number of)
25
Number of Modifications Made
Modification (number of)
26
Number of Variables
Variable (number of)
27
Number of Diagnostic Functions Required
Function (number of)
28
Number of Entities
Entity (number of)
29
Number of Built-in Test Function Required
Function (number of)
30
Number of Test Dependencies on Other System
Dependency (number of)
31
Number of Diagnostic Checkpoints
Checkpoint (number of)
32
Number of Data Structures
Data-Structure (number of)
33
Total Number of Setup Operations
Operation (number of)
34
Number of Installation Steps
Step (number of)
Quality in use Base Measures Measure Name
Unit of Measurement
1
Task Effectiveness
(a given weight)
2
Total Number of Tasks
Task (number of)
3
Task Time
Minute
4
Cost of the Task
Dollar
5
Help Time
Second
6
Error Time
Second
7
Search Time
Second
8
Number of Users
User (number of)
9
Total Number of People Potentially Affected by the System
Person (number of)
10
Total Number of Usage Situations
Situation (number of)
16/18
Appendix B: The Cross-Reference Table of ISO/IEC 9126 Base Measure Usages. Measure Name
Unit
External Functionality F1 F2
F3 F4
1
Number of Functions
Function
2
Operation Time
Minute
? ??
Case
?
3
4
Number of Inaccurate Computations Encountered by Users Number of Data Formats
8
Number of Illegal Operations Number of Items Requiring Compliance Number of Interfaces Requiring Compliance Number of Faults
9
5 6
7
Format Operatio n
Reliability
Usability
Efficiency Maintainability
Portability
Functionality
F5 R1 R2 R3 R4 U1 U2 U3 U4 U5 E1 E2 E3 M1 M2 M3 M4 M5 P 1 P 2 P 3 P 4 P 5 F1
?
? ? ? ?
?
?
? ?
Quality in use
Internal
? ?
? ? ?
?
?
F2 F3 F4
Reliability
Usability
Efficiency Maintainability
Portability
Q 1 Q 2Q 3 Q 4
F5 R1 R2 R3 R4 U1 U2 U3 U4 U5 E1 E2 E3 M1 M2 M3 M4 M5 P 1 P 2 P 3 P 4 P 5
? ?
?
? ? ?
?
?
?
?
?
? ?
?
Item
?
Interface
?
?
?
?
?
?
?
?
Fault
?
Number of Failures
Failure
? ?
10
Product Size
Byte
?
11
Number of Test Cases
Case
12
Number of Breakdowns
Breakdo wn
? ?
13
Time to Repair
Minute
?
14
Down Time
15
Number of Restarts
Restart
?
16
Number of Restoration
Restorati on
?
?
?
? ? ?
? ?
?
?
?
?
?
?
?
17/18
?
?
?
?
Legend of the Quality in Use characteristics Q1 Effectiveness Q2 Productivity Q3 Safety Q4 Satisfaction
Legend of the External and Internal sub-characteristics F1 F2 F3 F4 F5 R1 R2 R3 R4 U1 U2 U3 U4 U5
Suitability Accuracy Inter operability Security Functionality Compliance Maturity (Hardware /Software/Data) Fault Tolerance Recoverability (Data/Process/Technology) Reliability Compliance Understandability Learnability Operability Attractiveness Usability Compliance
18/18
E1 E2 E3 M1 M2 M3 M4 M5 P1 P2 P3 P4 P5
Time Behavior Resource Utilization Efficiency Compliance Analyzability Changeability Stability Testability Maintainability Compliance Adaptability Instability Co-existence Replaceability Portability Compliance