237
An Infrastructure for Monitoring and Management in Computational Grids Abdul Waheed1, Warren Smith2, Jude George3, and Jerry Yan4 1
MRJ Technology Solutions, NASA Ames Research Center, Moffett Field, CA 94035-1000
[email protected] 2 Computer Sciences Corp., NASA Ames Research Center, Moffett Field, CA 94035-1000
[email protected] 3 FSC End2End, Inc., NASA Ames Research Center, Moffett Field, CA 94035-1000
[email protected] 4 NASA Ames Research Center, Moffett Field, CA 94035-1000
[email protected]
Abstract. We present the design and implementation of an infrastructure that enables monitoring of resources, services, and applications in a computational grid and provides a toolkit to help manage these entities when faults occur. This infrastructure builds on three basic monitoring components: sensors to perform measurements, actuators to perform actions, and an event service to communicate events between remote processes. We describe how we apply our infrastructure to support a grid service and an application: (1) the Globus Metacomputing Directory Service; and (2) a long-running and coarse-grained parameter study application. We use these application to show that our monitoring infrastructure is highly modular, conveniently retargettable, and extensible.
1
Introduction
A typical computational grid is characterized by distributed resources, services, and applications. Computational grids consist of large sets of diverse, geographically distributed resources that are grouped into virtual computers for executing specific applications. The diversity of these resource and their large number of users render them vulnerable to faults and excessive loads. Suitable mechanisms are needed to monitor resource usage for detecting conditions that may lead to failures. Grid resources are typically controlled by multiple, physically separated entities that constitute value-added services. Grid services are often expected to meet some minimum levels of quality of service (QoS) for desirable operation. Appropriate mechanisms are needed for monitoring and regulating system resource usage to meet QoS requirements. The complexity of grid applications, which are built on distributed resources and services, stems from their typically large size and inherently distributed structure. This complexity contributes to a possibility of encountering failures. Therefore, grid applications also require mechanisms to detect and recover from failures. The National Aeronautics and Space Administration (NASA) is building a
238 computational grid, called the Information Power Grid (IPG). Currently, the IPG consists of resources at NASA’s Ames, Glenn, and Langley research centers and will grow to contain resources from many NASA centers. As part of this effort, we are developing an infrastructure to monitor resources, services, and applications that make up the IPG and to detect excessive resource usage patterns, faults, or deviations from required QoS levels. This grid monitoring infrastructure is also capable of invoking recovery mechanisms for possible fault management or QoS regulation. In this paper, we present the design of this infrastructure and describe its implementation for fault detection and management of a grid service and an IPG application. We require a framework for monitoring and fault management that is scalable, extensible, modular, secure, and easy to use. Our infrastructure must scale to the large number of entities to be monitored and managed in the IPG. Our framework must also be extensible because entities to be monitored, failure modes, and methods for fault recovery or QoS regulation are likely to change over time. As a means to several ends, we require that our grid monitoring infrastructure is modular to allow new components to be added and existing components to be modified without changing the rest of the code. Modularity helps lower the software complexity by allowing a user to include only those components that they wish to use. We also require support for several levels of security built atop the basic IPG security infrastructure: none, authentication and authorization, and finally authentication, authorization, and encrypted communication. We examined a number of existing monitoring systems and found that they did not fulfill the above requirements. A majority of existing monitoring systems, such as NetLogger [15], Paradyn [12], AIMS [17], Gloperf [10], and SPI [1] can collect data from distributed systems for analyzing them through their specific tools. However, these monitoring systems cannot serve as data collection components for other tools and applications that may wish to use this information. Some of the existing monitoring systems do support external tools or applications for fault detection, resource scheduling, and QoS management. The Heart Beat Monitor (HBM) is an extension of Globus that periodically sends “heartbeats” to a centralized collector and provides a fault detection service in a distributed system [14]. While heartbeats are often used for periodically determining the status of a remote node, relying only on one type of “sensor” (i.e., heartbeats generated by local monitors) contributes to inaccuracies in fault detection. The Network Weather Service (NWS) measures available network bandwidth and system load to predict their future states. Future state predictions can be used by a scheduler to reserve and allocate these resources in an efficient manner [16]. If we consider a state estimator as a special type of sensor, we could use its future state predictions for the benefit of several real-time applications that often rely on dynamic scheduling of resources. Dinda et al. compare and evaluate several time-series modeling techniques to predict future system loads, which can be applied to dynamic resource management [5]. The Dynamic Soft Real-Time (DSRT) scheduling tool relies on a customized CPU monitor to implement various specific scheduling policies of this tool [4]. JEWEL/DIRECT is an example where a monitoring system can be used as a part of a feedback loop in control systems [7,9]. However, the complexity of this monitoring system makes it a challenge to use.
239 RMON monitors the resource usage for distributed multimedia systems running RTMach [11]. Information collected by the monitoring system is specifically used for adaptively managing the system resources through real-time features of the operating system. Autopilot integrates dynamic performance instrumentation and on-the-fly performance data reduction with configurable resource management and adaptive control algorithms [13]. However, in this case data collection is specifically geared toward providing adaptive control and it is not obvious if underlying data gathering services can be used for other applications. Java Agents for Monitoring and Management (JAMM [3]) is another effort in the same direction, which addresses the needs of only Java based applications. SNMP based tools are widely used for network monitoring and management. Similarly, monitoring, fault notification, and web-based system and network administration tools, such as Big Brother [2] are also useful for distributed systems. However, these tools cannot provide application-specific event notification, which is supported in our monitoring and management infrastructure. Our infrastructure is built on three basic modules: sensors, actuators, and a grid event service. Sensors are used to measure properties from a local system. Since there are many properties that could be measured, our monitoring infrastructure defines a common application programming interface (API) for sensors. In this way, we can implement some set of sensors for measuring basic properties and other users can add sensors for other properties that they wish to monitor. Actuators perform actions from a local system. Similar to sensors, there are many different actuators that all share a common API. The grid event service provides communication of monitoring and fault management events from producers to consumers. Atop these basic modules, higherlevel modules can be constructed. For example, we describe a sensor manager component that facilitates the building of customized monitoring systems. Our monitoring infrastructure is described in Section 2. Section 3 describes a service and an application that we are supporting with our infrastructure. We conclude with a discussion of future directions of this effort in Section 4.
2
Monitoring Infrastructure
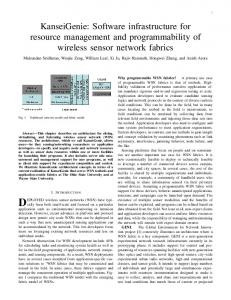
Our grid monitoring infrastructure includes three basic components: sensors, actuators, and an event service. Figure 1 depicts a typical monitoring scenario built on these basic components. These components are typically located on multiple hosts that interact with one another through the event service as shown in the figure. Further description of three basic components follows.
Sensors: A sensor can measure the characteristics of a target system resource. A sensor typically executes one of Unix utilities, such as df, ps, ping, vmstat, or netstat, and extracts sensor-specific measurements. These measurements are represented as values of sensor-specific attributes. In addition to these external sensors, we also provide internal sensors that can collect resource usage information from within the calling process. Actuators: An actuator is invoked in a similar fashion to a sensor except that it uses
240
Host B Event service interface
stdout
stderr
Data consumer
fork
Actuator
Shell command
Host A XML event data Control signals
Event service interface
Actuator Shell command fork stdout stderr
Calling process
pipe
pipe
fork
Sensor Shell command
stdout stderr
Fig. 1. A prototype implementation of a monitoring system using three basic components of grid monitoring infrastructure: sensors, actuators, and grid event service.
the shell to perform specific configuration, process control, or other user-defined tasks. Some of the actuators that we are implementing include: kill process, send mail, execute a shell command, lightweight directory access protocol (LDAP) server queries, and some Globus commands. Event Service: This facility provides a mechanism for forwarding sensor-collected information to other processes that are interested in that information. Event service supports a publisher-subscriber paradigm for a client to request specific information and a server to forward that information. Event service also facilitates forwarding of application-specific event data from a user process to a consumer process. These basic monitoring services can be invoked through APIs. Common APIs to sensors and actuators allow us to implement new sensors or actuators without changing the code that uses them. We also implement the APIs as stand-alone utilities so that they can be invoked on the command-line. We have implemented these components on three platforms: Irix, Solaris, and Linux. We represent the monitored data using eXtensible Markup Language (XML). A number of higher level components can be built using the basic monitoring components. We have implemented a local sensor manager that can execute userspecified sensors and forward event data. We have also developed a generic data collector component for gathering the information forwarded by local monitoring servers. We are in the process of developing data archives and query servers to extend monitoring and management infrastructure to support tools and applications that do not use publisher-subscriber paradigm. Figure 2 presents an overview of the software architecture of monitoring and fault management infrastructure. Prototypes for the three basic components are built on Globus middleware services for communication and security. Higher level components are based on the three basic components. Distributed applications, management tools, and monitoring tools can either use high
241 level components or directly access basic components for a greater degree of customizability. Monitoring, fault management, and QoS regulation applications Higher level monitoring and management components (sensor managers, data collectors, etc.) Monitoring and management infrastructure (sensors, actuators, event service)
Globus middleware services Operating system services
Fig. 2. Software architecture of monitoring and management infrastructure for computational grids.
3
Applications of the Infrastructure
We are currently applying our infrastructure to one grid service and one grid application to provide fault handling and application status tracking. The following subsections present an overview of these uses of our infrastructure. 3.1 Fault Management for Metacomputing Directory Service The metacomputing directory service (MDS) is the LDAP-based grid information service of the Globus toolkit [6]. In a Globus based computational grid, the MDS maintains dynamic information about resources, services, and applications. Many services and applications utilize this information and it is thus critical that this information be available. An MDS server may become inaccessible for queries due to several reasons including: (1) large log files resulting in high disk usage and I/O failures; (2) excessive CPU load; (3) excessive number of clients trying to query MDS; (4) network failures; and (4) LDAP server failures. In order to provide a reliable directory service in a production grid environment, we need to detect, report, and manage these MDS faults. Figure 3 describes the architecture of an MDS fault manager based on our grid monitoring and management components. Each host running a LDAP server for the MDS contains a monitor and a fault manager. The monitor periodically invokes sensors to collect information on disk usage, CPU usage, number of active TCP connections to the MDS host, and the status of the LDAP server process. This information is received by the local fault manager which checks this information against predefined fault conditions. If a fault condition occurs, the fault manager uses
242 actuators to take the specified actions. For example, if the LDAP log files exceed their allocated disk space, older log files are moved to tape or if the LDAP server process disappears, the LDAP server is restarted. The fault manager is a separate process from the monitor for security reasons: the fault manager requires root privileges to start the LDAP server and therefore the fault manager should be as simple as possible for verification. MDS fault manager host Sensor
Actuators
MDS monitor/fault manager Event service (ES)
MDS host
MDS based on an LDAP server
Local monitor Sensors ES
Local Fault manager Actuators ES
MDS based on an LDAP server
Local monitor
ES Sensors
MDS host
Local Fault manager ES Actuators
Fig. 3. Architecture of an MDS fault manager using grid monitoring infrastructure.
Much of the monitoring and fault management in this example takes place on the local machine, but a remote monitor and fault manager is used to monitor the hosts that are running the LDAP servers. The local monitor on the LDAP server host is sending periodic heartbeat messages to the MDS fault manager on a remote host. If the MDS fault manager stops receiving heartbeats from a local monitor, it will see if the host running the local monitor can be contacted. If the host is not accessible and does not become accessible within a specified period, an email is sent to the MDS administrators so that they can correct this problem. Figure 4 depicts the temporal analysis of trace data obtained from a four day long test of MDS fault manager. Clearly, the inter-arrival times of a majority of heartbeat sensor messages at the MDS fault manager are close to their actual sampling period of 10 sec with only a few exceptions that exceed timeout value of 12 sec. Using this consistency in inter-arrival times, some of the existing fault management facilities rely on periodic heartbeats and use “unusual” delay in the arrival of these messages to establish fault occurrence [14]. For this test, using a heartbeat based approach alone would have erroneously detected this late arrival as a failure. The MDS fault manager uses a ping sensor to confirm if the MDS host is actually unreachable and distinguish a failure from late-arriving heartbeat. In the case shown in Figure 4(a), it was simply a latearriving heartbeat. Figure 4(b) shows that the available disk space remained below the
243 minimum value of 100 MBytes during this experiment; so no faults occurred. Figure 4(c) shows that most of the time, the number of TCP connections remained below an arbitrarily selected limit of 40. 5
22
1.42
x 10
Free disk space (KB)
Inter-arrival time (sec)
1.4 20
18
16
14
Timeout = 12 sec 12
1.38
1.36
1.34
1.32
1.3
1.28
1.26
1.24
10
0
0.5
1
1.5
2
2.5
3
1.22
3.5
0
0.5
1
1.5
2
2.5
5
3.5 x 10
Time (sec)
(a) “heartbeats”
Number of TCP connections
3
5
x 10
Time (sec)
(b) Free disk space 45
Maximum connections = 40
40
35
30
25
20
0
0.5
1
1.5
2
2.5
3
3.5 5
x 10
Time (sec) (c) TCP connections
Fig. 4. Temporal analysis of three types of sensor messages sent to the central MDS fault manager during a four day long test. A sensor time period of 10 sec is used. (a) A majority of the heartbeat messages are received by the fault manager within a 12 sec allowable interarrival time. (b) Free disk space remains above the 100 MB limit. (c) Number of TCP connections exceeded the limit for a small interval of time.
3.2 Monitoring and Fault Management of a Parameter Study Application Parameter studies are often considered suitable applications for distributed computing platforms due to their coarse-grain parallelism. For this parameter study application, sensors monitor processes state, free disk space, file staging, host status, and application execution progress. Monitoring is needed to detect faults related to host accessibility, disk space availability, and application process status during an execution. In this subsection, we describe how to use our infrastructure to perform
244 monitoring and fault management for a parameter study application. Figure 5 depicts the architecture of a monitoring and fault notification system for a parameter study application. The front end of the parameter study application, called ILab, distributes the individual processes on multiple parallel systems in a computational grid. A shell script on the front-end host of each parallel system determines the process IDs for relevant processes and uses a command-line implementation of process status sensor, which periodically sends the process state information from front-end host to the ILab host. A disk space sensor is also invoked to monitor the disk usage. This process and disk usage information is used by the ILab front-end to determine if a process has terminated or excessive disk space has been used. In case of process termination, ILab uses a separate script to examine the process output file to determine if it was terminated normally or abnormally. In case of an abnormal termination, ILab can try to further analyze the cause of this condition and may alter the future course of job submissions. Similarly, if the disk usage on a particular file system exceeds a specified value, subsequently launched processes are configured to write their output to a different file system. Thus using monitoring and fault detection through grid monitoring components, selected fault conditions can be automatically managed.
Parameter study host ILab GUI
Event service (ES)
Front-end host of a parallel system shell script activated by a cron job Sensors
ES
Front-end host of a cluster of workstations shell script activated by a cron job ES
Sensors
Fig. 5. Architecture of a monitoring and fault reporting facility for a parameter study application.
We tracked the disk space usage and status of a particular application process during one experiment with the parameter study application. Figure 6 presents plots of this information over the application execution time. Using this information, the ILab front-end detects the condition when a particular process terminates and it can proceed with its test to decided whether or not it terminated normally.
245 7
4.74
Free disk space (KB)
Inter-arrival time (sec)
5.35
5.3
5.25
5.2
5.15
5.1
0
100
200
300
400
500
600
700
800
900
4.735
4.73
4.725
4.72
4.715
4.71
1000
x 10
0
100
200
Execution time (sec)
300
400
500
600
700
800
900
1000
Execution time (sec)
(a) “Heartbeats”
(b) Free disk space 2
Process status
1.5
1
0.5
0
−0.5
−1
0
100
200
300
400
500
600
700
800
900
Execution time (sec) (c) Process status
Fig. 6. Disk usage and process status information collected during the execution of a parameter study application. (a) Inter-arrival times of heartbeat messages. (b) Free disk space. (c) Status of one of the application processes. A value of 1 indicates that the process is running and 0 indicates that it has terminated.
In addition to monitoring system level resource usage, our monitoring and fault management infrastructure can dynamically monitor application-specific events occurring in distributed processes. This is accomplished through internal sensors and the event service API. Distributed application processes are instrumented by embedding internal sensors in the code to publish desired information, which is collected by a client. Client process subscribes to the publisher to asynchronously receive the desired event data. This is essentially a traditional application monitoring scenario, which is implemented using a publisher-subscriber paradigm. This type of information can be used for performance monitoring or to allow client to steer the application.
246
4
Discussion
In this extended abstract, we outlined a grid monitoring and fault management infrastructure to provide modular, retargettable, and extensible data collection components to enable higher level fault handling and management services in a computational grid. In addition to performing the traditional task of a monitoring system to gather system- and application-specific information, this infrastructure can be employed in high level data consumers that use monitored information for accomplishing fault management, decision making, or application steering tasks. We presented two applications of this monitoring infrastructure to provide such services for specific distributed applications. Currently, our infrastructure uses a publisher-subscriber paradigm for event notification. We plan to enhance it to other data forwarding models, such as querying archives of monitored information. We will also use rule-based fault detection mechanisms that are based on prediction of future system states through appropriate time-series models. Fault detection and management mechanisms are based on characterization and understanding of conditions that lead to failures. We are using application and system level monitoring to characterize fault occurrences and to glean better understanding of conditions that lead to faults. References [1]
[2] [3] [4]
[5]
[6]
[7]
[8]
Devesh Bhatt, Rakesh Jha, Todd Steeves, Rashmi Bhatt, and David Wills, “SPI: An Instrumentation Development Environment for Parallel/Distributed Systems,” Proc. of Int. Parallel Processing Symposium, April 1995. Big Brother System and Network Monitor, available from http://maclawran.ca/ bb-dnld/bb-dnld.html. Chris Brooks, Brian Tierney, and William Johnston, “Java Agents for Distributed System Management,” LBNL Technical Report, Dec. 1997. H. Chu and K. Nahrstedt, “CPU Service Classes for Multimedia Applications,” Proc. of IEEE Multimedia Computing and Applications, Florence, Italy, June 1999. Peter Dinda and David O’Hallaron, “An Evaluation of Linear Models for Host Load Prediction,” Proc. of the 8th IEEE Symposium on High-Performance Distributed Computing (HPDC-8), Redondo Beach, California, Aug. 1999. Steven Fitzgerald, Ian Foster, Carl Kesselman, Gregor von Laszewski, Warren Smith, and Steven Tuecke, “A Directory Service for Configuring High-Performance Distributed Applications,” Proc. of the 6th IEEE Symp. on High-Performance Distributed Computing, 1997, pp. 365–375. Martin Gergeleit, J. Kaiser, and H. Streich, “DIRECT: Towards a Distributed Object-Oriented Real-Time Control System,” Technical Report, 1996. Available from http://borneo.gmd.de:80/RS/Papers/direct/direct.html. David J. Korsmeyer and Joan D. Walton, “DARWIN V2 — A Distributed Analytical System for Aeronautical Tests,” Proc. of the 20th AIAA Advanced Measurement and Ground Testing Tech. Conf., June 1998.
[9]
[10]
[11]
[12]
[13]
[14]
[15]
[16]
[17]
247 F. Lange, Reinhold Kroger, and Martin Gergeleit, “JEWEL: Design and Implementation of a Distributed Measurement System,”. IEEE Transactions on Parallel and Distributed Systems, 3(6), November 1992, pp. 657-671. Also available on-line from http://borneo.gmd.de:80/RS/Papers/JEWEL/ JEWEL.html. Craig A. Lee, Rich Wolski, Ian Foster, Carl Kesselman, and James Stepanek, “A Network Performance Tool for Grid Environments,” Proc. of SC’99, Portlan, Oregon, Nov. 13–19, 1999. Clifford W. Mercer and Ragunathan Rajkumar, “Interactive Interface and RTMach Support for Monitoring and Controlling Resource Management,” Proceedings of Real-Time Technology and Applications Symposium, Chicago, Illinois, May 15-17, 1995, pp. 134–139. Barton P. Miller, Jonathan M. Cargille, R. Bruce Irvin, Krishna Kunchithapadam, Mark D. Callaghan, Jeffrey K. Hollingsworth, Karen L. Karavanic, and Tia Newhall, “The Paradyn Parallel Performance Measurement Tool,” IEEE Computer, 28(11), November 1995, pp. 37–46. Huseyin Simitci, Daniel A. Reed, Ryan Fox, Mario Medina, James Oly, Nancy Tran, and Guoyi Wang, “A Framework for Adaptive Storage Input/Output on Computational Grids,” Proc. of the 3rd Workshop on Runtime Systems for Parallel Programming (RTSPP), April 1999. Paul Stelling, Ian Foster, Carl Kesselman, Craig Lee, and Gregorvon Laszewski, “A Fault Detection Service for Wide Area Distributed Computations,” Proc. of the 7th IEEE Symp. on High Performance Distributed Computing, 1998, pp. 268-278. Brian Tierney, William Jonston, Brian Crowley, Gary Hoo, Chris Brooks, and Dan Gunter, “The NetLogger Methodology for High Performance Distributed Systems Performance Analysis,” Proc. of IEEE High Performance Distributed Computing Conference (HPDC-7), July 1998. Rich Wolski, Neil T. Spring, and Jim Hayes, “The Network Weather Service: A Distributed Resource Performance, Forcasting Service for Metacomputing,” Journal of Future Generation Computing Systems, 1999. Jerry C. Yan, “Performance Tuning with AIMS—An Automated Instrumentation and Monitoring System for Multicomputers,” Proc. of the Twenty-Seventh Hawaii Int. Conf. on System Sciences, Hawaii, January 1994.