Journal of Computational Biology and Bioinformatics Research Vol. 3(1), pp. 8-14, January 2011 Available online http://www.academicjournals.org/jcbbr ISSN-2141-2227 ©2011 Academic Journals
Full Length Research Paper
An insight into blood clotting disorders in humans Parul Johri1*, Sagar Nagare1, Kakumani Venkateswara Swamy2 and Chitta Suresh Kumar2 1
Department of Biotechnology and Bioinformatics, Dr. D. Y. Patil University, Navi Mumbai, India. Bioinformatics Facility, Department Biochemistry, Sri Krishnadevaraya University, Anantapur, Andhra Pradesh, India.
2
Accepted 19 November, 2010
The structure of thrombin protein Oncorhynchus mykiss had not yet been resolved by NMR or X-ray diffraction method. In the present work, we have modeled the structure of protein using Modeller 9v1, taking human thrombin protein as the template. Furthermore, the antithrombin protein was docked with the best model generated by R-dock and Z-dock module of INSIGHT II and the nine potential amino acids involved in anchoring of antithrombin with thrombin were identified as: Leu3, Trp27, Asn120, Glu123, Pro133, Ile148, Ser152, Gly204 and Phe215, respectively. The study also showed surface complimentarily between O. mykiss thrombin and antithrombin which can be helpful for designing new antithrombin molecules for the treatment of blood clotting disorders in humans. Key words: Antithrombin protein, homology modeling, r-dock, thrombin, z-dock. INTRODUCTION The mechanism of coagulation needs to be clearly understood for determining the preoperative bleeding risk to patients undergoing surgery and managing haemostatic therapy preoperatively. The coagulation cascade of hemostasis has two pathways, the contact activation pathway (formerly known as the intrinsic pathway), and the tissue factor pathway (formerly known as the extrinsic pathway), which lead to fibrin formation. It was previously thought that the coagulation cascade consisted of two pathways of equal importance joined to a common pathway. It is now known that the primary pathway for the initiation of blood coagulation is the tissue factor pathway (Tanaka et al., 2009). The pathways are a series of reactions, in which a zymogen (inactive enzyme precursor) of a serine protease and its glycoprotein co-factor are activated to become active components that then catalyze the next reaction in the cascade, ultimately resulting in cross-linked fibrin. Coagulation factors are generally indicated by roman numerals, with a lowercase ‘a’ appended to indicate an active form. The coagulation factors are generally serine proteases (enzymes). The main role of the tissue factor
*Corresponding author. E-mail:
[email protected].
pathway is to generate a "thrombin burst," a process by which thrombin, the most important constituent of the coagulation cascade in terms of its feedback activation roles, is released instantaneously. Anti-coagulation factor VIIa (FVIIa) circulates in a higher amount than any other activated coagulation factor. The contact activation pathway begins with formation of the primary complex on collagen by high-molecularweight kininogen (HMWK), prekallikrein, and factor XII (FXII) (Hageman factor). Prekallikrein is converted to kallikrein and FXII becomes activated factor XII (FXIIa). FXIIa converts factor XI (FXI) into activated factor XI (FXIa). Activated factor XI (XIa) activates factor IX (FIX), which with its co-factor activated factor FVIII (FVIIIa) form the tenase complex, which activates factor X (FX) to activated factor X (Fxa). Thrombin has a large array of functions. Its primary role is the conversion of fibrinogen to fibrin, the building block of a hemostatic plug. In addition, it activates Factors VIII and V and their inhibitor protein C (in the presence of thrombomodulin), and it activates Factor XIII, which forms covalent bonds that crosslink the fibrin polymers that form from activated monomers (Vine 2009). The serine protease thrombin plays pivotal roles in activation of additional serine protease zymogens (inactive enzymatic precursors), co-factors, and cell-
Johri et al.
9
Figure 1. Alignment of the amino acid sequences of O. mykiss thrombin Homo sapience thrombin PDB: 1JWT. * strong similarity, : Weak similarity, – gap between alignment of both the sequences.
surface receptors. The thrombin generation is closely regulated to achieve locally rapid haemostatic effect subsequent to injury without causing uncontrolled systemic thrombosis (Samama, 2008). The prothrombin complex concentrates are haemostatic blood products containing four vitamin K-dependant clotting factors (II, VII, IX and X). They are useful, reliable and fast alternative to fresh frozen plasma for the reversal of the effects of oral anticoagulant treatments (vitamin K antagonists). These are sometimes used for factor II or factor X replacement in patients with congenital or acquired deficiencies (Gumulec et al., 2009; Mackman et al., 2007). Thrombin receptor activation mechanisms are: Direct activation and transactivation. In direct activation, soluble thrombin directly cleaves the extracellular domain of the receptor to unmask receptor activation. In transactivation, soluble thrombin, in low concentrations, interacts with the first receptor and the thrombin-receptor complex itself serves as an enzyme to cleave the second receptor (Esmon, 1989, 2008). Till date, the structure of the thrombin protein had not yet been resolved by any of the structure prediction method like NMR or X ray diffraction. Without the structural details of the protein, it is very difficult to understand antithrombin interactions. In the present work, we have modeled the Oncorhynchus mykiss thrombin protein, which is structurally very similar to human thrombin protein, and analyzed antithrombin interactions using In-silico molecular modeling techniques. Thrombin is an endolytic serine protease that selectively cleaves the Arg - Gly bond of fibrinogen to form fibrin and release fibrinopeptides A and B. To understand the blood clotting
in lower animals, we have selected the animal model of O. mykiss for studying its thrombin and antithrombin interactions. However, due to unavailability of thrombin structure for the organism in the Protein Data Bank, we have followed a in silico approach to model this protein using homology modeling technique and investigated the binding mode of antithrombin protein. MATERIALS AND METHODS Homology modeling for O. mykiss thrombin protein (GI: 213487) was done using MODELLER 9v1 (Windows Platform) (Altschul et al., 1990; Lévesque et al., 2001; Thompson et al., 1994; Fiser and Sali, 2003). Nine models were generated, using Homo sapiens thrombin (1JWT) as template. (Figure 1 in supplementary material). All the generated models were validated using PROCHECK (Laskowski et al., 1993). After validation, model 09 was found to be the best model, and was further used for active site analysis. The RMSD of the structure was calculated using SPDBV 4.01 that came out to be 3.7 Å (Guex and Peitsch, 1997). The active site on the modeled protein was identified with the amalgamation of two approaches namely, superimposing the modeled structure of O. mykiss on the H. sapiens thrombin protein using INSIGHT II (Unix Platform), and also by the active site finder module of INSIGHT II, which provides the number of hollow cavities that can be the potential active site. Finally, the binding mode of thrombin of O. mykiss was studied by docking strategies. Antithrombin protein of human (2AX2) was used as a ligand (Lange et al., 2006). The energy of both the proteins was minimized with CHARMM force field (Brooks et al., 1983). Furthermore, the channel surface mapping was done using multi channel surfaces (MCS) module in INSIGHT II with a 1.4 Å probe radius. The docking of antithrombin protein with modeled thrombin was achieved using traction beam docking (TBD) and protein - protein docking technique with z-dock module with the
10
J. Comput. Biol. Bioinform. Res.
Table 1. Geometric parameters of the nine thrombin models developed by MODELLER9v1 and statistics of PROCHECK.
Model no.
Core region (%)
Allowed regions (%)
Generously allowed region (%)
1 2 3 4 5 6 7 8 9
80 82 80 80 81 81 79 78 82.5
17 14 16 18 16 10 14 15 16
2 3 2 1 2 4 3 4 1
Disallowed region (%) 1 1 2 1 1 5 4 3 0.5
Bad contacts
G factor
M/c bond lengths
M/c bond angles (%)
Planar groups (%)
1 2 1 2 3 2 1 2 0
-0.15 -0.17 -0.14 -0.16 -0.14 -0.13 -0.12 -0.15 -0.16
90 81 85 84 82 83 81 82 89
73 70 75 80 72 78 71 75 86
100 95 94 90 85 72 70 75 100
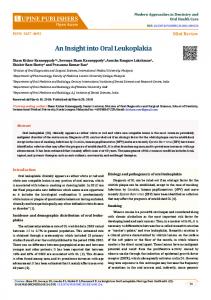
Figure 1. Ramachandran plot showing the phi/psi values of the modeled thrombin protein. Red color- most favorable regions, yellow color region- allowed region, pale yellow- generously allowed region and white color- disallowed regions.
default parameters (Chen et al., 2003). The models were further refined using r-dock. The model with best score was finally selected (Li et al., 2003).
RESULTS Nine protein models were generated using Modeller 9v1 considering loops and site specific residues. All nine models were subjected to energy minimization with
CHARMM force field of DISCOVER module. Refined model was validated with PROCHECK and the values are depicted in Table 1. Amongst the nine models generated, model 09 was found to give better results as compared to the other eight models. Ramachandran plot for the model 09 shows residues falling in: Core regions, favorable allowed regions, generously allowed regions and disallowed regions as 82.5, 16, 1.0 and 0.5%, respectively (Figure 1). Overall plot gave 99.5% of residues within favorable
Johri et al.
Figure 2. Homology model 9 of the thrombin protein. Yellow color with sheets, pink color with helices and blue color with 310 helices cyan color turns, white color denotes loops.
Figure 3. Binding mode of antithrombin into the thrombin protein of O. mykiss (yellow balls) and antithrombin (red balls) (front view).
regions and only two residues, Ala10 and Arg13 out of the 305 (0.05%) were found in disallowed regions of Ramachandran plot. This showed that model No. 9 can be taken for further study (Figure 2). We used SPDBV 3.7 for calculating the root mean square deviation between the backbone C atoms of the
11
Figure 4. Antithrombin of H. sapience (red balls) and modeled thrombin structure in tubes in binding mode (back view).
modeled O. mykiss protein and 1JWJ, and found to be 3.7 was 0.56Å. The best structure modeled was then energy minimized using CHARMM force field by the Builder module of molecular simulation option of INSIGHT II. The protocol for energy minimization was as follows: Steepest descents (1000 cycles), conjugate gradient methods (1000 cycles) and Newton’s methods (1000 cycles). The final model had -240.6 kcal energy. After energy minimization, the protein-protein docking of modeled thrombin structure with 2AX2 was performed using the z-dock module of INSIGHT II. The z-dock scoring function was obtained as pairwise shape complementarily (PSC) while the r-dock score on the CHARMM force field. The binding modes were based on electrostatic interaction and desolvation energy of z-dock results. Z-dock pro filters all the hits obtained from z-dock conformations with the cutoff of 0.4Å. R-dock module was applied for optimizing a selected range of poses from filtered z-dock output file by running a CHARMM optimization. The 71 pose (Table 1 supplementary information) was found to be the best one with the following residues involved in protein-protein interaction: Leu3, Trp27, Asn120, Glu123, Pro133, Ile148, Ser152, Gly204 and Phe215. Figure 3 shows the front and Figure 4 shows the back view of the complex along with proteinprotein interaction. DISCUSSION Comparative protein modeling is increasingly gaining interest since it is of great assistance during the rational design of mutagenesis experiments. The availability of
12
J. Comput. Biol. Bioinform. Res.
Table 1. Comparisons of energy partitioning of the thrombin and antithrombin models.
Index
First: ELEC
First: VDW
First: ACE
Second: ELEC
Second: VDW
Second: ACE
1 2 3 4 5 6 7 8 9 10 11 12 13 14 15 16 17 18 19 20 21 22 23 24 25 26 27 28 29 30 31 32 33 34 35 36 37 38 39 40 41 42 43 44 45 46 47 48 49 50
1.01928 7.13E-02 0.760335 0.711845 0.368667 -6.02233 -4.371 0.891797 -1.19519 -1.52123 -0.326596 6.70E-02 -3.6275 -2.38796 -0.779055 0.142032 -0.152473 -3.82267 -2.97702 -4.30691 1.17375 -2.64026 -0.435228 -2.71088 -5.19762 -1.76E-02 -1.75131 -1.11241 2.05465 0.111097 0.532499 2.48308 -3.02588 -1.46E+00 2.24883 -0.706516 0.254395 -2.70567 -2.70567 -3.20533 1.25129 0.264408 3.22347 1.21148 -0.422204 2.8659 -3.45832 2.27314 -0.383874 0.266847
-83.855 -78.217 -103.78 -98.415 -79.923 -90.621 -77.751 -87.119 -74.081 -78.518 -82.709 -96.738 -86.396 -91.277 -29.356 -76.608 -97.516 -79.825 -41.149 -73.812 -65.171 -104.94 -92.408 -79.854 -80.177 -85.764 -83.473 -88.057 -60.924 -76.123 -96.633 -59.403 -70.949 -37.003 -78.046 -83.253 -72.491 -71.963 -71.963 -76.521 -101.97 -87.092 -91.395 1047 -948 -68.447 -65.133 -75.598 -7152 2.42759
6.77 21.42 11.28 9.38 19.26 12.01 8.46 19.41 18.24 8.18 21.59 19.79 8.02 18.68 8.21 22.36 24.67 16.7 9.9 9.14 9.7 10.18 19.6 9.94 10.92 8.78 17.33 22.08 -4.17 14.51 18.2 -3.46 8.87 6.79 24.59 15.15 20.85 19.97 19.97 15.57 10.91 10.43 2.8659 -3.4583 2.27314 -449 14.825 10.1651 4.35569 -89.651
28.9216 -5.4253 -5.6824 -6.3226 7.66821 -15.777 -15.526 14.5822 6.78098 26.2327 -11.043 11.5243 13.2991 7.97121 -2.4955 -2.9611 -7.1571 1.28911 14.3042 -12.297 -16.609 -3.1532 11.3764 -15.026 -11.969 -4.5681 13.7749 -12.139 11.2079 9.74233 7.84957 13.1424 14.8738 -17.56 -7.6378 12.138 15.764 16.9473 0.0012 -5.7807 -6.0359 -6.77 -68.447 -65.133 -75.598 -0.3839 0.26685 0.34029 -64.718 24.71
-87.241 -80.721 -103.93 -99.984 -88.306 -88.112 -85.583 -88.346 -90.955 -83.878 -83.32 -95.748 -89.408 -88.019 -85.281 -80.282 -94.146 -82.398 -65.896 -79.978 -65.789 -100.16 -90.086 -86.629 -82.496 -89.549 -90.337 -84.985 -67.18 -78.733 -94.796 -67.472 -79.361 -69.242 -87.664 -83.996 -93.206 -82.336 -80.42 -79.605 -103.43 -98.019 -4.24 14.82 10.16 -71.57 -86.857 -90.426 -5.49 -520233
6.18 21.54 11.5 10.12 19.06 12.41 7.96 19.03 17.95 7.67 21.45 19.14 7.77 18.83 9.15 22.28 24.07 16.77 9.67 9.45 9.6 10.94 18.95 9.59 11.1 8.97 16.93 22.2 -4.5 14.65 18.3 -4.39 8.13 7.45 24.21 15.04 20.51 19.45 12.29 15.16 10.76 10.61 12.4095 -13.286 -9.4149 7.77 19.59 -6.3681 10.0478 -88.257
Second: ELEC+First:ACE 35.6916 15.9947 5.59763 3.05737 26.9282 -3.767 -7.0663 33.9922 25.021 34.4127 10.547 31.3143 21.3191 26.6512 5.71446 19.399 17.513 17.9891 24.2042 -3.157 -6.9092 7.02683 30.9764 -5.0864 -1.0489 4.21186 31.1049 9.9407 7.0379 24.2523 26.0496 9.6824 23.7438 -10.77 16.9522 27.288 36.614 36.9173 19.97 9.78931 4.87411 3.66002 -75.301 -73.661 -76.978 -0.368 5.371 -92.44 -66.593 24.51
Johri et al.
Table 1. Contd.
51 52 53 54 55 56 57 58 59 60 61 62 63 64 65 66 67 68 69 70 71 72 73 74 75 76 77 78 79 80 81 82 83 84 85 86 87 88 89 90 91 92 93 94 95 96 97 98 99 100
0.34029 4.35569 2.42759 -1.39771 -4.23625 -0.426688 0.776786 -3.05859 -0.461046 1.69415 -0.461046 1.69415 8.89848 -73.2991 -74.5256 -1.20488 1.65E-02 1.58871 -4.4345 0.403804 3.23762 -0.585221 -0.852606 3.23762 -0.585221 3.23762 -0.86017 -0.625388 0.920641 0.567431 5.79E-02 -1.25044 -2.0713 -2.18725 1.20686 0.699904 0.281504 1.20686 0.699904 0.281504 -0.222227 1.68769 -1.41945 -0.222227 1.44938 -3.38229 -2.20916 1.21651 -3.14873 -3.23081
-54 -64.55 -89.651 -86.579 -80.943 -89.779 1.69415 -72.007 -74.812 -85.108 -759 -2.1879 -85.6 15.51 22.19 -59.431 -82.554 -73.299 -75.388 -65.043 -74.42 -95.629 -94.584 -74.42 -95.629 -74.42 -45.174 -83.255 -65.959 70.0444 -71.082 -74.526 -65.005 -97.96 -80.569 -59.622 83.8491-80.569 -59.622 -83.849 -91.475 -77.213 -89.75 -91.475 -61.912 -74.599 -78.62 -52.286 -79.036 -73.298
-1.3977 -4.2363 -0.4267 18.0466 11.8258 -0.4611 -85.108 8.96 5.98 1.69415 -24.921 -89.538 1.69415 8.89848 -7.4298 30.07 26.47 15.51 20.47 -4.27 20.43 10.18 7.6 20.43 10.18 20.43 8.34 7.55 26.59 4.87 11.71 22.19 12.93 7.38 19.7 16.58 19.14 19.7 16.58 19.14 21.91 15.88 5.89 21.91 9.64 22.38 19.03 7.62 21.54 13.97
-86.579 -80.943 -89.779 0.77679 -3.0586 74.8113 -2.1879 19.1395 -24.46 -85.108 -95.641 -87.352 -2.1879 -77.989 -78.556 -5.5472 -6.1258 8.89848 -8.8429 1.60433 18.9617 3.23002 -18.035 15.4758 3.23002 15.4758 -18.03 -9.2091 -1.3051 -12.88 82 -7.4298 21.8927 16.2724 10.4356 -13.139 13.3934 10.4356 -13.139 13.3934 4.41301 11.8388 -3.3334 3.48324 -3.0252 -7.6016 9.88363 15.7976 -6.0083 20.3782
18.04 11.82 8.38 -61.799 -72.007 5.98 -87.352 -0.4267 -71.181 -0.461 -71.186 1.58871 -89.538 14.53 22.48 -76.877 -91.37 -77.989 -80.794 -72.642 -79.101 -97.297 -93.54 -93.903 -97.297 -93.903 -62.188 -89.557 -89.292 -80.112 -1.2504 -78.556 -76.487 -92.197 -83.813 -62.21 -82.763 -83.813 -62.21 -82.763 -64.883 -86.166 -81.209 -83.618 -72.889 -75.513 -79.87 -92.389 -79.167 -77.479
First ELEC: First electrostatic potential; First VDW: First Vander Wal potentials. First ACE: Desolvation energy.
6.81777 3.09053 -7.4247 8.65 8.96 -24.46 10.91 -89.779 5.57 -759 1.69415 -73.299 -87.352 24.4085 14.7602 29.69 26.02 14.53 20.51 -3.62 19.52 10.2 8.01 19.97 10.2 19.97 9.25 7.95 26.39 5.3 -74.526 22.48 12.95 6.61 19.14 17.07 18.97 19.14 17.07 18.97 21.55 15.54 4.62 21.86 8.84 22.9 18.47 7.41 21.35 13.53
-85.805 -84.9 -98.54 -15.455 19.1394 -71.181 8.74208 8.59 0.77678 -24.46 -85.6 15.51 1.58871 20.3442 3.4406 24.5228 20.3442 24.4085 11.6271 -2.6657 39.3917 13.41 -10.435 35.9058 13.41 22.342 -9.6896 -1.6591 25.285 -8.0095 22.19 14.7602 34.8227 23.6524 30.1356 3.4406 32.5334 30.1356 3.4406 32.5334 26.323 27.7188 2.55658 25.3932 6.61476 14.7784 28.9136 23.4176 15.5317 34.3482
13
14
J. Comput. Biol. Bioinform. Res.
designing new antithrombin molecule to arrest the bleeding in patients suffering from clotting disorders, as the template protein was a human thrombin. REFERENCES
Figure 5. O. mykiss protein binding pocket of ILE 4, TRP 27, ASN 120, GLU 123, PRO 133, ILE 148, SER 152, PHE 215 in magenta color and antithrombin in stick model. Antithrombin of ARG 34 and ARG 4 are showing polar hydrogen bonding with SER 152 and ASN 120, respectively.
this method, and the resulting models, has however been restricted by the availability of expensive computer hardware and software. To overcome these limitations, programs like Modeller had been developed, which can generate protein models based on homology. Furthermore, two protein docking algorithms, designed to operate in succession: A rigid-body docking program, zdock, and a refinement program, r-dock are used for docking studies. Bleeding is one of the most feared complications of anticoagulant therapy, and is a risk of all anticoagulants. Whereas, unfractionated heparin and warfarin, the oldest and most widely used anticoagulants have specific antidotes for their anticoagulant effect, many of the newer agents (direct and indirect inhibitors of coagulation factors Xa and/or IIa) do not have specific antidotes to reverse their actions. The use of novel anticoagulants is further complicated by a lack of easily available laboratory tests to measure their levels and thereby optimize their benefit and safety in clinical practice. Our In silico modeling studies provides a comprehensive picture of the 3-D structure of O. mykiss protein. The docking studies and the active site analysis proposed the specific contacts with: Leu3, Trp27, Asn120, Glu123, Pro133, Ile148, Ser152, Gly204 and Phe215 residues (Figure 5). This provides a different perspective for
Altschul SF, Gish W, Miller W, Myers EW, Lipman DJ (1990). Basic local alignment search tool. J. Mol. Biol., 215: 403-410 Brooks BR, Bruccolerr RE, Olafson BD, States DJ, Swaminathan S, Karplus M (1983). CHARMm: A program for macromolecular energy minimization and dynamics calculations. J. Comp. Chem., 4: 187217. Chen R, Li L, Weng (2003). ZDOCK: An initial stage protein docking algorithm. Proteins, 52: 80-87. Esmon CT (1989). The roles of protein C and thrombomodulin in the regulation of blood coagulation. J. Biol. Chem., 264: 4743-4746. Esmon CT (2008). Crosstalk between inflammation and thrombosis. Maturitas, 61: 122-131. Fiser A, Sali A (2003). Modeller: generation and refinement of homology-based protein structure models. Methods in Enzymology, 374: 461-491. Guex N, Peitsch MC (1997). SWISS-MODEL and the Swiss-PdbViewer: An environment for comparative protein modeling. Electrophoresis, 18: 2714-2723. Gumulec J, Kessler P, Procházka V, Brejcha M, Penka M, Zänger M, Machytka E, Klement P (2009). Bleeding complications of anticoagulant therapy. Vnitr. Lek., 55: 277-289. Lange UE, Baucke D, Hornberger W, Mack H, Seitz W, Höffken HW (2006). Orally active thrombin inhibitors. Part 2: optimization of the P2-moiety. Bioorg. Med. Chem. Lett., 15: 2648-2653. Laskowski RA, MacArthur MW, Moss DS, Thornton JM (1993). PROCHECK: a program to check the stereo chemical quality of protein structures. J. Appl. Cryst., 26: 283-291. Lévesque S, St-Denis Y, Bachand B, Préville P, Leblond L, Winocour PD Edmunds JJ, Rubin JR, Siddiqui MA (2001). Novel bicyclic lactam inhibitors of thrombin: Potency and selectivity optimization through P1 residues. Bioorg. Med. Chem. Lett., 11: 3161-3164. Li L, Chen R, Weng Z (2003). RDOCK: refinement of rigid-body protein docking predictions. Proteins, 53: 693-707. Mackman N, Tilley RE, Key NS (2007). Role of the extrinsic pathway of blood coagulation in hemostasis and thrombosis. Arterioscler. Thromb. Vasc. Biol., 27: 1687-1693. Samama CM (2008). Prothrombin complex concentrates: a brief review. Eur. J. Anaesthesiol., 25: 784-789. Tanaka KA, Key NS, Levy JH (2009). Blood coagulation: hemostasis and thrombin regulation. Anesth. Anal., 108: 1433-1446. Thompson JD, Higgins DG, Gibson TJ (1994). CLUSTAL W: improving the sensitivity of progressive multiple sequence alignment through sequence weighting, position-specific gap penalties and weight matrix choice. Nucleic Acids Res., 22: 4673 -4680. Vine AK (2009). Recent advances in haemostasis and thrombosis. Retina, 29: 1-7.


![Proteases in blood clotting [PDF] - Semantic Scholar](https://m.moam.info/img/260x300/proteases-in-blood-clotting-pdf-semantic-scholar_5a0009451723dd1c35a1f04b.jpg)