project was conducted in the Fairfax County, Virginia, to demonstrate applications of GIS in bus transit network planning, operations and marketing (Jia and Ford ...
An integrated GIS-based data model for multimodal urban public transportation analysis and management a
Shaopei Chen*a,b,c, Jianjun Tana,d, C. Rayb, C. Claramuntb, Qinqin Suna,c Center for GIS, Guangzhou Institute of Geochemistry, Chinese Academy of Sciences, 511 Kehua St., Tianhe District, 510630 Guangzhou, China; b Naval Academy Research Institute, F-29240 Lanvéoc-Poulmic BP600, France; c Graduate School of Chinese Academy of Sciences, 19 Yuquan Rd., Shijingshan District, 100049 Beijing, China; d Guangzhou CASample Information Technology Co., Ltd, 908 B-tower, Hi-tech Building, Tianhebei Rd, Tianhe District, 510630 Guangzhou, China
ABSTRACT Diversity is one of the main characteristics of transportation data collected from multiple sources or formats, which can be extremely complex and disparate. Moreover, these multimodal transportation data are usually characterised by spatial and temporal properties. Multimodal transportation network data modelling involves both an engineering and research domain that has attracted the design of a number of spatio-temporal data models in the geographic information system (GIS). However, the application of these specific models to multimodal transportation network is still a challenging task. This research addresses this challenge from both integrated multimodal data organization and object-oriented modelling perspectives, that is, how a complex urban transportation network should be organized, represented and modeled appropriately when considering a multimodal point of view, and using object-oriented modelling method. We proposed an integrated GIS-based data model for multimodal urban transportation network that lays a foundation to enhance the multimodal transportation network analysis and management. This modelling method organizes and integrates multimodal transit network data, and supports multiple representations for spatio-temporal objects and relationship as both visual and graphic views. The data model is expressed by using a spatio-temporal object-oriented modelling method, i.e., the unified modelling language (UML) extended to spatial and temporal plug-in for visual languages (PVLs), which provides an essential support to the spatio-temporal data modelling for transportation GIS. Keywords: Multimodal transportation network, United Modelling Language (UML), Plug-in for Visual Languages (PVLs), Geographical Information System for Transportation (GIS-T) 1.
INTRODUCTION
Transportation planners and decision-makers are increasingly considering multimodal urban transportation strategies to support sustainable transportation associated urban development (Krygsman, 2004). In particular, sustainable transportation appears that quality of public transportation is determined not only by access to main transportation modes, but also accessibility to these modes. Urban transportation systems in modern cities are usually a multimodal transit network system, covering bus, metro, road, and even walking transit networks. The modelling of such a network system relies on the ability to apprehend the diversity of transit networks that include a variety of limitations, and shape the spatial structure of the city. The requirements for an integrated GIS data model for a multimodal urban transpiration network derive from urban developments. Firstly, in a modern city, information related to existing transportation infrastructures usually needs be operated in different organizations, however, this often lead that the information is scattered. Nevertheless, from an institutional point of view the data needed by one agency is likely to be also valuable for other agencies. Accordingly, from a user point of view, being able to cope with different data sources of possibly different natures is also essential in order to provide adapted information to final end-users. For instance, different bus public companies can maintain data sets regarding their own lines for their management purposes, but for users, the combination of these data sets within an integrated multimodal transportation system is required to provide valuable route planning services. Secondly, urban transportation systems in a modern city generally rely on a large set of multimodal networks so that data should be Geoinformatics 2008 and Joint Conference on GIS and Built Environment: The Built Environment and Its Dynamics, Lin Liu, Xia Li, Kai Liu, Xinchang Zhang, Xinhao Wang, Eds., Proc. of SPIE Vol. 7144, 71442W · © 2008 SPIE · CCC code: 0277-786X/08/$18 · doi: 10.1117/12.812854 Proc. of SPIE Vol. 7144 71442W-1 2008 SPIE Digital Library -- Subscriber Archive Copy
modelled and represented with different logical views, as they may be supplied by and for different data providers or by the same provider at different time periods (Huang, 2003). Regarding types, uses and objectives, this multimodal transportation information can be modelled in different data structures and multiple formats (from structured and well standardized format to simple textual format). This is due to the fact that transportation sensors as well as users (e.g. agencies) may provide or demand different functionalities, and require different levels of aggregation and precision in their specific models (e.g. aggregated vs. disaggregated passenger flows). Considering this granularity of space, time and transportation entities is essential for integrated data model and appropriate representation. Finally, with the rapid urban development, urban transportation systems also consider other elements, such as traffic restrictions, land-use patterns, policies and travelling behaviors. As a network system, urban public transit network compasses complex spatial relationships. This often needs a topology data model to represent the relationships existing between the network components, and between the network and non-network data. Topology is a mathematical approach that allows structuring geographical data based on the properties of feature adjacency and feature connectivity and that is used to define spatial relationships. The topology data model is a fundamental component for the development of an integrated GIS-based transportation data model (Buckey, 1997). The objective of this research is to propose an improve GIS-T data model for addressing issues related the design of integrated spatio-temporal data model in the context of multimodal transportation network, such as data scatter and redundancy, low query efficiency, the topological/logical relationship definition and multiple representations. The proposed modelling method integrates multimodal data, and supports spatio-temporal object relationship definition and multiple spatial data representations. The resulting data model is expressed by using a spatio-temporal object-oriented modelling method, i.e., the unified modelling language (UML) extended with spatial and temporal plug-in for visual languages (PVLs) (Bédard, 1999), which provides an essential support to the spatio-temporal data modelling for transportation GIS. 2.
PUBLIC TRANSIT NETWORK MODELLING AND REPRESENTATION
Public transportation is a complicated transportation activity that involves many elements of society, economy, and environment. Such a system consumes a large range of geographical data (not limited to transportation domains) that are organized by complex inter-relationships. As a result, a GIS database for public transportation application should involve the transit network data, the urban road network data, dynamic data (such as service schedules), and surrounding non-network information (such as land uses, landmarks address, socio-economy, etc.). Furthermore, it should also address the relational linkages among and between these elements (Peng et al, 1995). Several efforts have been made to organize and represent the bus transit network data at a more detailed level. A pilot project was conducted in the Fairfax County, Virginia, to demonstrate applications of GIS in bus transit network planning, operations and marketing (Jia and Ford, 1999). This model considers directional bus routes and a bus transit database that includes GPS-collected stop locations. A scheme for generating an independent bus transit network from a street database for public transportation modeling was proposed (Choi and Jang, 2000). A public transportation model has been developed through making use of stops, routes and road segments to integrate data from different sources so that transit network analysis can be carried out at the route level (Zhou et al, 2000). Nevertheless, these public transportation data models are limited to consider linkages between entities of bus transit network, and did not maintain a linkage between the bus transit and road networks. The linkage between the bus and road networks has to be built up again for a purpose such as the integration and planning for multimodal public transit network. A bus stop inventory database containing information on stops with references to roads, road intersections, landmarks and surrounding areas for advanced public transportation systems has been developed (Sarasua et al, 1997). Trepanier and Chapleau (2001) also proposed an object-oriented data model for integrating bus transit data at a disaggregated level. In this data model, the network was defined with four levels of resolution, which ranged from the schematic point description to the directional routes along the streets. The bus lines and the road networks are linked at the bus stops, and directional routes can be derived in GIS when necessary. However, these models did not identify how the directional routes are constructed and maintained in the database. Huang (2003) studied a GIS-based comprehensive data model which introduced an adapting bus multi-directional routes and multi-site stops representation for transportation data integration. Huang’s model identified stop locations, bidirectional bus lines, as well as relationships among stops, directional routes and the road networks. The advantage is
Proc. of SPIE Vol. 7144 71442W-2
that the bus transit network can be easily generated or extracted from the detailed definition to meet the needs of applications at different levels of representation details. Preliminary work has been already initiated towards an integrated GIS-based data model for public transportation system in the city of Guangzhou (Chen and Tan, 2004). This public transportation GIS has been developed as a preliminary framework for the development of intelligent public transportation management system. Public trip guidance for passengers has been an area of initial interest. Such a service includes a variety of specific applications ranging from simple route planning to interactive trip planning. Above models vary in terms of the levels of details on transit network data representation and definition of relationship between transportation networks. The challenge is that an integrated concept for multimodal transit network is still lacking. Therefore, an underlying integrated data model should be proposed for enhancing integration, efficiency and representation of an integrated public transportation GIS. This integrated data model may be the core of diverse transportation analysis and management models in GIS. Its remarkable advantage is to provide an essential set of objects, features, layers, and relationships that are integrated into a seamless and logical prototype to visually present and simulate a transportation network at appropriated granularity levels (Chen et al, 2006). 3.
SPATIAL UML FOR TRANSPORTATION GIS DATA MODELLING
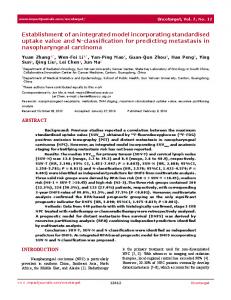
Geographic information system (GIS) is a candidate system for supporting the modelling and design of an integrated transportation information system, due to its capabilities in management, storage, manipulation, analysis and visualization of geographical information (Rodrigue et al, 2006). A specific branch of GIS concerning transportation issues is commonly referred to as Geographic Information Systems for Transportation (GIS-T) (Curtin et al, 2003; Miller and Shaw, 2001). Among the wide range of potential applications, the integration of GIS and transportation systems has received a lot of attention in recent years (Claramunt et al, 2005). Nevertheless, successful development of GIS-T implies and requires the design of a core data model to represent thematic and spatio-temporal relationships, and the underlying logical and structural properties of the transportation network components. GIS and UML oriented to spatio-temporal data modelling are increasingly used to model and represent transportation networks. Modelling public transportation data has been studied through the design of many data models. Unified Modelling Language (UML), as an object-oriented standard language developed by the Object Management Group (OMG), is used to specify, visualize, construct, and document software systems (OMG, 2005). UML has been employed by existing transportation models, such as NCHRP 20-27(2) LRS data model (Vonderohe et al, 1997), NCHRP 20-27(3) MDLRS data model (Adams et al, 2001) and the GIS-T/ISTEA PFS model (Fletcher, 1995), and providing an accepted industry object-oriented modelling notation. However, object-oriented modelling methods should be improved to handle well the complexity associated with developing spatio-temporal data models (Brodeur, 2000; Etches et al, 1998). In this context, the UML has been extended with spatial and temporal stereotypes to allow the effective modelling of a spatio temporal database during the analysis phase of software and data model development (Bédard, 1999; Liu et al, 2004; Svinterikou and Kanaroglou, 2006). Furthermore, these spatial and temporal semantics need to be converted to represent a GIS-T data model effectively. UML extension has been proposed for the design of geometric and temporal features, i.e., spatio-temporal UML. Spatiotemporal UML is an object-oriented modelling language for geographical information applications based on the UML built-in extension mechanisms (i.e. stereotypes, tagged-values and constraints), which is used to define and illustrate geospatial object classes and their inheritances and relationships by using class model diagrams (Liu et al, 2004). In this context, a spatial modelling CASE (Computer-Assistant Software Engineering) tool, i.e. Percepotry, which inserts spatial and temporal plug-in for visual languages (PVLs) into UML class diagram has been developed (Bédard, 1999). This CASE tool extends UML by using spatial and temporal “stereotype” constructs for high-level logical class modelling of spatio-temporal databases with multimedia capabilities. Spatio-temporal PVLs is a graphical-based language that represents geometric, temporal and visual properties of objects and attributes (Brodeur et al, 2000). It offers several components to define the geometry chosen for the spatial elements of a UML class diagram. The main objective is to explore a high-level abstraction to improve the analysis and logical spatio-temporal modelling without considerations of implementation issues. Spatio-temporal PVLs uses basic constructs represented by pictograms to represent the spatial and temporal characteristics of objects and attributes as a graphic view. The basic pictograms is illustrated in figure 1 can be combined or extended with cardinalities for representing geometric, temporal and visual properties of objects and attributes.
Proc. of SPIE Vol. 7144 71442W-3
2iwbIG äGOWGfL)
0
boiu{ aeoweT
S
I!Ue
aeoweT
2!WbIG IGWbOLSI !11 {ewboLs I!{7' IU29U9US
{ewboLs
{!We
qrispe {!U
Fig. 1 Basic pictograms of PVLs Figure 2 illustrates several (but not exhaustive) variations of these pictograms for representing the complex, alternative, and multiple geometry or temporality from a visual and graphic point of view. For example, a spatial-evolution ) may be used to representation a complex geometry, such as hydrographic network which is composed pictogram ( by 1-Dimention rivers and 2-D lakes. CoWbiex äeowei Hydrographic networks composed of 1-D rivers AND 2-D lakes. b!CfOäL9
VRGLUSflAG äGOW
LA
Buildings having a 0-D shape if< 1 hectare OR a 2-D shape if>1 hectare.
b!coaLsw o wnpbe 0eoweL1 OL SU !U2SUCe
VnIflbIG äGOWGLN
EXSWbI
Polygonal municipalities having a non-derivable point located downtown.
b!coaLsw o d nsuM1 O aeoweLiee OL SU !U2
3f19UX o äeou.
'j
u\\cKo
0,1
EXSWbI
1,N Road networks are composed of several lines.
VRGLUSflAG fGWb(
A bus has a durable time when it stops at a bus stop during may minutes (beginning time, ending time), OR a punctual time when it passes a bus stop as no passengers ask to get on or off.
I!'
VnIflbIG GWbOLS
b!CfOäL9
EXSWbI
A festival may have an instantaneous existence if we only consider the major event or a durable existence if we consider the duration of all events that compose the festival.
Fig. 2 Variations of PVLs (Brodeur et al, 2000) Regarding the design of our transportation model, we define, in accordance with the definitions of Perceptory, a representation of this concept into a UML class diagram: (1) A spatial or spatio-temporal stereotype of a class is placed on the left side of the name of class; (2) a spatial, spatio-temporal or descriptive (non-spatial) evolution stereotype of an attribute is placed directly nearby the defined attribute; (3) a temporal stereotype of a class is placed on the right side of object class. Figure 3 illustrates a class diagram where the spatial PVL’s pictogram ( ) represents a metro line composed by two 1-D lines with oppose directions. The existence (non-spatial evolution) pictogram ( ) of the attribute “status” is defined by “in service” and “off service”. Moreover, a spatial evolution pictogram ( ) of the attribute “construction” indicates that a metro line might be under construction and can be mapped progressively while allowing the user to record the new geometry and position as well as the corresponding periods. Furthermore, the topological relationships and logical connectivity among and between the transportation network components are explicitly representation as visual and graphic views.
Proc. of SPIE Vol. 7144 71442W-4
1,2
Metro Line
ID: String Name: String Status: {in service, off service} Construction: Length: Float
Fig. 3 UML class diagram of metro line 4.
MULTIMODAL TRANSIT NETWORK MODELLING
We applied a UML-based, object-oriented visual modelling tool integrated with spatial PVLs to propose a logical data model for a multimodal transportation network. The advantage of this approach is that the transit networks can be easily generated or extracted from the detailed definition to meet the needs of applications. Moreover, as a multimodal data model, it may facilitate many specific applications, ranging from long-range transport planning works to pre-trip planning and travel guidance. 4.1. Bus transit network modelling The bus transit networks of large cities are a complex network system with multiple relationships. The concept of bus line derives from a logical view used to describe bus moving paths on the urban streets. A bus line has two different or partly different paths that are restricted by the traffic conditions and restrictions such as one-way streets or turning restrictions. From a logical perspective, we introduce four terms, i.e. “bus route”, “bus stop”, “bus platform” and “bus route segment”, for explicitly depicting the bi-directional bus lines and stops in the bus transit network. A bus route is defined to a unidirectional path of a bus line. An individual stop site indicates one location of the generally presented “stop”. Such an individual stop site is located on or at the end of a bus route, and is defined to a “bus stop”. Accordingly, the general presented “stop” is termed as “bus platform” that contains at least two stop sites across a street. Ordinarily, a bus platform has two stop sites on opposite sides of a street and the two sites are not far away from each other along the street. However, in the real traffic situation, at a place where several bus lines meet a bus platform may have several individual stop sites. In particular, in large cities, there are many cases in which a bus platform takes more than two spatial locations due to the conjunction of many bus lines. Segments of bus route are partitioned by bus stops. Such a segment is defined to a “bus route segment”. Fundamental geographical entities of bus network are showed in figure 4. The bus transit network is composed by bus lines, platforms, routes, stop and route segments at both logical and physical views. The topological relationships between these entities are also presented, for example, each bus platform is located on or at the end of a bus line to provide boarding services for passengers. eäeiLJ ELJflf?
fl2 lUG
fl2 lUG
Bne bI9oLw
Bne bI9oLw
fl2 2fC fl2 LOflE fl2 LOflfG 2GäIJJGiJf
fl2 LOflfE
JJGiJ
Fig. 4 Geographical entities of bus network and topological links
Proc. of SPIE Vol. 7144 71442W-5
The data model involving static and dynamic entities (such as buses) is proposed by using a UML-based visual modelling approach integrated with spatial PVLs (Figure 5). The extension of class diagram with spatial PVLs allows to describe the spatio-temporal properties of the network by the specific spatial and temporal stereotypes. For instance, the geometric characteristic of a bus line is represented by a spatial pictogram (i.e., ), which describe a bus line is composed by two linear features (i.e., bus routes). A linkage between bus line and route is explicitly defined by a “composition” with a multiplicity of one-to-two (1..2). A temporal pictogram (i.e., ) at the right of class name represents a descriptive (non-spatial) evolution to indicate a date of implementation (or validation) and a date of cancellation (or abolishment) of bus line. Attribute “Status” and “CompanyName” have their own temporal characteristics, which are represented by temporal pictograms. fits out with A bus platform can be a tranferring site if it servers more than two bus lines
1 1,2
Bus Line
+ID: String +Name: String +CompanyName: String +Status: {in planning, in services, off services}
Bus Platform servers 1..n (n>=2) +ID: String 1..* +Name: String connects to a sequence of +Status: {in planning, in services, off services}
1
0
1
1..*
contains
is composed by
Bus
+ID: String +BusNumber: String +CurrentRoad: Carriageway.ID +Capacity: Float
1..2 1,N
1..* Bus Stop
Bus Route
+ID: String +Name: String +Length: Float +Stop_Number: Integer +Status: {in planning, in services, off services}
servers 1..n (n>=2) +ID: String 1..* +Name: String connects to a sequence of +Status: {in planning, in services, off services}
stops at
1..2 is composed by
1
1..* Bus Route Segment +ID: String +Status: {in planning, in services, off services}
1
is partitioned by is the ending and starting node of
Fig. 5 Logical UML model for a bus transit network 4.2. Metro transit network modelling The metro transit system can be considered and modeled similarly to bus network through a set of entities representing nodes of the network and a set of topological links between these nodes. There’s however significant differences as bus network rely on urban network while metro network is only connected though a set of points (i.e. entrances to metro stations). A Metro network also differs from a bus network as routes are fixed and schedules are precise. Figure 6 illustrates the set of entities (metro line, metro way, stop, platform, etc.) retained to describe metro transit system and topological links between these entities. A metro station owns station halls, platforms and entrances/exits, and provides ticket services. At a logical view, a metro line is defined as a fixed unidirectional path of metro car movement. In order to explicitly represent the bi-directional metro lines, a term “metro way” is introduced to represent such a path. Accordingly, a term “metro way stop” is also introduced to represent a site where passengers get on/off metro cars, and is located on or at the end of a metro way. Introducing of metro way stop implies the modelling of metro platform is contained by the definition of metro way. Accordingly, station hall and its entrances/exits may be modelled as a class, i.e. Entrance/exit Class in the data modelling. The UML class schema illustrated in figure 7 provides a visual and graphic view for illustrating the topological relationships and logical connections between the entities. The metro transit network is composed by metro lines, ways, way stops, and entrance/exits at both logical and physical views. The topological relationships between these entities are also presented, for example, each metro line is composed by two unidirectional metro ways.
Proc. of SPIE Vol. 7144 71442W-6
eLo I!Ue
fLO 2fSf!O
(
29T!0U Pall
cc\C
\
c\\
'ccw
bI9WDLW
EUPP
Ve1LO 2fSftO
fLO uue
V1LO MSA 210
S1LO MS1
EU1L9UC exil
V1LO MSA 210
Fig. 6 Geographical entities of the metro network and topological links between them A metro station can be a tranferring site if it servers more than two metro lines
A metro line may include one or more branching, passenger can transfer between lines at the junctions
transfers to 0..* 0..* 1
1,2
Metro Station
Metro Line
ID: String Name: String Status: {in service, off service} Construction: Length: Float
is on or at the end of 1..*
1..n (n>=2)
ID: String Name: String Status: {in service, off service} IsOrigin: Boolean IsJunction: Boolean Area: Float
is composed by 1
1
1..*
is composed by
is composed by
1
Entrance/exit ID: String Name: String Status: {open, close} ConnectToStreet: Carriageway ID
1..2 Metro Way
1..n (n>=2) Metro Way Stop
1
1..n (n>=2) ID: String MetroWay: MetroWay.ID is on or at the end of
1..*
stops at
ID: String Status: {in service, off service} Length: Float Original: MetroStation.ID Terminal: MetroStation.ID Stop_number: Intger
Metro Car
fits out with runs along
1..*
ID: String CurrentWay: MetroWay.ID Capacity: Float
1..*
Fig. 7 Logical UML model for a metro transit network
Proc. of SPIE Vol. 7144 71442W-7
4.3. Road network data modelling and integration In order to provide a generic road network data model for the integration and representation of multimodal transit network, we propose a transit-oriented, carriageway-based centerline road network model. In the data model, the urban road network is adapted to have a different range of representation details from a perspective of transit network data integration and representation and data modelling compatibility and standardization: (1) each roadway is divided into several segments by intersections, and each segment is referred to as a road segment; (2) a road segment is divided into two (or more) parallel strips; (3) each parallel strip, which is a one-way roadway entity, is defined as a carriageway (Fletcher, 1987); (4) a carriageway includes one or several traffic lanes with same moving direction. Therefore, the urban road network is modelled and represented at two granularity levels in accordance with the level 1 and level 2 of the GDF standard (GDF, 1995). On the basis of the level 1, a roadway is represented as a surface with specified basic entities, i.e., carriageway centerlines. An intersection is described as specified basic entities, i.e., intersection points, which are referenced to the starting or ending node of carriageway centerlines (Figure 8(a)). Based on the level 2, the same roadway and intersection are described as an aggregation of interconnecting centerlines and the starting or ending nodes, respectively (Figure 8(b)).
(a) roadway representation based on the level 1 of the GDF standard
(b) roadway representation based on the level 2 of the GDF standard Road segment centerline
Carriageway centerline
Traffic direction
Intersection point
Fig. 8 Roadway representation based on the level 1 and level 2 of the GDF standard We propose four terms “RoadSegmentCenterline” (RSCL), “CarriagewayCenterline” (CWCL), “RSCL_IntersectionPoint” (RSCL_IntPnt) and “CWCL_IntersectionPoint” (CWCL_IntPnt) to denote the road network entities, i.e., road segment, carriageway, intersection point of RSCL, intersection point of CWCL, respectively. Figure 9 presents the interrelations between the basic geometric entities of roadways.
Proc. of SPIE Vol. 7144 71442W-8
1
Road 1
1..* has
Road Segment {RSCL}
1
Carriageway {CWCL}
1..n (0