182
Int. J. Knowledge Engineering and Soft Data Paradigms, Vol. 2, No. 2, 2010
An integrated intelligent computing method for the detection and interpretation of ECG based cardiac diseases Babita Pandey* and R.B. Mishra Department of Computer Engineering, IT, Banaras Hindu University, Varanasi, UP 221005, India E-mail:
[email protected] E-mail:
[email protected] *Corresponding author Abstract: Intelligent computing system and knowledge-based system have been widely used in the diagnosis and classification of ECG based diseases. Several detection methods of ECG parameters for a particular disease have also been reported in the literature. But little effort has been made by researchers to combine both. In this work, an integrated model of rule base system for generating cases and ANN methods for matching cases in the case base reasoning model for the interpretation and diagnosis of sinus disturbances (SD) is developed. The SD is hierarchically structured in terms of their physio-psycho parameters and ECG based parameters. Cumulative confidence factor (CCF) is computed at different nodes of hierarchy. The SD considered are sinus arrest, sinus bradycardia, sinus tachycardia and sinus arrhythmia. MIT/BIH ECG database is used in the simulation study. The basic objective of this work is to enhance the computational effort with certain level of efficiency and accuracy. Keywords: artificial neural network; ANN; case-based reasoning; CBR; electrocardiogram; knowledge-based system; KBS; rule-based system; RBS. Reference to this paper should be made as follows: Pandey, B. and Mishra, R.B. (2010) ‘An integrated intelligent computing method for the detection and interpretation of ECG based cardiac diseases’, Int. J. Knowledge Engineering and Soft Data Paradigms, Vol. 2, No. 2, pp.182–203. Biographical notes: Babita Pandey is a full time Research Scholar in the Department of Computer Engineering, IT, BHU, Varanasi-221005, UP, India. She obtained her MCA degree from Indira Gandhi National Open University, India. Her research interests include expert systems (AI) and medical computing. R.B. Mishra is a Professor in the Department of Computer Engineering, IT, BHU, Varanasi-221005, UP, India. He holds a BSc (Engg), MTech and PhD. He has over 31 years of teaching experience and has published around 125 research papers and articles. He has supervised eight PhD and 25 MTech dissertations. He visited University of Bath, UK on INSA faculty exchange in 1997 from April–June. His research interests are AI and multi agent and their application, medical computing, semantic web services and e-commerce, etc.
Copyright © 2010 Inderscience Enterprises Ltd.
An integrated intelligent computing method
1
183
Introduction
QRS complexes in electromyography (ECG) are the precondition of the correlative parameters calculation and diagnosis for cardiac diseases. The automatic detection of QRS complexes in an ECG signal is the crucial first step in any automatic ECG analysis. A number of algorithmic techniques have been developed for automatic ECG signal segmentation and, in particular, QRS complex detection such as: Pan–Tompkins (PT) algorithm (Pan and Tompkins, 1985), So and Chan method (So and Chan, 1997), time recursive prediction techniques (Kyrkos et al., 1998), cross-correlation methods (Abboud and Sadeh, 1993), syntactic algorithm (Horowitz, 1975; Belforte et al., 1979), simple moving average-based computing method for real-time QRS detection (Chen et al., 2006). Wavelets based methods are also widely used for QRS detection (Li et al., 1995; Mallat and Hwang, 1992; Martinez et al., 2000). A combined approach is also used by some researchers such as: combination of algorithm proposed by Engelse and Zeelenberg (Moraes et al., 2002; Engelse and Zeelenberg, 1979) and PT and Ligtenberg-Kunt algorithms (Ligtenberg, and Kunt, 1983), combination of PT and wavelet algorithms (Meyer et al., 2006), combination of wavelet transforms and golden section search for detection of QRS complexes (Chen et al., 2007). Most of the methods mentioned above deploy a sound mathematical model and its combination with heuristics or algorithmic approaches. Several ANN based methods have been proposed for detection, diagnosis and classification of ECG arrhythmias. Ceylan and Özbay (2007) makes a comparison of principal component analysis (PCA) and wavelet transform (WT) techniques for classification ECG arrhythmias using multi-layered perceptron (MLP) with backpropagation training algorithm. Meghriche et al. (2008) developed a method based on a compound neural network (CNN), to classify ECGs as normal or carrying an atrioventricular heart block (AVB). Other methods include detection of QRS complex using support vector machine (SVM) (Mehta and Lingayat, 2007a, 2007b; Polat and Guneş, 2007). Mehta and Lingayat (2007a) describe a method for the detection of QRS using SVM. Mehta and Lingayat (2007b) proposed signal entropy based method using SVM for the detection of QRS complexes (cardiac beat) in the single lead ECG. Polat and Güneş (2007) have detected on ECG Arrhythmias using PCA and least square-SVM (LS-SVM). A number of rule-based reasoning (RBR) system used for detection and diagnosis of cardiac diseases has been mentioned in literature (Larizza et al., 1992; Assanelli et al., 1993; Bursuk et al., 1999). M-HTP system (Larizza et al., 1992) monitors heart transplant patients, ERIC (Assanelli et al., 1993) is used for diagnosis chest pain by utilisation of the main conclusions of the interpreted analysis and also some quantitative measurements in 12 leads, such as ST down-sloping or up-sloping. R wave amplitude, QRS axis etc. A medical expert system by Bursuk et al. (1999) is used to diagnosis 13 stable angina pectoris, unstable angina pectoris, acute myocardial infarction dissecan aort aneurism, acute pericarditis, hypertension, heart failure, arrhythmia, sinus tachycardia due to anaemia, other sinusal tachycardia causes, oedema due to pregnancy, and oedema due to drugs. The most important symptom chosen is chest pain. All of the system develop their reasoning based on medical knowledge represented using either frames or production rules or both and inference done by either backward or forward chaining or both.
184
B. Pandey and R.B. Mishra
Case-based reasoning (CBR) has already been applied in a number of different applications in medicine. CBR is appropriate in medicine for some important reasons; explicit experience, cognitive adequateness, automatic acquisition of knowledge, duality of objective and subjective knowledge, and system integration (Geirl and Stengel-Rutkowski, 1994). Few real CBR systems used for detection and diagnosis of cardiac diseases are reported in literature some of them are: CBR-BASED system (Salem, 2007), ChartD_2 (Reategui et al., 1997), SCINA (Haddad et al., 1997) and CASY (Koton, 1988). The present research work aims: •
To develop an integrated model of RBR, CBR and ANN in which RBR is used to hierarchically correlate the sign and symptom of the disease and also to compute cumulative confidence factor (CCF) of the diseases. CBR is used for diagnosing of four sinus disturbances such as: sinus arrest, sinus bradycardia, and sinus tachycardia and sinus arrhythmia and to find the relative importance of sign and symptoms of diseases to other diseases and ANN is used for matching process in CBR.
•
Determining the highest CCF which corresponds to sign and symptoms depicted in ECG signal and cardiovascular and psychological parameters.
•
To show the effectiveness of combining rule-based model, CBR and incorporation of ANN in CBR in the diagnosis process of ECG based cardiac diseases.
The rest of the work has been divided into the following sections. Section 2 presents the description of the various sinus disturbances with their cardiological and psychological parameters. The ECG based parameters are also mentioned in this context. Section 3 describes the rule-based model for correlating the diseases and preparation of problem description table showing the diseases with its various parameters. Section 4 contains the detection of QRS complex by ANN method. Section 5 describes the CBR model used for the detection and diagnosis of cardiac (sinus disturbances) diseases. Section 6 covers the detection and interpretation procedure with its implementation in CBR. The ANN method has been utilised for learning in CBR. Section 7 shows the results of the computation. Section 8 describes performance evaluation. Section 9 deals with the conclusion.
2
Problem description
The problem description table (Table 1) describes diseases with their two important parameters: physio-psycho parameters and ECG characteristics. Physio-psycho parameter is further divided into two parts: cardiological problem (CP) consisting of congestive heart failure (CHF), chest pain (CP), rapid heart beat (RHB) and palpitation (PA); and psychological problems (PP) consisting of dizziness (DZ), fainting (FN), anxiety (AN), fatigue (FT), confusion (CF) and light-headness (LH). The ECG characteristics also divided into three parts: 1
P wave characteristics such as: present (Pr), normal (Nr), morphology in lead (Ml) and variation cycle (Vc)
2
QRS complex (QRS) characteristics such as: present (Pr), normal (Nr), morphology in lead (Ml) and variation cycle (Vc)
An integrated intelligent computing method 3
185
P-QRS relationship (P-QRS) such as: P followed by QRS (PfolQRS), P infront of QRS (PinfQRS), P-R normal (P-R), R-R constant (R-R).
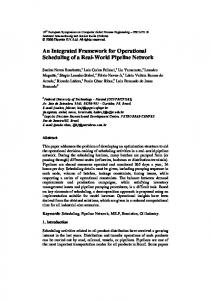
The ECG characteristics for sinus disturbances are obtained from MIT/BIH database and literature. In Table 1, the row represents the disease and the column represents their respective parameters. The sub-columns contain ‘Y’ if the corresponding symptom is present in the disease shown in the respective row otherwise ‘N’. For example, sinus arrest has cardiovascular symptoms such as: CP, RHB and PA therefore these columns contain ‘Y’ as shown in Table 1. Figure 1 corresponds to the hierarchal structure showing the parameters and their correlation for sinus bradycardia (http://www.herbchina2000.com, http://www.american heart.org/). This hierarchal structure is used for the generation (formation) of rules as being described in the next section. Similarly, the hierarchal structure showing the parameters and their correlation for sinus arrest (http://www.americanchronicle.com/), sinus tachycardia (http://www.health.discovery.com/) and sinus arrhythmia (http://www.nscardiology.com/) is drawn from Table 1. Figure 1 shows that the subject suffering from sinus bradycardia has cardiovascular problem such as: chest pain and congestive heart failure; psychological problem such as: dizziness, fainting, fatigue, light-headness and ECG parameter such as: 1
P wave characteristics: P wave present, P wave normal, normal P wave morphology, cyclic variation in P wave
2
QRS complex characteristics: QRS complex present, QRS complex normal, normal QRS complex morphology, cyclic variation in QRS complex
3
P-QRS relationship: P is in front of QRS, P-R interval normal and R-R interval constant.
Figure 1
Hierarchal structure of symptoms in sinus bradycardia
186 Table 1
B. Pandey and R.B. Mishra Problem description table
An integrated intelligent computing method
3
187
Rule-based model
The rule-based model is developed on the basis of the hierarchal structure showing the parameters and their correlation in a particular disease. Figure 2 shows the rules formed by hierarchal structure for sinus bradycardia. The CF shown in bracket is used for computing cumulative CF (CCF) of each disease. Similarly, the rules for SA, ST and SAr are formed but has not be shown in the paper because more or less repetition of rule shown in Figure 2 however the entries of the various cardiac, psychological and ECG parameters in Table 1 depicts the implication of such rule. Figure 2
Rules for diagnosing sinus bradycardia
Rules for diagnosing sinus bradycardia Rule 1: IF there is chest pain (z1) & IF congestive heart failure (z2) THEN cardiovascular problem(z) Rule 2: IF there is dizziness (z1) & IF fainting (z2) & IF fatigue (z3) & IF light-headness (z4) THEN psychological problem (z) Rule 3: IF there is cardiovascular problem (z1) & IF psychological problem (z2) THEN physio-psycho problem (z) Rule 4: IF present (z1) & IF normal (z2) & IF morphology in lead (z3) THEN P wave present (z) Rule 5: IF present (z1) & IF normal (z2) & IF morphology in lead (z3) THEN QRS complex present (z) Rule 6: IF P infront of QRS (z1) & IF P-R normal (z2) & IF R-R constant (z3) THEN P-QRS relationship exit (z) Rule 7: IF P wave present (z1) & IF QRS complex present (z2) & IF P-QRS relationship exit (z3) THEN ECG abnormality (z) Rule 8: IF there is physio-psycho problem (z1) & IF there is ECG abnormality (z2) THEN sinus bradycardia disease (z)
4
QRS detection by ANN method
An ANN based method has been utilised for the detection of QRS complex in ECG. The data used for the detection of QRS complex is MIT/BIH ECG database. Table 2 shows the parameters such as: QRS amplitude, left (+) slope, right (–) slope, QRS duration, P-QRS i.e., P wave precedes QRS and QRS-T i.e., T wave follows the QRS as input and two output parameters in ANN model. The training set consists of 33 input-output set and three testing cases are taken for the verification of the result. The computed and predicted value of two from the training set and one unknown input data set test are shown in Table 3. The output of unknown PDV is predicted by ANN method as shown in third row of Table 3 but does not have computed value. It is found the error between the predicted and computed set is within acceptable limit. QRS detection is utilised for the further process of sinus disturbances.
188
B. Pandey and R.B. Mishra
Table 2
ANN Input_Output for QRS detection
Amplitude P wave µV
Slope(+ve) Slope(–ve) V/sec V/sec
QRS duration
R-QRS
QRS-T
Output Yes
No
0.6
0.03
0.03
0.02
0.9
0.9
0.9
0.09
0.2
0.03
0.015
0.06
0.9
0.9
0.9
0.08
0.5
0.25
0.025
0.02
0.9
0.9
0.98
0.08
0.7
0.036
0.035
0.02
0.9
0.9
0.98
0.08
0.7
0.173
0.176
0.04
0.9
0.9
0.98
0.09
1.1
0.135
0.136
0.08
0.08
0.08
0.7
0.08
1.5
0.188
0.189
0.08
0.08
0.98
0.7
0.13
1.5
0.39
0.38
0.04
0.08
0.98
0.7
0.23
1
0.5
0.52
0.02
0.08
0.98
0.7
0.29
1.5
0.32
0.32
0.045
0.08
0.98
0.7
0.3
1
0.025
0.026
0.04
0.9
0.9
0.7
0.28
Table 3
Error between predicted and computed values for two known and one unknown output
Input 0.6
0.2
0.19
Figure 3
Error 0.03
0.03
0.03
0.03
0.015
0.015
0.02
0.9
0.06
0.9
0.9
0.06
0.9
0.89
0.89
Output
Computed
0.9
0.09
Predicted
0.9204
0.0883
Error
0.0204
0.017
Computed
0.9
0.08
Predicted
0.8987
0.0802
Error
0.0013
0.0002
Computed
-
-
Predicted
0.934
0.3026
Error
-
-
CBR methodologies Input case
Rule base
Case
Similarity measure
Retrieve
Case memory
Prior solution Adaptation
Copy/hybrid adapt Proposed solution
Store
An integrated intelligent computing method
5
189
CBR model
In this work, CBR model is mainly consists of knowledge acquisition and representation, retrieval, learning and adaptation which have been described in the context of the detection of sinus disturbance. Figure 3 shows the CBR methodology adapted.
5.1 Knowledge acquisition and representation This work is focused on only cardiovascular, psychological and ECG related abnormality. Some problems that categorises as cardiovascular problem, psychological problems and ECG related features are asked to user through dialogue session and the user reply is stored in a tabular form. The cases are represented using feature vector scheme. The dialogue session is shown below: Physio-psycho parameter: This parameter consists of cardiological and psychological parameter. Cardiological problem Is there chest pain?
Y: [CP = 1]
Is there congestive heart failure?
Y: [CHF = 1]
Is there rapid heart beat?
Y: [RHB = 1]
Is there palpitation?
Y: [PA = 1]
Psychological problem Is there feeling of dizziness?
Y: [DZ = 1]
Is there feeling of fainting?
Y: [FN = 1]
Is there feeling of anxiety?
Y: [AN = 1]
Is there feeling of fatigue?
Y: [FT = 1]
Is there feeling of confusion?
Y: [CF = 1]
Is there feeling of light-headness?
Y: [LH = 1]
ECG features: ECG parameter consists of P wave, QRS complex and P-QRS characteristics. P wave features Present?
Y: [Pr = 1]
Normal?
Y: [Nr = 1]
Morphology in lead?
Y: [Ml = 1]
Variation cycle?
Y: [Vc = 1]
QRS complex features Present?
Y: [Pr = 1]
Normal?
Y: [Nr = 1]
Morphology in lead?
Y: [Ml = 1]
Variation cycle?
Y: [Vc = 1]
190
B. Pandey and R.B. Mishra
P-QRS relationship features P followed by QRS?
Y: [PfolQRS = 1]
P in front of QRS?
Y: [PinfQRS = 1]
P-R interval normal?
Y: [P-R = 1]
R-R interval constant?
Y: [R-R = 1]
5.2 Case retrieval Cases are stored in a table (case-base) as: x = {x1, x2,…xn, s1, s2,…sn}, where x1, x2,…xn are n features and s1, s2,… sn are n elements of solution. The user generated patient data vector (PDV) (new case) is matched with the cases stored in a table using following formula: n
D( x, PDV ) =
∑ x , PDV i
i
i −1
where PDVi is ith feature of PDV and xi is ith feature of stored case. The case in a case-base with least distance is one that is most similar to the new case.
5.3 Learning ANN model is used for learning of new cases and situations and then to predict the response or behaviour when the same or the near by cases or situations arise.
5.4 Case adaptation The most similar case retrieved contains all the diseases in order of their confidence index (CI). The solution of the retrieved case is reused to obtain the solution of new problem. In our work, adaptation is performed at two stages. At first stage, null adaptation method is applied to the solution of the retrieved case i.e., to the selected row of Y matrix. This selected row of Y matrix contains CI of each disease. At second stage, heuristic adaptation method is deployed to obtain the most appropriate solution. The diseases with least, nearly unity and largest CI are subjected for the calculation of CCF as described in the next section. The disease having highest CCF among the selected three diseases is the diagnosed disease.
5.5 Retain (store) The matched new cases from the entries in Table 4 are stored as a part of case base.
6
Implementation
The above method is implemented using Java Language. The implementation of the system is done in the following steps: computation of input X and output Y matrix where each elements of Y matrix correspond to CI; generation of PDV; matching and selection
An integrated intelligent computing method
191
i.e., finding the row of X matrix that is most similar to PDV and selecting the corresponding row of Y matrix; adaptation i.e., finding the diseases having highest, nearly unity and least CI values in the selected Y row; computing the CCF of the selected three diseases. Figure 4 shows the entire step in order. Figure 4
Flowchart of algorithm for CBR processes
192
B. Pandey and R.B. Mishra
6.1 Computation of input output matrix We have developed a methodology which computes the relative importance of one set of variables (x1,… xn) onto the another set of variables (y1,… ym) where n may be equal to m. The different values of (x1,… xn) and (y1,… ym) up to p form matrix [X pn]and [Y pm]. The elements of matrix [Y pm] are computed to show the relative contribution of all the elements in the cumulative form of a particular row. The algorithm to compute the diagonal and non-diagonal elements of the [Y pm] matrix has been given in our research paper (Pandey and Mishra, 2008). In this, we present outline of the computation. Input matrix [X pn] is computed using Table 1. Following steps are used to prepare any element xij of [X pn]: 1
All the parameters as given in Table 1 i.e., cardiovascular, psychological, P wave, QRS complex and P-QRS characteristics are represented by string of binary numbers where the number of bits (n) in the string represents the number of sub-parameters (symptoms) considered under the particular parameter. For example, cardiovascular parameter consists of CHF, CP, RHB and PA therefore a binary string of 4 bits are used to represent cardiovascular parameter.
2
The binary string contains one and zero for ‘Y’ and ‘N’ respectively as in Table 1.
3
The binary string is then converted in decimal value.
4
The decimal value is then divided by 2n.
5
The computation of elements in [Y pm] matrix shows how much symptoms in one disease contribute to the detection level (CI) in another disease. For example, x1, x2, x3, x4, x5 column of third row contributes to the diseases of first, second and fourth along with its own (third) as illustrated in the next paragraph for the calculation of the non-diagonal elements of the matrix [Y pm]as shown in Table 4.
For example, in sinus arrest disease the cardiovascular problems are CP, RHB and PA therefore in four bits string the 1st, 2nd and 4th bits are one while third bit is zero thus the string is 1,101. The decimal value of binary string 1,101 is 13 therefore x11 = 13/24 = 0.8125. Similarly, x21 = 10/24 = 0.625. Likewise other elements of [X pn] matrix are computed. The basic purpose to compute [Y pm] matrix is to find out relative importance of each of the diseases in comparison to the diseases corresponding to the diagonal element. For example, if diagonal element y11 = 0.99 is selected after certain computation (as shown in Table 4 where the cell corresponding to row S. Arrest (SA) and column SA is 0.99) corresponding to a particular PDV then it is determined with how much confidence the same PDV contributes to other diseases. The elements of output matrix [Y pm] are computed from input matrix [X pn] by following steps: The non-diagonal and diagonal element of [Y pm] matrix are computed as follows: 1
The value of any non-diagonal element of [Y pm]matrix is computed as: 5 x jk ⎞ 1⎛ yij = ⎜ ⎟ 5 ⎜⎝ k −1 xik ⎟⎠
∑
(1)
An integrated intelligent computing method
193
where xjk element in kth column of jth row of [X pn] matrix k
index
yij element in jth column of ith row of [Y pm] matrix. For example:
∑
y23 = ⎡⎣( ( x3k / x2 k )) / 5⎤⎦ = [(0.75/0.625 + 0.563/0.828 + 0.875/0.875 + 0.875/0.875 +0.936 / 0.875)/5] = 0.989
∑
y43 = ⎡⎣( ( x3k / x4 k )) / 5⎤⎦ = [(0.75/0. 5 + 0.563/0.875 + 0.875/0.936 + 0.875/0.936 +0.875 / 0.936)/5] = 1.002
2
The value of diagonal elements, i.e., for i = j of [Y pm] matrix is computed using equation (1). Numerically, yii = yjj = 1 for any value of i = j but in all problems we have taken 0.99 (diagonal elements) for the ease of computation in ANN model. Table 4 shows the input output matrix. The input has five elements while output has four elements. In Table 4, the five columns of input matrix [X pn] are shown in column x1 to x5 and four columns of output matrix [Y pm] are shown in columns SA, SB, ST, SAr.
Table 4
ANN input-output table
Diseases
CP (x1)
PP (x2)
P wave (x3)
QRS (x4)
P-QRS (x5)
SA
SB
ST
SAr
S. Arrest (SA)
0.8125 0.984
0.875
0.875
0.936
0.99
0.903
0.899
0.929
S. Bradycardia (SB)
0.625
0.828
0.875
0.875
0.875
1.112
0.99
0.989
1.014
S. Tachycardia (ST)
0.75
0.563
0.875
0.875
0.936
1.166
1.043
0.99
1.072
S. Arrythmia (SAr)
0.5
0.875
0.936
0.936
0.936
1.126
1.002
1.002
0.99
6.2 PDV generation PDV is generated from user input which is provided through selecting checkboxes. Figure 6 shows a GUI format that displays questioner, their answer selected by user and the generated PDV. It is generated as follows: •
PDV consists of five parameters: cardiovascular, psychological, P wave, QRS complex and P-QRS relationship as shown in Figure 6
•
represent all the parameters by substring of binary numbers [s1(n = 4), s2(n = 6), s3(n = 4), s4(n = 4), s5(n = 4)] where s1, s2, s3, s4 and s5 are sub string for cardiovascular, psychological, P wave, QRS complex and P-QRS relationship respectively and n is number of bits (sub-parameters/symptoms) in a substring
•
the bits in substring are set to one or zero indicating the presence (selection of the condition) and absence of the symptom respectively
194
B. Pandey and R.B. Mishra
•
the binary substrings are then converted into decimal value
•
the decimal values are then divided by 2n, denote the result by [n1,… n5]
•
the result [n1, n2, n3, n4, n5] is a PDV.
6.3 Matching and selection Matching is performed by comparing the elements of PDV vector with elements of row in input matrix [X pn] and finding the difference between them this will produce a distance matrix. In this distance matrix, all the elements of a row are added with each other to obtain distance vector, the minimum element of this vector and its location is obtained. The row corresponding to this location in output matrix [Y pm] is obtained which contains CI of the diseases in order. Those disease having CI near by unity, least and highest are selected. Heuristic method involves following steps: •
generate the PDV vector from user requirement
•
match the PDV with each row of input matrix [X pn] as given in Table 4
•
select the matched row and obtain its location(procedure is defied above)
•
obtain row of [Y pm] matrix that corresponds to match row of X matrix, it denotes the CI of each diseases
•
the disease having highest, least and near by unity CI are selected
•
for these three diseases CCF is computed (method described in next section)
•
the disease with highest CCF is selected.
6.4 CCF computation CF is input by the user for the selected condition during PDV generation. This CF is used to compute the CCF of the disease that is most fit, accurate fit and least fit to patient data. The formula (Buchanan and Shortlifee, 1984) used for CCF as follows: MB (h, e1 & e2) = MB(h, e1) + MB (h, e2) (1 − MB (h, e1)),
(2)
where in a rule-based model e1 may represent a set of rules whose cumulative effects have previously been considered and e2 represents new rule whose effect is to be added to the previously existing belief. Similarly: MD (h, e1 & e2) = MD (h, e1) + MD (h, e2) (1 − MD (h, e1)).
(3)
MD (h e1 & e2) = 0, If MB (h, e1 & e2)= 1 i.e., all the evidences (e1 & e2) approves the hypothesis (h). CF = MB (h, e1 & e2) + MD (h, e1 & e2).
(4)
where MB is measure of belief and MD is measure of disbelief. In this work CCF is computed from bottom to top in hierarchal structure. First a CCF of node at lowest level i.e., cardiovascular, psychological, P wave, QRS complex and P-QRS relationship are computed by using equations (2), (3) and (4).
An integrated intelligent computing method
195
For example, in hierarchal structure of sinus bradycardia the evidence in support of rule 1 are e1: chest pain (z1 = 0.7) and e2: congestive heart failure (z2 = 0.6) as shown in Figure 1, where z1 and z2 are CF. The CCF of rule 1 is computed as follows: For e2: MB = 0.7 + 0.6 (1 − 0.7) = 0.88, MD = 0.0; MB + MD = 0.88 CCF = MB + MD = 0.88 + 0.0 = 0.88
Evidence in support of rule 2 are: e1: dizziness (z1 = 0.7), e2: fainting (z2 = 0.6), e3: fatigue (z3 = 0.5) and e4: light-headness (z4 = 0.6). The CCF of psychological problem is computed by using equations (2), (3) and (4). For e2: MB = 0.7 + 0.6 (1 − 0.7) = 0.88, MD = 0.0; MB + MD = 0.88 For e3: MB = 0.88 + 0.5 (1 − 0.88) = 0.94, MD = 0.0; MB + MD = 0.94 For e4: MB = 0.94 + 0.6 (1 − 0.94) = 0.976 CCF = MB + MD = 0.976
The evidence in support of rule 3 are: e1: cardiovascular (w = 0.21, z1 = 0.88) and e2: psychological (w = 0.14, z2 = 0.976). Where w is weight and z1 and z2 are CCF at the corresponding node. Therefore, the CCF of muscular abnormality is computed as follows: For e1: z1 = w*z1 = 0.21*0.88 = 0.1848 For e2: z2 = w*z2 = 0.14*0.976 = 0.13664 MB = 0.1848 + 0.13664 (1 − 0.1848) = 0.296, MD = 0.0; CCF = MB + MD = 0.296
Similarly, CCF is computed for all other nodes in the hierarchal structure of sinus bradycardia as shown in Figure 5 and displayed in Figure 6 in GUI form. Figure 5
Computation of CCF in sinus bradycardia
196
B. Pandey and R.B. Mishra
6.5 ANN model An ANN model is trained with input output matrix shown in Table 4. The ANN model is implemented using MATLAB 6.1 neural network tool. The following steps are performed for training and testing: •
Prepare the output matrix of the ANN input-output pair as computed in Section 6.1.
•
Perform the training of ANN model with 5-7-4: input-hidden-output layer architecture. Back propagation algorithm is deployed with Levenberg Marquardt (LM) learning rule.
•
Take the PDV generated by user.
•
Different set of input-output sets are generated with the slight variation in the input elements of input [X pn] matrix and corresponding elements in the output [Y pm] matrix as shown in Table 4. These input-output pairs are subjected to training of ANN architecture.
•
Three set of input data as PDV are generated and are subjected for testing. The corresponding predicted values of output are obtained.
•
In ANN model, the PDV is subjected for testing in the trained ANN model and the predicted output row for the corresponding PDV gives the matched output. Thus the selection and matching process is in one step in comparison to three steps in the heuristic method.
•
Learning: in the strait forward use of learning rules ML in training process exhibit the learned behaviour of the model useful for matching and selection of CBR process.
•
Adaptation: the selection process is adaptive in the sense that we take only those matched disease which are near by the users requirements displayed in PDV.
7
Results
First three sets of PDV are generated as shown in Table 5. The PDV is then matched by heuristic and ANN method to select the diseases in order of their CI as described in Section 6.5. The output obtained by both the methods for the three PDVs is given in Table 5. The three sets of PDVs PDV1, PDV2 and PDV3 are generated and their corresponding output after matching and selection are shown in the Table 5. As for an example, we mention only here the PDV3 with its input as [0.625, 0.828, 0.875, 0.875, 0.936] the output obtained by heuristic and ANN methods are: [1.112, 0.99, 0.9899, 1.014] and [1.134, 0.95, 0.937, 0.925]. The difference between the results of the two methods is insignificant as shown by error in the output matrix of Table 5. It is observed from the output that both methods predict same disease i.e., sinus bradycardia, sinus arrest and sinus tachycardia which have near unity, highest and least CI values respectively. This PDV absolutely corresponds to the disease sinus bradycardia with confidence obtained by ANN: heuristic methods such as: (CIANN: CIHeuristic) 0.95: 0.99 which is near
An integrated intelligent computing method
197
unity CI. The same PDV would generate a CI for the disease sinus arrest with 11.2% by heuristic and 13.4% by ANN to user requirement. It means that same sign and symptoms are used for PDV generation would correspond with increase CI for sinus arrest by both the methods. Similarly, other values would be interpreted for sinus bradycardia and sinus tachycardia. Table 5
Computing error between results obtained by ANN and heuristic methods for unknown PDV
PDV PDV1
PDV2
PDV3
Figure 6
Input 0.8125
0.625
0.625
0.984
0.828
0.828
0.875
0.875
0.875
Output 0.875
0.875
0.875
0.875
0.875
0.936
CIANN
0.99
0.93
0.853
0.952
CIHeuristic
0.99
0.903
0.899
0.929
Error
0.0
0.027
0.046
0.0023
CIANN
1.112
0.988
0.987
1.014
CIHeuristic
1.112
0.99
0.989
1.014
Error
0.0
0.002
0.001
0.0
CIANN
1.134
0.950
0.937
0.925
CIHeuristic
1.112
0.99
0.998
1.014
Error
0.022
0.04
0.061
0.089
Display the PDV that is used as test case for ANN method corresponding diseases selected by heuristic and ANN method with their CCF and the diagnosed disease (see online version for colours)
Now the CCF for the three selected diseases i.e., sinus bradycardia, sinus arrest and sinus tachycardia are computed as described in Section 6.4. Among the three selected diseases
198
B. Pandey and R.B. Mishra
the disease having largest CCF is finally selected. Figures 5 and 6 shows the CCF computed at each node of hierarchal structure of sinus bradycardia. It has been observed that the disease having nearly unity CI has largest CCF value (sinus bradycardia: 0.392) while the diseases having largest CI (sinus arrest: 0.387) and least CI (sinus tachycardia: 0.380) have smaller CCF values. Therefore sinus bradycardia is selected for the given unknown PDV. In the Figure 7, sinus arrest shows the highest CCF for the same PDV with changing CF of symptom. Thus the selection of diseases depends on the CF that displayed the sign and symptom. The final result shows the confidence in selecting a particular disease according to the PDV which corresponds to the user requirement. Figure 7
8
Display the PDV (same as in Figure 6) that is used as test case for ANN method corresponding diseases selected by heuristic and ANN method with their CCF and the diagnosed disease (see online version for colours)
Performance evaluation
Jones et al. (1995) developed two knowledge-based systems (KBS) KBSEI, KBSSI and ANN system for clinical decision-making in ECG signal interpretation. KBSEI contains ‘shallow’ knowledge in declarative forms and employs fuzzy set theory to deal with vagueness in the encoded knowledge and imprecise ECG measurements. The KBSSI uses ‘deep’ knowledge encoded in a qualitative simulation model for ECG simulation and interpretation. KBSEI adopts the basic architecture of a blackboard system. In KBSEI, the encoded knowledge about ECG interpretation is mostly acquired from medical monographs which are organised in the computer into rules and frames. KBSSI works in
An integrated intelligent computing method
199
a way in which ECG interpretation is viewed as an investigation of a system’s internal states in terms of external measured signals produced by the system. Jones et al. (1995) developed feed forward back propagation (FF-BP) ANN for classification of normal, anterior myocardial infarction (AMI), inferior myocardial infarction (IMI), AMI plus IMI and LBBB. The classification accuracy of the ANN model with 37-6-5 architecture is 50%–60%. Özbay et al. (2007) developed multilayer back propagation (MLP-BP) ANN with 200-48-10 architecture using MIT-BIH ECG database for classification of ECG arrhythmias. Its classification accuracy is 98%–99% in 2,000 iterations. Polat and Gunes (2007) used PCA and LS-SVM on ECG arrhythmias dataset having 279 features for classification of ECG arrhythmias. Its classification accuracy is 96%–100%. Mehta and Lingayat (2007b) proposed entropy-based algorithm and SVM on raw ECG signal for detection of cardiac beat with 99–93% accuracy. CASEY (Koton, 1988) is a medical diagnosis programme that integrates CBR and MBR appears to reflect the increasing complexity and scope of the problem domains. It uses model-based expert system (the heart failure programme) for managing patients with cardiac disease. Cases are described using a structured set of around 40 features (attributes plus associated values) as cases. It matches cases matching via semantical similarity and adapt a suitable solution by generating it from scratch. It produced a solution that was either successful or satisfactory for 86% of the situations. Table 6 Method KBS
Comparison with other ECG based cardiac diseases detection method Author
Specific features
ECG/other parameters
Diseases diagnosed
Classification accuracy 87%–90%
KBSEI ECG medical Blackboard (Jones et al., architecture monographs 1995) Knowledge encoded into rules and frames, frame similarity measure, FC and fuzzy inference, shallow knowledge, goal driven
Anterior infarction
KBSSI Deep knowledge, (Jones et al., goal driven 1995)
Normal, anterior and IMI, RBBB and LBBB (left bundle branch block)
73%–82%
Acute myocardial infarction
86%–90%
Raw ECG signal
SEC If then rule, forward Clinical data (Rabelo Jr. chaining (FC) and ECG data: P wave, QT et al., 1997) segment, QRS complex and Q wave duration; R, S, T and Q wave amplitude; J point
Anteroapical infarction Anteroseptal infarction
200
B. Pandey and R.B. Mishra
Table 6 Method ANN
Comparison with other ECG based cardiac diseases detection method (continued) Author Jones et al (1995)
Specific features
ECG/other parameters
FF-BP, 37-6-5, data ECG amplitude, duration, driven average QRS duration
Özbay et al. MLP-BP, 200-48-10, (2007) 2000 iterations
MIT-BIH ECG database
Diseases diagnosed
Classification accuracy
Normal, AMI, IMI, AMI plus IMI, and LBBB
50%–60%
ECG arrhythmias
98%–99%
Polat and Gunes (2007)
PCA and LS-SVM
ECG ECG Arrhythmias arrhythmias dataset; 279 features reduced to 15
96%–100%
Mehta and Lingayat (2007b)
SVM, entropy-based algorithm
Standard CSE Cardiac beat ECG database: detection raw ECG signal QRS complex
99–93%
CBRMBR
CASY (Koton, 1988)
Case representation via attribute-value pair; matching via semantical similarity, model based adaptation
40 features
Heart failure
86%
RBRCBRANN
Our work
If then rule, feature vector representation, similarity based retrieval, null adaptation, FF-BP, ML learning algorithm, 5-7-4
Cardiovascular, psychological and ECG features
Sinus arrest, sinus bradicardia, sinus tachycardia, sinus arrhythmia
90%
In our work, we integrate CBR-RBR-ANN which is rarely used by author in diagnosis of neuromuscular diseases. RBR is used to generate cases and ANN is used for matching and adaptation which reduced the time in retrieval process of CBR. The retrieval accuracy is 90% with similarity based retrieval and 95% with ANN respectively. The only difference with ANN and similarity based retrieval is that the ANN is faster. Table 6 shows the comparison of our method with other ECG based cardiac diseases detection method.
9
Conclusions
This work has proposed an approach for diagnosing cardiovascular diseases using an integrated model of RBR, CBR and ANN. Three diseases that are most fit, least fit and accurate fit to patient data are selected on the basis of CI and finally the CCF of the three selected diseases is also computed. This method selects the most appropriate disease by filtering at two levels:
An integrated intelligent computing method 1
select a row in Y matrix which contain the level of confidence
2
compute CCF based on hierarchal structure.
201
A unified structure depicting the sign and symptom displayed in the physical, psychological, and ECG parameters have rarely been developed for diagnosis of sinus disturbances and also an integrated computing model such as: RBS, CBR and ANN have rarely been used for diagnosis of sinus disturbances. The integrated model overcomes the deficiencies in the deployment of individual methods such as: ANN produced quick matching in CBR’s selection method and CBR reduces number of rules in rule-based model. The effort in this direction would enhance toward completion for a computing methodology. The final selected disease on the basis of CCF is performed and it depends upon CF calculated on the basis of sign and symptom of the diseases. The sign and symptoms of sinus disturbances have been taken from literature and consultation with physician and researchers in the area. The sign, symptoms and confidence factor may be altered or become unanimously in consultation with more number of physicians and experimentations in clinical settings.
References Abboud, S. and Sadeh, D. (1993) ‘The use of cross-correlation function for the alignment of ECG waveforms and rejection of extrasystoles’, Comput. Biomed. Res., Vol. 16, pp.273–286. Assanelli, D., Cazzamalli, L., Stambini, M. and Poeta, M.L. (1993) ‘Correct diagnosis of chest pain by an integrated expert system’, Proceeding of Computers in Cardiology, September, pp.759–762. Belforte, G., Mori, R.D. and Ferraris, F. (1979) ‘A contribution to the automatic processing of electrocardiograms using syntactic methods’, IEEE Trans. Biomed. Eng., Vol. 26, No. 3, pp.125–136. Buchanan, B.G. and Shortlifee, E.H. (1984) Rule-based Expert Systems: The MyCIN Experiments of the Standford Heuristic Programming Project, Addison-Wesley, Reading M.A. Bursuk, E., Scan, M. and Ilerigelen, B. (1999) ‘A medical expert system in cardiological diseases’, Proceeding of the first BMES/EMBS Conference Serving Humanity, Advancing Technology, Atlanta, GA, USA, October, pp.13–16. Ceylan, R. and Ozbay, Y. (2007) ‘Comparison of FCM, PCA and WT techniques for classification ECG arrhythmias using artificial neural network’, Expert Systems with Applications, Vol. 33, No. 2, pp.286–295. Chen, S-W., Chen, H.-C. and Chan, H-L. (2006) ‘A real-time QRS detection method based on moving-averaging incorporating with wavelet denoising’, Computer Methods and Programs in Biomedicine, Vol. 82, No. 3, pp.187–195. Chen, W., Mo, Z. and Guo, W. (2007) ‘Detection of QRS complexes using wavelet transforms and golden section search’, Proceedings of International Conference on Intelligent Systems and Knowledge Engineering, Atlantis Press, October. Engelse, W.A.H. and Zeelenberg, C. (1979) ‘A single scan algorithm for QRS detection and feature extraction’, Proceedings of IEEE Comput. Cardiol., pp.37–42. Facts About Heart Diseases (1995) ‘Sinus arrhythmia’, North Suburban Cardiology Group Ltd., available at http://www.nscardiology.com/, (accessed on 02/03/2008). Geirl, L. and Stengel-Rutkowski, S. (1994) ‘Integrating consultation and semi-automatic knowledge acquisition in a prototype-based architecture: experiences with dysmorphic syndromes’, Artif. Intell. Med., Vol. 6, No. 1, pp.29–49.
202
B. Pandey and R.B. Mishra
Haddad, M., Adlassnig, K.P. and Porenta, G. (1997) ‘Feasibility analysis of a case-based reasoning system for automated detection of coronary heart disease from myocardial scintigrams’, Artificial Intelligence in Medicine, Vol. 9, No. 1, pp.61–78. Horowitz, S.L. (1975) ‘A syntactic algorithm for peak detection in waveforms with applications to cardiology’, Commun. ACM, Vol. 18, pp.281–285. Jones, N.B., Wang, J.T., Sehmi, A.S. and de Bono, D.P. (1995) ‘Knowledge-based systems and neural networks for clinical decision making’, Control Eng. Practice, Vol. 3, No. 7, pp.967–975. Koton, P. (1988) ‘Reasoning about evidence in causal explanations’, Proceeding of the Seventh National Conference on Artificial Intelligence, Menlo Park, Calif., American Association for Artificial Intelligence, pp.256–261. Kyrkos, A., Giakoumakis, E.A. and Carayannis, G. (1998) ‘QRS detection through time recursive prediction techniques’, Signal Processing, Vol. 15, No. 4, pp.429–436. Larizza, C., Moglia, A. and Stefanelli, M. (1992) ‘M-HTP: a system for monitoring heart transplant patients’, Artificial Intelligence in Medicine, Vol. 4, No. 2, pp.111–126. Li, C., Zheng, C. and Tai, C. (1995) ‘Detection of ECG characteristic points using wavelet transforms’, IEEE Trans. Biomed. Eng., Vol. 42, No. 1, pp.21–28. Ligtenberg, A. and Kunt, M. (1983) ‘A robust-digital QRS detection algorithm for arrhythmia monitoring’, Comput. Biomed. Res., Vol. 16, pp.273–286. Mallat, S. and Hwang, W.L. (1992) ‘Singularity detection and processing with wavelets’, IEEE Trans. Inform. Theory, Vol. 38, No. 2, pp.617–643. Martinez, J.P., Olmos, S. and Laguna, P. (2000) ‘Evaluation of a wavelet based ECG waveform detector on the QT database’, Proceedings of IEEE Comput. Cardiol., Vol. 27, pp.81–84. Meghriche, S., Draa, A. and Boulemden, M. (2008) ‘On the analysis of a compound neural network for detecting AtrioVentricular heart block (AVB) in an ECG signal’, Biological and Medical Science, Vol. 1, No. 1, pp.1–7. Mehta, S.S. and Lingayat, N.S. (2007a) ‘Identification of QRS complexes in 12-lead electrocardiogram’, Expert Systems with Applications, pp.898–906, available online, (accessed on 06/11/2007). Mehta, S.S. and Lingayat, N.S. (2007b) ‘Support vector machine for cardiac beat detection in single lead electrocardiogram’, International Journal of Applied Mathematics, Vol. 36, No. 2, advance online publication, (accessed on 24/05/2007). Meyer, C., Gavela, J.F. and Harris, M. (2006) ‘Combining algorithms in automatic detection of QRS complexes in ECG signals’, IEEE Transaction on Information Technology In Biomedicine, Vol. 10, No. 3. pp.468–475. Moraes, J.C.T.B., Freitas, M.M., Vilani, F.N. and Costa, E.V. (2002) ‘A QRS complex detection algorithm using electrocardiogram leads,’ Proceedings of IEEE Comput. Cardiol., Vol. 29, pp.205–208. Özbay et al. (2007) ‘A fuzzy clustering neural network architecture for classification of ECG arrhythmias’, Computers in Biology & Medicine, Vol. 36, pp.376–388. Pan, J. and Tompkins, W.L. (1985) ‘A real-time QRS detection algorithm’, IEEE Trans. Biomed. Eng., Vol. 32, No. 3, pp.230–236. Pandey, B. and Mishra, R.B. (2008) ‘A novel method for the selection of expert systems using case-based reasoning’, International Journal of Knowledge Engineering and Soft Data Paradigms, Vol. 1, No. 2, (accepted). Panic Attack and Sinus Arrest (2007) ‘Sinus arrest’, Compiled by Bill Burniece, Author and Consumer Advocate, available at http://www.americanchronicle.com/, (accessed on 02/03/2008). Polat, K. and Guneş, S. (2007) ‘Detection of ECG arrhythmia using a differential expert system approach based on principal component analysis and least square support vector machine’, Applied Mathematics and Computation, Vol. 186, No. 1, pp.898–906.
An integrated intelligent computing method
203
Rabelo Jr. et al. (1997) ‘An expert system for diagnosis of acute myocardial infarction with ECG analysis’, Artificial Intelligence in Medicine, Vol. 10 , pp.75–92. Reategui, E.B., Campbell, J.A. and Leao, B.F. (1997) ‘Case-based model that integrates specific and general knowledge in reasoning’, Applied Intelligence, Vol. 7, No. 1, pp.79–90. Salem, A-B.M. (2007) ‘Case-based reasoning technology for medical diagnosis’, Proceeding of World Academy of Science, Engineering and Technology, Vol. 25, November. Sinus Bradycardia (2008) available at http://www.herbchina2000.com, (accessed on 01/03/2008), Herb China 2000 Inc. ERB. Sinus Disturbance (2008) ‘Sinus bradycardia’, American Heart Association, Inc., available at http://www.americanheart.org/, (accessed on 01/03/2008). So, H.H. and Chan, K.L. (1997) ‘Development of QRS detection method for real-time ambulatory cardiac monitor’, Proceedings of 19’h Annu. Int. Conf. IEEE EMBS, Chicago, USA, pp.289–292. Woods, S. (2006) ‘Sinus tachycardia’, available at http://www.health.discovery.com/, (accessed on 03/03/2008).