International Journal of
Environmental Research and Public Health Article
PM2.5, Population Exposure and Economic Effects in Urban Agglomerations of China Using Ground-Based Monitoring Data Yonglin Shen 1 and Ling Yao 2,3, * 1 2 3
*
College of Information Engineering, China University of Geosciences, Wuhan 430074, China;
[email protected] State Key Laboratory of Resources and Environmental Information System, Institute of Geographic Sciences and Natural Resources Research, Chinese Academy of Sciences, Beijing 100101, China Jiangsu Center for Collaborative Innovation in Geographical Information Resource Development and Application, Nanjing Normal University, Nanjing 210023, China Correspondence:
[email protected]
Received: 2 May 2017; Accepted: 29 June 2017; Published: 3 July 2017
Abstract: This paper adopts the PM2.5 concentration data obtained from 1497 station-based monitoring sites, population and gross domestic product (GDP) census data, revealing population exposure and economic effects of PM2.5 in four typical urban agglomerations of China, i.e., Beijing-Tianjin-Hebei (BTH), the Yangtze River delta (YRD), the Pearl River delta (PRD), and Chengdu-Chongqing (CC). The Cokriging interpolation method was used to estimate the PM2.5 concentration from station-level to grid-level. Next, an evaluation was conducted mainly at the grid-level with a cell size of 1 × 1 km, assisted by the urban agglomeration scale. Criteria including the population-weighted mean, the cumulative percent distribution and the correlation coefficient were applied in our evaluation. The results showed that the spatial pattern of population exposure in BTH was consistent with that of PM2.5 concentration, as well as changes in elevation. The topography was also an important factor in the accumulation of PM2.5 in CC. Moreover, the most polluted urban agglomeration based on the population-weighted mean was BTH, while the least was PRD. In terms of the cumulative percent distribution, only 0.51% of the population who lived in the four urban agglomerations, and 2.33% of the GDP that was produced in the four urban agglomerations, were associated with an annual PM2.5 concentration smaller than the Chinese National Ambient Air Quality Standard of 35 µg/m3 . This indicates that the majority of people live in the high air polluted areas, and economic development contributes to air pollution. Our results are supported by the high correlation between population exposure and the corresponding GDP in each urban agglomeration. Keywords: fine particulate matter; population exposure; population-weighted mean; urban agglomeration
1. Introduction Fine particulate matter (also known as PM2.5 or respirable particles), which is suspended in the atmosphere with an aerodynamic diameter no more than 2.5 microns, has been recognized as a serious environmental concern due to its significant adverse effects on human health, climate biogeochemical cycle, and atmospheric chemistry [1,2]. Negative health effects are important consequences of population exposure to PM2.5 , which makes exposure information essential for policy-makers to develop appropriate risk control policies [3]. In previous studies worldwide, the characteristics, chemical compositions, sources, and formation mechanism of PM2.5 have been researched [4,5], and conclusions were made that pollution arose
Int. J. Environ. Res. Public Health 2017, 14, 716; doi:10.3390/ijerph14070716
www.mdpi.com/journal/ijerph
Int. J. Environ. Res. Public Health 2017, 14, 716
2 of 15
at several levels of scale, e.g., a sampling site scale for traffic non-exhaust and re-suspended dust sources, an urban scale for combustion and industrial sources, and a regional scale [6]. Moreover, terrain conditions are one of the most important factors that affect PM2.5 concentration distribution [7]. Yao and Lu [8] found that the spatial distribution of annual average PM2.5 concentration coincides with China’s three gradient terrains. In China, many mega-cities have been investigated, e.g., Beijing [9,10], Shanghai [11], Guangzhou [12], Nanjing [13,14], Chengdu [15], Shenyang [16], and Changchun [17]. Furthermore, studies conducted in recent years have also focused on a regional scale, such as urban agglomeration. Urban agglomeration is an extended city or town area comprising the built-up area of one mega-city or more, with surrounding suburbs linked by continuous urban areas. Shimou [18] reviewed the differences among urban agglomerations in America, Europe, and China, and concluded that strict administration systems and regulations made the development much more difficult if a city tried to expand beyond their political borders in China. Zhao et al. [19] analyzed the chemical compositions, seasonal variations, and regional pollution events of PM2.5 in the Beijing-Tianjin-Hebei (hereinafter, BTH, also known as Jing-Jin-Ji), China. Moreover, other urban agglomerations of China were also examined, including the Yangtze River delta (YRD) [20], Pearl River delta (PRD) [21,22], and Chang-Zhu-Tan [23]. A comparison between cities and urban agglomerations has been conducted; Chan and Yao [24] presented an overview of air pollution in China and provided a detailed comparison between Beijing, Shanghai and the PRD. To better quantify the adverse health impacts of PM2.5 , population exposure estimates that can better incorporate the spatial variability of PM2.5 concentrations are required [1]. Aleksandropoulou and Lazaridis [25] evaluated the population exposure to PM2.5 in outdoor environments in the metropolitan areas of Greece from 2001 to 2010. Pant et al. [26] estimated the population exposure to PM2.5 , and assessed the representability of ambient air quality monitoring stations to serve as surrogates for population exposure in New Delhi, India. Requia et al. [3] evaluated the spatial patterns of link-based PM2.5 emissions and subsequent human exposure in a large Canadian metropolitan area. Furthermore, evaluations have also been conducted in mega-cities of China, like Beijing [27,28]. Population of exposure to pollutant can be estimated either with satellite images or with ground-based monitoring data, where the former use satellite-derived aerosol optical depth (AOD) as a proxy for PM2.5 [1]. The variations of population exposure to PM2.5 across the PRD [29] and mainland China [30] have been stated by using the 0.1◦ × 0.1◦ moderate resolution imaging spectroradiometer (MODIS) satellite data. However, the accuracy of AOD-based PM2.5 retrieval methods may vary significantly due to seasons and locations [31,32]. In this study, we focused on the assessment of population exposure and economic effects on PM2.5 in typical urban agglomerations of China, i.e., BTH, YRD, PRD and Chengdu-Chongqing (hereinafter, CC, also known as Cheng-Yu). Station-based PM2.5 datasets across the four urban agglomerations were used, and criteria including population-weighted mean, cumulative percent distribution, and correlation coefficient were employed in our evaluation. This provided a unique opportunity for us to study the impact of grid-level PM2.5 data in exposure estimates for regional populations, as well as to further validate the economic effects on PM2.5 concentrations. 2. Materials and Methods 2.1. Study Area The spatial domain of this study included the four most typical urban agglomerations of China, BTH, YRD, PRD and CC. In 2014, the population of the study areas accounted for 26% of the total in China, and the gross domestic product (GDP) of these regions accounted for 43.8% of the national GDP. The locations of the study areas are presented in Figure 1. The BTH is the biggest urbanized region in northern China, which was born out of political pressure rather than economic prosperity. Ten cities including Beijing, Tianjin, Baoding, Langfang,
Int. J. Environ. Res. Public Health 2017, 14, 716
3 of 15
Tangshan, Qinhuangdao, Shijiangzhuang, Zhangjiakou, Chengde and Cangzhou in the BTH urban Int. J. Environ. Res. Public Health 2017, 14, 716 3 of 15 agglomeration are officially recognized in the government publications.
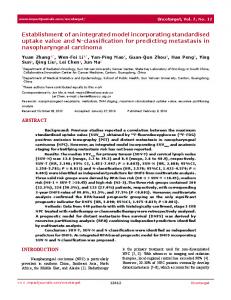
Figure 1. The location of the study areas and stations for PM monitoring. The color scale represents Figure 1. The location of the study areas and stations for PM 2.52.5 monitoring. The color scale represents the elevation variability across the urban agglomeration. the elevation variability across the urban agglomeration. The BTH is the biggest urbanized region in northern China, which was born out of political
The YRD region is the most economically developed and rapidly urbanizing city cluster in pressure rather than economic prosperity. Ten cities including Beijing, Tianjin, Baoding, Langfang, East China. It is located on the east coast of China bordering the East China Sea. The newest YRD Tangshan, Qinhuangdao, Shijiangzhuang, Zhangjiakou, Chengde and Cangzhou in the BTH urban agglomeration are officially recognized in the government publications. urban agglomeration consists of Shanghai, Nanjing, Wuxi, Changzhou, Suzhou, Nantong, Yancheng, The YRD region is the most economically developed and rapidly urbanizing city cluster in East Yangzhou, Zhenjiang, Taizhou, Hangzhou, Ningbo, Jiaxing, Huzhou, Shaoxing, Jinhua, Zhoushan, China. It is located on the east coast of China bordering the East China Sea. The newest YRD urban Taizhou, Hefei, Wuhu, Ma’anshan, Tongling, Anqing, Chuzhou, Chizhou, and Xuancheng. agglomeration consists of Shanghai, Nanjing, Wuxi, Changzhou, Suzhou, Nantong, Yancheng, The PRD, which is currently known as the Guangdong-Hong Kong-Macau Greater Bay area, Yangzhou, Zhenjiang, Taizhou, Hangzhou, Ningbo, Jiaxing, Huzhou, Shaoxing, Jinhua, Zhoushan, is situated in South China adjacent to the South China Sea, which is considered as one of the country’s Taizhou, Hefei, Wuhu, Ma’anshan, Tongling, Anqing, Chuzhou, Chizhou, and Xuancheng. The PRD, which is currently known as the Guangdong‐Hong Kong‐Macau Greater Bay area, is chief economic regions and manufacturing centers. The PRD urban agglomeration generally comprises situated in South China adjacent to the South China Sea, which is considered as one of the country’s Guangzhou, Shenzhen, Zhuhai, Foshan, Dongguan, Zhongshan, Jiangmen, Zhaoqing, Huizhou, chief economic regions and manufacturing centers. The PRD urban agglomeration generally Hong Kong and Macau. As there is no ground-based monitoring data in Hong Kong and Macau, comprises Guangzhou, Shenzhen, Zhuhai, Foshan, Dongguan, Zhongshan, Jiangmen, Zhaoqing, they were not considered in this study. Huizhou, Hong Kong and Macau. As there is no ground‐based monitoring data in Hong Kong and The CC is a national level urban agglomeration that leads the development of West China. Macau, they were not considered in this study. It consists ofThe CC is a national level urban agglomeration that leads the development of West China. It Chongqing, Chengdu, Zigong, Luzhou, Deyang, Mianyang, Suining, Neijiang, Leshan, consists of Chongqing, Zigong, Luzhou, Deyang, Suining, which Neijiang, Leshan, Nanchong, Meishan, Yibin,Chengdu, Guang’an, Dazhou, Ya’an andMianyang, Ziyang, among Chongqing and Nanchong, Meishan, Yibin, Guang’an, Dazhou, Ya’an and Ziyang, among which Chongqing and Chengdu are the core cities. Chengdu are the core cities.
2.2. Datasets
The primary data used in this study were station-based PM2.5 concentrations, population census data, GDP census data and a 30 × 30 m digital elevation model (DEM). Annual PM2.5 concentration data were obtained from the China National Environmental Monitoring Center (CNEMC) website [33]. By the end of 2014, approximately 1497 monitoring sites had been established to report the overall air
Int. J. Environ. Res. Public Health 2017, 14, 716
4 of 15
quality in China. The population and GDP census data were derived from the National Earth System Science Data Sharing Infrastructure [34] with 1 × 1 km sized grids. The census data showed a high density of people living in and around the major urban areas. The original PM2.5 concentration data were at discrete points, i.e., at fixed monitoring stations. To present a localized representation of population exposure to PM2.5 and economic effects on it, we used a geographic information system based grid mapping where grids of 1 × 1 km were applied to PM2.5 data. Thus, the spatial interpolation method was applied to estimate the concentration of pollutants from station-level to grid-level to characterize concentrations across the entire area. In this study, we used Cokriging method incorporated with DEM data to calculate the pollutant concentration at each grid from the measured data at 1497 monitoring stations. Cokriging is a multivariate extension of kriging where the auxiliary information (in this case, DEM data) is incorporated in the estimation at unsampled locations by accounting for spatial correlations of the primary variable with secondary attributes [35]. The mapping processes divided regions of the BTH, YRD, PRD and CC into 146,598, 166,151, 36,103 and 208,879 available grid cells, respectively. Next, the processes of population exposure and the economic effects of urban agglomerations on those grid cells were analyzed by mathematical methods. 2.3. Estimation of Population Exposure The population exposure was estimated both at the grid-level and region-level (i.e., at the urban agglomeration level). Population exposure at the grid-level was proposed as an important indicator to measure the population exposure to PM2.5 air pollution, which requires both population distribution data and PM2.5 concentration distribution data. It can be calculated by, ψi = Pi Ci
(1)
where ψi represents the i th grid of population exposure; i designates each computational cell in the domain; Pi is the population at a given cell location; and Ci is the particulate concentration in the same cell location. At the urban agglomeration level, the population exposure was measured by the population-weighted mean PM2.5 [36]. Calculating the population weighted mean PM2.5 has implications for estimating the impact of air pollution on public health and providing insights into pollution mitigation policies for individual urban agglomeration and cross-regional collaboration. If the distribution of PM2.5 within an urban agglomeration concurs with the spatial patterns of population, the resulting population-weighted mean PM2.5 tends to be larger than its original PM2.5 value, and vice versa [37]. The population weighted mean PM2.5 (denoted by e) is calculated as e=
∑in=1 ψi Po
(2)
n
where Po = ∑ Pi is the total population in the domain of interest (in this case, an urban agglomeration); i =1
and n represents the total number of grids in the urban agglomeration. 2.4. Estimation of Cumulative Percentage Distribution Meanwhile, this paper also calculated the cumulative PM2.5 concentrations in each study area, as cumulative percentage is a way of expressing frequency distribution. It calculates the percentage of the cumulative frequency within each interval, as much as relative frequency distribution calculates the percentage of frequency [27]. The cumulative percent distribution of population or GDP by annual PM2.5 concentrations is calculated as
Rτ γτ =
0
PC