In this paper we propose a platform that aims at helping researchers and ... chose to follow a concrete clinical application, the personalised simulation of the ...
Eurographics Workshop on Visual Computing for Biomedicine (2008) C. P. Botha, G. Kindlmann, W. J. Niessen, and B. Preim (Editors)
An Integrated Platform for Dynamic Cardiac Simulation and Image Processing: Application to Personalised Tetralogy of Fallot Simulation N. Toussaint, T. Mansi, H. Delingette, N. Ayache and M. Sermesant INRIA, Asclepios Team, Sophia-Antipolis, France
Abstract Processing and visualisation of dynamic data is still a common challenge in medical imaging, especially as for many applications there is an increasing amount of clinical data as well as generated data, such as in cardiac modelling. In this context, there is a strong need for software that can deal with dynamic data of different kinds (i.e. images, meshes, signals, etc.). In this paper we propose a platform that aims at helping researchers and clinicians to visualise and process such dynamic data, as well as evaluate simulation results. To illustrate this platform we chose to follow a concrete clinical application, the personalised simulation of the Tetralogy of Fallot. We show that the software provides the user with a significant help in the assessment and processing of the 3D+t raw data, as well as an adapted framework for visualisation and evaluation of various dynamic simulation results. Categories and Subject Descriptors (according to ACM CCS): I.4.9 [Image Processing and Computer Vision]: Dynamic medical data processing and visualisation
1. Introduction Cardiac imaging and simulation involve a lot of different kinds of datasets that have to be processed and visualised. These data can be composed of scalar images, surfaces and volumetric meshes, curves, etc. Moreover, one has to take into consideration that all this information intrinsically depends on time as we deal with a dynamic process such as the cardiac function. It is also known that cardiac simulation requires important pre-processing steps to prepare the data in order to build an anatomical model of the heart from a clinical examination. 1.1. Context and Objectives A significant amount of software have recently appeared in the community concerning dynamic medical data processing and visualisation. While Osirix [RSR04] targets clinicians and mainly focuses on DICOM exam image visualisation, other software such as Slicer3D [3DS] or ParaView [Par] provide researchers with a large range of processing and visualisation tools. A third group of software consists on frameworks that aim at helping researchers to build a specific c The Eurographics Association 2008.
application [MeV] [Ope] [MIT]. However, there is no commonly known platform specially oriented for cardiac studies and suitable both for the clinical and the research communities. In this context, we propose to provide the clinicians and researchers with a freely available integrated platform specifically designed for dynamic cardiac data processing and visualisation [Car]. The main objective of this platform is to provide a set of tools aiming at pre-processing clinical data for cardiac simulation, as well as intuitive ways of evaluating simulation results. Indeed, simulating the cardiac function requires the definition of a geometric model of the heart as input. This model has to contain physiological parameters (i.e. contractility, conductivity) specific to a given patient to create the initial conditions for the simulation. By offering user-friendly tools for performing all the necessary preprocessing steps, we help the user building a patient-specific model of the heart. Dynamic cardiac simulation results can later be evaluated in the platform, creating in this way a
N. Toussaint, T. Mansi, H. Delingette, N. Ayache and M. Sermesant / An Integrated Platform for Dynamic Cardiac Simulation and Image Processing
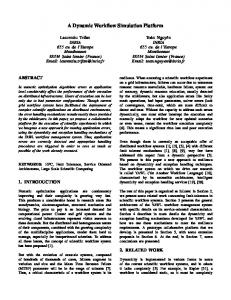
Figure 1: Platform mainframe. The platform is divided in two panels. On the left the control panel contains a data-manager window that lists all imported data. These data are displayed in a set of tabs in the view panel on the right. Processing and visualisation tools are organised in toolboxes (bottom of the control panel). In the foreground the toolbox dedicated to time management has been detached from the mainframe.
framework for the comparison of dynamic clinical data and simulation results. The paper is organised as follows: after an introduction on the software design, we take a clinical example as a bottom line to illustrate the software. For that we describe the major pre-processing steps that lead to the definition of a patient-specific model of the heart. Then we show how the simulation can be launched from the TCL script interface of the software. Simulation results are evaluated and compared to initial clinical data in the post-processing section. Finally, we show how other dynamic phenomena can be studied in our platform. 1.2. Software Design Cardiac imaging involves a large amount of heterogeneous data. Moreover, the dynamic aspect of these data has to be considered. In this context, the Visualization Tool Kit (VTK [VTK]) offers an adapted environment for visualisation and manipulation of medical data, and has become a standard in this area. VTK provides state-of-the-art techniques for representing dataset and extracting meaningful information. Based on this ToolKit, we build a versatile framework that is especially dedicated to heterogeneous and dynamic data, called vtkINRIA3D [TSF]. vtkINRIA3D has
three main objectives : 1. The synchronisation of user interaction among different render windows; 2. adapted manipulation of data coming from the increasing diversification of the source of medical information; 3. simple and efficient management of these data for programmers. This framework (source code, examples, documentation) is freely available. Based on this environment we choose KWWidgets [KWW] for the Graphic User Interface (GUI), as it is fully adapted to VTK objects. Moreover, KWWidgets offers an access to TCL script. We will take advantage of this scripting device to launch external simulation processes directly from the platform interface. The mainframe of the software is composed of two panels (Fig. 1); the control panel on the left part and the view panel on the right. The data manager on the top of the control panel lists all imported data. These data are displayed in the view panel, which is divided in three 2D views and one 3D view. As cardiac imaging and simulation require a large panel of different tools, we organise them in a set of toolboxes. Each toolbox has a specific purpose (i.e. visualisation parameters, segmentation, mesh processing, etc.). The user can switch between toolboxes with the list of buttons on the left panel. The designated toolbox appears at the bottom and can be detached when it is often used. For instance, the data sequencer c The Eurographics Association 2008.
N. Toussaint, T. Mansi, H. Delingette, N. Ayache and M. Sermesant / An Integrated Platform for Dynamic Cardiac Simulation and Image Processing
toolbox (foreground in Fig. 1) is dedicated to the management of time, allowing the user to play dynamic sequences and control the display speed. As we deal with heterogeneous data (i.e. scalar images, surface meshes, volumetric meshes), it appears important to have a versatile data management system. Hence we defined a VTK object - that we call vtkDataManager - that is meant to fully master a set of heterogeneous static and dynamic data. Further details on data management can be found in [TSF]. The vtkDataManager is represented in the mainframe by a widget that lists the imported data (Fig. 1 top-left). As shown in Fig. 2, the architecture of the platform is divided into three main blocks. The lowest level is dedicated to algorithms and uses the Insight ToolKit [ISNC03] as well as an in-house image processing kit. The second block deals with visualisation purposes and is based on VTK. The highest level block corresponds to the graphic user interface of the software developed with KWWidgets. Blocks have been designed to be independent one to the others. Thus, one could easily re-write the user-interface with another library, or even write command line tools instead of graphical applications.
8mm, temporal resolution: 25 frames). Images were made isotropic and contrast was enhanced by clamping the tails of the grey-level histogram. Clinical examination showed a significantly dilated right ventricle, which represents a typical symptom of the ToF. An anomalous motion of the right ventricle was visible on a located region. We will later call this region the dyskinetic area. In the next sections, we use our platform to: • perform all necessary pre-processing steps to generate a patient-specific model adjusted to the pathological conditions of the patient; • launch cardiac simulations of the pathological heart; • evaluate and analyse simulation results with intuitive postprocessing applications. 2. Pre-processing Steps: Generation of a Patient-Specific Cardiac Model 2.1. Data Import and Visualisation DICOM (Digital Imaging and Communications in Medicine) examinations can easily be loaded into the platform with the help of the DICOM importer (Fig. 3). In particular, dynamic information on a cardiac study is automatically recovered. For that we take advantage of cardiac dedicated DICOM flags when they are provided in the clinical examination. Here are two examples: • Heart Rate: used to estimate the cardiac cycle duration; • Cardiac Number of Images: used to estimate the temporal resolution;
Figure 2: Software Architecture: This diagram illustrates the interactions between the three blocks of the platform. The user manipulates the visualisation and processing parameters through the interface. Although all these blocks are written in C++ language, they are wrapped in TCL, allowing full control by a TCL script device.
DICOM flags in general represent an important source of information concerning the clinical data. Hence we propose to the user to visualise all available flags concerning an image in a dedicated window simply by double clicking on the image corresponding line. In addition, this window contains a search box that helps to find a specific string within the DICOM flags. 2.2. Segmentation
1.3. Exemplar Clinical Application In order to illustrate this software, we chose to take a clinical application as a bottom line for this paper: the simulation of cardiac activity of a pathological heart. Among others, we chose the Tetralogy of Fallot (ToF) which is a congenital heart defect that requires surgical intervention in infancy. It can be considered of interest to simulate cardiac activity of such patients for a better understanding of the pathology. Hence we propose to use our platform to help building a patient-specific model of such pathological heart. Initial clinical data consist in a cine-MRI sequence of the cardiac cycle of a ToF young patient. Images are in short axis, covering both ventricles (10 slices; slice thickness: c The Eurographics Association 2008.
To build a patient-specific model of the heart, it is crucial to segment (delineate) the different parts of the organ. That implies segmenting the left and right endocardia, as well as the epicardium. Our platform offers two different tools for that purpose: interactive surface generation using implicit functions, and surface deformation using parametric deformable models. For the first tool, we implemented a framework that is able to handle a set of control points, so-called landmarks. Landmarks are VTK-based objects. They are displayed as spheres in the 3D view and projected back on the 2D views. Several user interactions are possible to manipulate them. For instance one can drag and drop a landmark with the mouse from any view, or add a landmark at a specific location.
N. Toussaint, T. Mansi, H. Delingette, N. Ayache and M. Sermesant / An Integrated Platform for Dynamic Cardiac Simulation and Image Processing
Figure 3: DICOM import. The DICOM importer helps the user to import a clinical examination into the platform. A list of the available images is shown on the left while a preview is given on the top right. 2D+t as well as 3D+t temporal sequences can be imported.
A set of landmarks is fully managed by a single object, named LandmarkManager, that can be associated to a dataset for example. Despite its position in space, a landmark can contain an arbitrary amount of additional information (i.e. a name, a description, a colour, etc.). Moreover, the LandmarkManager has its own file format. Thus one can easily save a group of landmarks for further use. Interactive segmentation is based on variational implicit surfaces [TO99], which consists on computing an implicit function whose zero-level set pass through user defined control points. To this aim, the user places and manipulates several landmarks that are either inside, outside or on the surface of interest (Figure 4). Difference between those types of landmarks is made by associating specific flags to their additional information. Any movement of a landmark is synchronised between views using the command-observer framework provided in VTK. Moreover, the generated surface is updated according to the position of the modified landmark. As shown in Fig. 4 (right), by adding more control points, complex shapes can be obtained. In the second tool, we use deformable models [Del94] to modify the shape of an existing surface mesh (Fig. 5). Parameters can be set to control the behaviour of the model. For instance it is possible to constrain the model to lie on high gradient values of the underlying image. In addition, the user can constrain the surface to lie on some fixed positions (represented by landmarks), or interactively attract the surface during deformation with mouse clicks in the 2D views. Once again the shape of the surface is updated in real-time. For our application example, first the LV and RV endocar-
Figure 4: Interactive surface generation. Landmarks are interactively placed and moved to control an implicit function framework that generates the shape according to the landmarks. In this figure the left ventricle (LV) is delineated. Red landmarks constrain the surface to lie on their positions, whereas green landmark (middle of the left ventricle) indicates the inside of the closed surface.
Figure 5: Surface Mesh Deformation. A deformable model is used to automatically modify the shape of the mesh. Left: landmarks are interactively placed to constrain the surface to certain positions. Right: The surface deformed according to the image gradient. The user can also guide the deformation process by attracting the mesh with mouse clicks on the 2D views.
dia as well as the epicardium are delineated on the first frame (corresponding to end diastole) of the MRI cardiac sequence by using the interactive surface generation tool. Second, we use the deformable model tool to refine the segmentation. At last, the masks of the segmented epicardium and endocardia are combined to get a mask of the full biventricular myocardium (Fig. 6 left). Our simulation model does not take into account the modelling of the valves. Hence it can be of interest to remove or crop - the obtained mask. We propose a solution to interactively place a vtkImplicitPlane in the 3D view. The plane is then taken to set values of the voxels above the plane to zero. Finally, we use vtkExtractIsoSurfaceFilter to output the isosurface of this mask and obtain a full biventricular geometric model of the heart (Fig. 6 right). c The Eurographics Association 2008.
N. Toussaint, T. Mansi, H. Delingette, N. Ayache and M. Sermesant / An Integrated Platform for Dynamic Cardiac Simulation and Image Processing
Figure 6: Myocardium Segmentation. Left: Resulting meshes after the segmentation of the LV (in blue), RV (in green) and epicardium (transparent) surfaces. Right: Resulting myocardium geometric model after merging the different meshes and removing the valves (see text).
Figure 7: Fibre Direction Field. Left: Fibre Directions at each point of the mesh are visualised in a 3D scene. They are colour-coded by their directions. Red/Green/Blue colours respectively mean an x/y/z-axis direction. Right: A cropping box allows to interact with this direction field and visualise only fibres of a specific region of the mesh.
2.5. Region Delineation 2.3. Motion Tracking As explained above, the left and right endocardia and the epicardium have been segmented on the first frame of the cardiac MRI sequence. In order to calibrate the physiological parameters of a model, one might find of interest to repeat the segmentation operation throughout the entire cardiac sequence in order to estimate the blood pool volume variation for instance. The platform allows to perform nonlinear image registration based on the diffeomorphic demons [VPPA07]. The first frame of the cardiac sequence can therefore be registered to the following frames. The resulting deformation fields are then used to propagate the myocardium mask throughout the cardiac sequence. The dynamic mesh of the myocardium is finally obtained by performing successive isosurface extractions on these binary masks.
We can observe from cine-MRI of our clinical example a dyskinetic area in the right ventricle. In order to adjust the anatomical model, we may need to delineate this region and associate specific physiological parameters to it. The delineation tool provided in the platform invites the user to interactively place some landmarks on the surface of the mesh in the 3D view (Fig. 8) to define a contour. We then use a vtkSelectPolyData to divide the underlying surface mesh in two distinct parts (i.e. each vertex of the mesh is designated to be contained by one of the two parts). This division can be used for several purposes. In our example, a vtkSelectPolyData is used to clip the mesh according to the delineation. Then the contractile element of the freshly delineated area is set to zero in order to reflect the pathological motion of this region.
2.4. Fibre Directions The fibre directions in the cardiac muscle have a important role. Since in-vivo measurement of these directions is still an open-challenge, we use a computational model to estimate them. Observations on anatomical dissections and diffusion tensor images showed that fibre directions vary from the epicardium to the endocardium. As detailed in [PSP∗ 07], we create synthetic fibre field by linearly interpolating their direction with respect to the short axis plane from 90o on the epicardium to 0o at mid-wall to +90o on the endocardium [SDA06]. As fibres are represented in the barycentric coordinate system of each tetrahedron, their reorientation will follow according to the deformation of the tetrahedra. This fibre orientation vector field can be visualised in our platform (Fig 7). Each normalised vector represents the fibre orientation at this point and is colour-coded by its direction. Red, Green and Blue respectively note the 3D axes. c The Eurographics Association 2008.
Figure 8: Region Delineation. Left: The dyskinetic area of the RV is delineated with the interactive placement of landmarks (yellow points) in the surface of the mesh. Right: We assign a lower contractile element to the delineated area to simulate the anomalous motion of the RV.
3. Processing: TCL script and Simulation Launching All pre-processing steps explained above lead to the generation of a patient-specific anatomical model of the heart.
N. Toussaint, T. Mansi, H. Delingette, N. Ayache and M. Sermesant / An Integrated Platform for Dynamic Cardiac Simulation and Image Processing
Moreover this model has been adjusted to fit the pathological conditions of the Tetralogy of Fallot. One can now use this model to simulate the patient cardiac function. Although simulation is not provided directly by the platform presented here, one can use the TCL script device to launch the simulations. This scripting tool integrated to the platform authorises to load and edit TCL scripts (Fig. 9). As detailed in Sect. 1.2, both visualisation and processing tools are available in TCL. Moreover, KWWidgets integrates a TCL interpreter that helps to fully exploit the scripting aspect of the platform. Hence we use the TCL interface in our example to call an external program and simulate the cardiac activity, given the anatomical initial conditions explained above.
• Active contractions: scalars that reflect the strength of the active force generated by the myocardium; • Depolarisation times of the electrical wave. A vtkMetaDataSetSequence [TSF] is created, containing the 85 frames of the cardiac cycle. Vertex positions at each time frame are associated to the corresponding frame mesh. As the topology of the mesh does not change among the sequence, a single VTK object explaining the topology (i.e. vtkCellArray) is given to all the frames. Scalar data are also associated to each time frame. Linear interpolation is used to map scalar information on the mesh object. For visualisation speed purposes, there is no time interpolation between frames. Hence the smoothness of the visualisation only depends on the time resolution of the simulation. In our example, the cardiac cycle simulations consists of 85 frames. The tetrahedral volume meshes are composed of about 80’000 tetrahedra and 12’000 vertices, and we obtain a frame rate of 40 frames per seconds on a NVIDIA GEForce 7400 with 512MB of dedicated memory. Fig. 10 shows the simulation results. The abnormal motion of the observed dyskinetic area has been qualitatively recovered by the model. The user has the possibility to manipulate a cropping box with control spheres, that cuts the tetrahedral mesh, allowing to visualise data inside the dynamic mesh.
Figure 9: Scripting Device. The platform provides a complete system to interpret TCL scripts. For instance, an external simulator can be launched through a TCL script. A TCL editor (available by pressing the F9 key) helps the user to load and edit TCL scripts. In this figure the editor has been filled with a template piece of TCL code. For this study we use coupled computational models of heart electrophysiology and myocardium biomechanics to simulate the cardiac function [SDA06]. The full cycle simulation takes about 15 minutes on a Intel Core2 Duo 2.4GHz machine with 4GB of RAM. The simulation generates a dynamic sequence of meshes (85 frames). The sequence incorporates some dynamic scalar attributes associated to each point of the mesh (i.e. the position, the active contraction, etc.). 4. Post-processing: Evaluation of Simulation Results 4.1. Dynamic Result Visualisation Among all information contained in the simulation resulting mesh sequence, we focus on three of them: • Vertex positions: they reflect the deformation of the myocardium during the cardiac cycle;
Figure 10: Simulation Results. Left: Dynamic information contained by the simulation results are fully exploited in the platform. Here the contraction scalar is mapped on the myocardium. Dyskinetic area is visible as the blue region. The abnormal motion of the observed dyskinetic area has been qualitatively recovered by the model. Right: A box is interactively manipulated to crop the mesh in order to visualise the values inside the mesh.
4.2. Mesh Intersections It is useful for analysing the simulation results to project the resulting mesh sequence back into the input MRI sequence. We use VTK implicit functions such as the vtkCutter to intersect mesh objects with the underlying image planes. As a result, cells contained in the mesh are intersected with the image current slice, leading to a loss of dimensionality (i.e. tetrahedra become triangles, triangles become lines). Scalar information that the mesh may contain is kept during intersection. c The Eurographics Association 2008.
N. Toussaint, T. Mansi, H. Delingette, N. Ayache and M. Sermesant / An Integrated Platform for Dynamic Cardiac Simulation and Image Processing
As shown on Fig. 11, the simulation results can then be compared both to the initial MRI sequence and to the dynamic segmentation of the myocardium as obtained in Sect. 2.3. This comparison may help at evaluating the relevance of the computed cardiac simulation. When the sequence is played, the intersection is automatically updated according to possibly new positions of mesh vertices. This is done by taking advantage of the pipeline system provided by VTK, as a simple invocation of a Modified event on the mesh object is sufficient to update the intersection process.
Figure 11: Mesh Projection. Tetrahedral volume meshes obtained by the simulations are cut with the image 2D plane, resulting in triangle slices. Left: Both the dynamic myocardium segmentation (green contour) and the simulation results (blue wireframe) are visualised in the 2D view containing the initial MRI sequence. Right: Scalar information is kept during the intersection so that it can be visualised. Here the active contraction map has been chosen. The blue area is the dyskinetic region of the right ventricle.
4.3. Dynamic Landmark Follow-up
Figure 12: Displacement patterns. Left: The vertex displacements (in mm) along the surface normal (with respect to a rest position) is shown. Two landmarks have been placed respectively in the healthy part (in blue) and the dyskinetic area (in red) of the right ventricle. Right: Graphs representing the evolution of the displacement among the sequence for both landmark locations, showing a significant difference of curve patterns. The vertical red line indicates current time line.
dyskinetic area. Graphs showing the evolution of the vertex displacements among the sequence are presented in Fig. 12. The red curve indicates a negative displacement (i.e. dilation) during the contraction phase of the cardiac cycle while the healthy pattern (in blue) reflects this contraction step with a positive displacement along the vertex normal. This pattern difference measured by the platform indicates that the model was able to correctly reproduce the dilation of the right ventricle.
4.4. Isosurface Extraction Among all dynamic scalar information provided by the simulation, depolarisation maps are commonly studied to analyse the cardiac function. For instance, it is useful to extract isochronous surfaces from them (i.e. locations in the myocardium where the depolarisation appears simultaneously).
Another post-processing tool provided in the platform uses the landmark system explained in Sect. 2.2 to follow the evolution of scalar information at a specific location in the myocardium. After placing the landmark at any position, the nearest vertex of the mesh is found. Then scalar data available at this vertex is used to build a graph representing the evolution of this scalar along the sequence frames (Fig. 12). The vertex index is given to the landmark as its additional information. This attachment between landmark and mesh vertex is then taken into account during dynamic rendering. That is, the landmark will follow the vertex position automatically. By repeating this operation, it is then possible to display several curves, in order to compare evolution patterns. For instance, we compute the vertex displacements (in mm) along vertex normals between each frame of the sequence and a frame of reference (here taken at end diastole). Then we place two landmarks on the surface of the right ventricle, one in a healthy part of the ventricle, and the other in the c The Eurographics Association 2008.
Figure 13: Isochronous surface extraction. the platform provides an interactive tool that extract isosurfaces from a dynamic mesh. Left: The user chooses some parameters such as the iso-value, multiple isosurfaces can be extracted. Right: Surfaces representing depolarisation isochrones are shown. As it is a dynamic mesh, the extraction is done on each time frame to build a sequence representing the depolarisation wave. The platform allows to extract any isosurface from a dy-
N. Toussaint, T. Mansi, H. Delingette, N. Ayache and M. Sermesant / An Integrated Platform for Dynamic Cardiac Simulation and Image Processing
namic scalar map. Hence we were able to display the resulting dynamic depolarisation wave from our simulation data (Fig. 13). The topology of such sequence of isosurfaces is intrinsically not consistent between time instances. In that case we assign a different vtkCellArray for each frame. 5. Other Applications Although our platform has been specifically designed for cardiac data, it can be suitable for the study of other dynamic physiological phenomena and their simulations. As an example, we show in Fig. 14 a simulation of in-silico tumor growth. In the state of the art growth models, the tumor is formulated such as it follows the white matter fibre tracts. Using the proposed platform, we were able to visualise this phenomenon clearly (Fig. 14, left). Moreover the visualisation in 3D gives us a better insight on in-vivo growth dynamics.
References [3DS] 3DSlicer: multi-platform, free open source software (foss) for visualization and image computing. http://www.slicer.org. [Car] CardioViz3D: Cardiac Data Processing and Visualisation. http://wwwsop.inria.fr/asclepios/software/CardioViz3D. [Del94] D ELINGETTE H.: Adaptive and deformable models based on simplex meshes. In IEEE Workshop of NonRigid and Articulated Objects (1994). [ISNC03] I BANEZ L., S CHROEDER W., N G L., C ATES J.: The ITK Software Guide, first ed. Kitware, Inc. ISBN 1-930934-10-6, 2003. [KWW] KWWidgets: Cross-Platform GUI ToolKit by Kitware, Inc. http://www.kwwidgets.org. [MeV] MeVisLab: Medical Image Peocessing and Visualization. http://www.mevislab.de/. [MIT] MITK: Medical Imaging Interaction Toolkit. http://www.mitk.org/. [Ope] OpenMAF: Multimod Application Fpplication Framework. http://openmaf.cineca.it/maf. [Par]
ParaView, Kitware Inc. www.paraview.org. ∗
Figure 14: Brain tumor growth simulation results. Tumor boundaries in green are visualised with a Fractional Anisotropy map of the brain. Dynamics of the tumor growth can be qualitatively evaluated by the proposed software.
6. Discussions and Conclusion In this paper we presented a freely available integrated platform that is dedicated to dynamic cardiac simulation and image processing. By taking the example of the personalised simulation of the Tetralogy of Fallot, we have shown that the platform uses advanced and interactive frameworks to provide researchers and clinicians with adapted tools for preprocessing dynamic data, from the segmentation of the myocardium to the delineation of pathological regions, resulting in a patient-specific anatomical and geometrical model of the heart. We also have demonstrated that simulation results can be intuitively evaluated and compared to initial clinical data. Moreover, the kernel of our platform, vtkINRIA3D, is available as an open-source compilable code, and is provided with code examples and documentation. Recent improvements in VTK have shown significant interest in dynamic data handling (e.g. vtkTemporalDataSet). Part of our future work will focus in the possibility of fusing both dynamic data handling approaches.
[PSP 07] P EYRAT J.-M., S ERMESANT M., P ENNEC X., D ELINGETTE H., X U C., M C V EIGH E. R., AYACHE N.: A computational framework for the statistical analysis of cardiac diffusion tensors: Application to a small database of canine hearts. IEEE TMI 26, 11 (2007), 1500–1514. [RSR04] ROSSET A., S PADOLA L., R ATIB O.: Osirix: An Open-Source Software for Navigating in Multidimensional DICOM Images. Journal of Digital Imaging (2004). [SDA06] S ERMESANT M., D ELINGETTE H., AYACHE N.: An electromechanical model of the heart for image analysis and simulation. IEEE TMI 25, 5 (2006), 612– 625. [TO99] T URK G., O’B RIEN J.: Variational Implicit Surfaces. Tech. rep., Georgia Institute of Technology, 1999. [TSF] T OUSSAINT N., S ERMESANT M., F ILLARD P.: vtkINRIA3D: A VTK Extension for Spatiotemporal Data Synchronization, Visualization and Management. In Proc. Workshop on Open Source Open Data, MICCAI’07. http://www-sop.inria.fr/asclepios/software/vtkINRIA3D. [VPPA07] V ERCAUTEREN T., P ENNEC X., P ERCHANT A., AYACHE N.: Non-parametric diffeomorphic image registration with the demons algorithm. In Proc. MICCAI’07 (2007). [VTK] VTK: The Visualization Toolkit by Kitware, Inc. http://www.vtk.org.
c The Eurographics Association 2008.