Furthermore, displaying only raw data is not sufficient, because the security ..... The VISITORS includes two modules: the Query Builder module which enables the .... S. Closing-the-loop in NVisionIP: integrating discovery and search in security ...
An Intelligent, Interactive Tool for Exploration and Visualization of Time-Oriented Security Data Asaf Shabtai
Denis Klimov
Yuval Shahar
Yuval Elovici
Deutsche Telekom Laboratories at Ben-Gurion University, Beer-Sheva, Israel
{shabtaia, klimov, yshahar, elovici}@bgu.ac.il ABSTRACT
1. INTRODUCTION
The detection of known and un-known attacks usually requires the interpretation and presentation of very large amounts of timeoriented security data. Using regular means for displaying the data, such as text or tables, is often ineffective. Furthermore, displaying only raw data is not sufficient, because the security expert is still required to derive meaningful conclusions from large amounts of data. In addition, in many cases (e.g., for detecting a virus spreading in the network), an aggregated view of multiple network devices is more effective than a view of each individual device. In this paper we propose an intelligent interface used by a distributed architecture that was described in our previous work, specific to the tasks of knowledge-based interpretation, summarization, query, visualization and interactive exploration of large numbers of time-oriented data. In order to support the interpretation and computation process, we provide automated mechanisms that perform derivation of contextspecific, interval-based abstract interpretations (also known as Temporal Abstractions) from raw time-stamped security data, by using a domain-specific knowledge-base (e.g., a period of 5 hours, during the night, of a high number of FTP connections within the context of No User Activity, which might indicate the existence of a Trojan in the computer). The proposed visualization tool includes several functionalities for querying, visualization and exploration of both raw and abstracted time-oriented security data regarding single and multiple network devices.
Network administrators are coping with many types of attacks. Detecting and blocking malicious activity involves using tools that collect raw data from the network (or from the hosts). These data are presented and sometimes processed in order to detect abnormal activity [1].
Categories and Subject Descriptors C.2.0 [Computer - Communication Networks]: General – Security and protection C.2.3 [Computer - Communication Networks]: Network Operations – Network monitoring H.5.2 [Information Systems]: Information Interfaces and Presentation User interfaces I.5.5 [Computing Methodologies]: Pattern Recognition - Implementation
General Terms Security
Keywords Intelligent Visualization, Security, Knowledge-Based Systems, Temporal-Abstraction, Human-Computer Interaction
Permission to make digital or hard copies of all or part of this work for personal or classroom use is granted without fee provided that copies are not made or distributed for profit or commercial advantage and that copies bear this notice and the full citation on the first page. To copy otherwise, or republish, to post on servers or to redistribute to lists, requires prior specific permission and/or a fee. VizSec’06, November 3, 2006, Alexandria, Virginia, USA. Copyright 2006 ACM 1-59593-549-6/06/0011…$5.00.
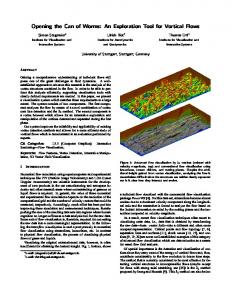
A properly designed visual representation of network data, as opposed to textual representation, can assist in analyzing a greater amount of data in a shorter time [2]. Existing tools use various 2D and 3D visualization techniques for presentation of raw network data. However, displaying only raw data is not sufficient, because the user is still required to perform additional processing and analysis in order to derive meaningful interpretations, especially when the network is being attacked and time plays a very important role. In order to solve this problem, we employ the knowledge-based temporal abstraction (KBTA) method [3] for an automated derivation of context-specific interpretations and conclusions, called temporal abstractions, from the raw time-oriented data, by using a security-specific knowledge-base (KB). In general, the KBTA method is defined as follows [4-6]: The input includes a set of time-stamped parameters (e.g., number of FTP connections at each time-point) and events (e.g., keyboard activity or mouse activity) which create the necessary interpretation context (e.g., No User Activity – when the mouse and keyboard were not used). The output includes a set of interval-based, context-specific parameters at the same or at a higher level of abstraction and their respective values (e.g., a period of 5 hours of a high number of FTP connections within the context of No User Activity). The KBTA method requires a knowledge acquisition phase in which the proper knowledge elements and the relations between them are defined by the domain expert (i.e., security expert). The knowledge acquisition is achieved by using a tool that we have developed for this task. An example of the temporal abstraction process is shown in Figure 1, which illustrates the derivation of a worm pattern. The input to the KBTA inference mechanisms consists of raw measurements of "System Context Switches" and "TCP Connection Failures" at T1 - T6, and the "Browser Open" event, which creates the "Internet Connection Mode" context. Then, within the "Internet Connection Mode" context, Very-High "System Context Switches State" is interpreted from the "System Context Switches" raw data; and, an Increasing "TCP Connection Failures Gradient" is interpreted from the "TCP Connection Failures" raw data. The worm pattern is created from these two contemporaneous abstractions.
2. BACKGROUND AND MOTIVATION Intrusions or propagation of malicious programs (e.g., worms) often start with the attacker scanning the network, in order to detect active hosts, and scanning the target computer for known vulnerabilities and open ports that can be exploited. Thus, most visualization tools in the security domain focus on network traffic visualization and the inter-communication between hosts to assist the security expert in detecting attacks and reconnaissance activity. Researchers in the areas of visualization of security time-oriented data have developed useful visualization techniques for static presentation of raw data and for browsing information [8-9]. Figure 1. An example for the Temporal Abstraction process The derived temporal abstractions can be visualized and explored using a tool designed for this purpose, called KNAVE-II (Knowledge-based Navigation of Abstractions for Visualization and Explanation) which we have developed and well evaluated [7]. KNAVE-II supports the visualization of one subject at a time (e.g., a single computer). However, for various security tasks, such as coping with distributed attacks, an aggregated simultaneous view of a group of subjects is more effective than a view of each subject separately. We provide an enhanced version of the KNAVE-II, a system called VISITORS (Visualization and Exploration of Multiple Time-Oriented Records) which enable visualization and exploration of a group of subjects at various levels of abstractions (i.e., summarization), by capitalizing on the use of our temporal abstractions mechanisms. KNAVE-II and VISITORS tools can assist network administrators to explore and detect abnormal behavior of network traffic or computers. The combination of three important features distinguishes our visualization tools from others: 1) Handling and visualizing of both individual and multiple subjects. For example, the user can view information about a single computer as well as a sub-group of computers. 2) Handling of the temporal dimension as a first class citizen. The temporal dimension can be explored in various granularities, such as second, day, and month. We also support a calendar timeline and a relative-to-special-events timeline (e.g., Installation event). 3) The method used automatically provides a meaningful summarization from raw time-oriented data, based on the temporal-abstraction security ontology. The user interface is also based on that security ontology, which improves exploration of the data and enables the navigation of semantically related raw and abstract concepts. For example, the user can explore graphically an instance of a spyware pattern that was derived by the KBTA inference mechanism and see all the data from which the pattern was derived (the spyware pattern definition was previously defined by the security expert as a part of the security ontology). The rest of this paper is organized as follows: In Section 2 we present some of the existing visualization methods in the security domain. In Sections 3 and 4 we present our innovative visualization of security data. Conclusions and future work are discussed in section 5.
In [10] a histogram visualization of aggregated port activity is used. The x-axis represents the time and the y-axis represents the packets count or bytes for a group of ports, thus it allows the user to see trends in port activity over time. The tool enables drillingdown for further details. In [11] a visualization of the communication between a local IP address and remote IP addresses and local ports with remote ports over time is proposed. At each time-point a line connects the local hosts' IP addresses with communicating remote IP addresses and the pairwise communicating ports, and thus depicts trends in the connection between local hosts with remote hosts. VizFlowConnect, which is described in [12], also visualizes network traffic from external hosts to internal host by connecting lines between external hosts with internal hosts. The thickness of a line indicates asymmetric traffic. The tool enables filtering of traffic related to specific ports or hosts. The NVisionIP [13] is a visualization tool that displays a wide range of network characteristics. The collected network data represent aggregated traffic between two hosts, that include the IP address and port numbers of the source and destination, start and end time of the flow, the protocol used for the specific flow and the volume of traffic. The user interface provides three views of the network at various levels of granularity (i.e., semantic zoom): (1) the Galaxy View provides the broadest possible view of the network; (2) selecting a rectangular region in the Galaxy View will open the Small Multiple View, which visualizes traffic on ports, for the selected hosts; (3) the Machine View provides the most detailed view for a selected single host (e.g., counts of bytes and flow on each port for all TCP traffic). The NVisionIP also enables the user to filter or aggregate an interesting set of hosts based on any combination of IP addresses, ports or protocols. The main disadvantage of the NVisionIP is that it provides a static view of the network, and the security experts can see only the current state of the network. Additionally, the NVisionIP does not raise alerts, and thus, the network analyst must identify the potential attacks by herself. In [14] the NVisionIP is enhanced by enabling hierarchical filter definition in which the user can place constraints on the IP address of the machine, ports, and protocols. The PortVis [15] visualizes summarized information of the activity on each TCP port during a specific time period and helps reveal interesting events. Three possible visualizations are presented simultaneously: (1) the timeline visualization - a visualization of the entire time range available to the system from its data source; (2) the main visualization depicts the activity during a given time unit. It consists of a 256 × 256 grid in which each dot represents one of the 65,536 ports. Each port's color
represents the state of the number of sessions on the port. Dark blue ports denote a low number of sessions and white ports denote a high number of sessions; (3) the port visualization - a view of activity of a particular port. The common scenarios for using the PortVis tool are either when a particular block of ports is identified at a particular time that warrants further investigation using the timeline visualization, or when the user is employing main visualization techniques, and then wants to focus on a particular suspicious port using the port visualization. Detecting interesting patterns and anomalies requires human expert intervention. The authors in [16] propose a port-based visualization system, based on the PortVis tool, which provides additional visualizations such as the 3D Volume visualization for time-varying ports attributes. The authors in [17] offer three 3D visualizations of network activity and IDS alerts: (1) the Trend Concept visualization is 3D bar chart visualization that focuses on port network statistics. The position of the bar is determined by port number and time. Each bar actually consists of two components: the first represents the average amount of activity; and the second represents the actual amount of activity. If an alert is associated with the port at a specific time-point, a sphere is drawn on top of the bar; (2) the Alert Plot Concept visualization focuses on alerts for each port. The visualization uses multiple time-scales to show short- and long-term patterns; and (3) the Island Concept visualization focuses on port activity and visualizes the amount of activity on a port and relevant IP addresses.
and calendar-view visualizations, which represent the frequency of events in each day. The calendar view is used for visualization of both the data and the discovered patterns. Bade, Schlechtweg and Miksch [24] offer an approach for visualization that supports the exploration and understanding of time-oriented data. Timeboxes and angular queries are used within the TimeSearcher visualization tool [25-26] to enable interactive exploration of time-oriented data and for discovering repeating patterns in long time series data. Chittaro and Combi [27] focus on visualizing temporal intervals and their relations, mainly for querying time-oriented data. However, these methods, while offering good visualizations, emphasize the display of only raw data and do not focus on visualization of derived temporal conclusions or of meaningful patterns, by using domain-specific knowledge. In the next sections we will describe the proposed visualization tools and their main functionalities.
3. KNAVE-II: VISUALIZATION AND EXPLORATION OF TIME-ORIENTED DATA KNAVE-II is a visualization interface employed by a distributed architecture, which we described in [3], that generates contextsensitive interpretations (temporal abstractions) from raw data.
The binary Rainfall [2, 18] visualizes network packets. The bits of each packet are plotted as pixels in direct correspondence to the structure of the binary data. It is suggested that the proposed graphical presentation can assist in detecting general patterns and anomalies within the network traffic. Some of the visualization tools visualize the generated alerts. The IDS RainStorm [1-2] Main View visualization presents an overview of alarms related to each IP address. The color of an alarm represents its severity. The user can select a range of IP addresses and use the Zoom View that focuses on the selected hosts and provides additional information for each alarm. The scan visualization system [19] uses visualization to assist the user in clustering and categorizing network scans. The alarm visualization [20] transforms alerts into tokens that can be visualized in chronological order and generates visual patterns. SnortView in [21] supplies visualizations for snort intrusion detection system alerts [22]. Not all of the alert visualization tools enable drilling-down and exploration of the raw data that created the alert. The described visualizations have several drawbacks. All of the tools supply specific-task visualizations, usually for detecting abnormal network activity by visualizing port or IP address activity, and cannot be easily modified to support additional tasks or data visualizations such as system or user activity. Furthermore, time is an important feature while trying to detect attacks. Not all of the visualizations relate to the time as a first class citizen, and those which do support temporal visualization cannot provide meaningful summaries of large amounts of time-oriented data, thus requiring the security expert to analyze the data by himself. Other tools exist who offer general methods for visualizing timeoriented data. DataJewel [23] combines data mining algorithms
Figure 2. The distributed KBTA architecture Figure 2 describes the KBTA architecture. Domain experts use the Knowledge-Acquisition Tool to maintain the knowledge-base(s). The Temporal Abstraction (TA) Controller integrates the relevant data and knowledge from the appropriate sources, indicated by the user, to answer queries regarding raw or abstract time-oriented concepts. The KNAVE-II module enables users to submit timeoriented queries interactively, and to visualize and explore both raw data and their interpretations. The KNAVE-II system was designed according to a set of well designed desiderata, which includes the following requirements particularly: Visualization - Effective visualization and exploration, which should include both the raw security time-oriented data and the meaningful interpretations and conclusions derived from these data. Temporal granularity - The visualization should support interactive exploration of time-oriented data at different temporal granularities (e.g., seconds, hours, days).
Absolute and Relative timelines - The system should support both a calendar-based timeline and a relative timeline, which refers to significant events (e.g., installation of software). Exploration of the knowledge-based ontology - Effective exploration of both the raw data and their abstractions, using meaningful domain-specific semantic relations (e.g., derivedfrom, part-of); enabling the explanations of the abstractions using relevant knowledge. In the rest of this section we will describe how the KNAVE-II supports all desiderata.
3.1 Visualization Figure 3 shows the main interface of a KNAVE-II client. KNAVE-II enables the user to explore interactively and dynamically raw data (e.g., CPU Usage, TCP Connection Failures), and their abstractions, defined as part of the knowledge-
based ontology (the browser to this ontology is shown on the left side of the KNAVE-II main interface), are defined by the security expert in advance. To support security exploration it is imperative to provide several types of descriptive statistics as part of the interactive visualization and exploration. Statistics in KNAVE-II can be computed and displayed for either raw data or abstracted parameters. The computation of statistics is sensitive to the particular time window displayed in each panel, and thus changes dynamically when the contents of the panel are changed. Default statistics for raw data types include descriptive statistics such as mean, maximum, minimum, standard deviations, etc. (see 4th and 6th panel from the top in Figure 3). In the case of abstract data types, the default statistics displayed are a detailed distribution of the duration of each value of the abstraction (see 5th and 7th panels from the top in Figure 3).
Figure 3. Exploring the data of a single computer in the KNAVE-II system. On the left hand side, a browser to the security domain ontology, coming from the ontology knowledge-base, is shown. The user selects raw data type (e.g., executables number) or an abstract concept (e.g., worm alert) by clicking on a node in the browser’s ontology tree. The data of the selected node will be displayed on the right hand side as panels. The above example shows the exploration of a "worm alert" (1st panel from the top) detected on a specific computer. The verbal definition of the pattern is: “IF within an Internet connection context (2nd panel from the top) an increasing amount of TCP connection failures is detected (5th panel from the top) and a very-high system context switches state is derived (3rd panel from the top), THEN a worm alert is derived”. As shown in the figure, the worm was activated at 07:55:30. Raw data that participate in the derivation of the temporal pattern are shown in the 4th and 6th panels from the top. The 4th, 5th, 6th and 7th panels from the top present various pieces of statistical information. Moving the mouse over a panel opens a tool tip with additional information.
3.2 Temporal Granularity Temporal granularity is a very important theme during exploration of time-oriented data. The exploration of the same data within various granularity levels might lead to different conclusions. KNAVE-II implements four operators (zoom-in functions) for manipulating temporal granularity. The first three are shown in Figure 4: (a) The Random Granularity Zoom enables specification of any desired temporal granularity (e.g., second, month); (b) the Calendaric-Range Zoom uses a standard calendar function to enable the user to specify the start and end time-points to zoom-in into a specific absolute time range; and (c) the Time-Granule Sensitive Zoom enables users to select a specific predefined period of time of a predefined granularity, within the timeline of a particular panel (e.g., "May 15th 2006") by clicking on that granule (e.g., click on "15" within the "May 2006" timeline).
Figure 6. Absolute/relative timelines in KNAVE-II. Once the relative timeline has been set by selecting the event "Opening a browser" as the reference point, the time display will change to +/units starting from that event. The selection of the time reference event is done by selecting a predefined reference event from the knowledge-base. Here, both the raw data and its abstraction are displayed in granularity of minutes relative to the event.
3.4 Exploration of Raw Data and Abstractions
Figure 4. Temporal granularity operators The Content-Based Zoom (see Figure 5) enables users to mark specific contents in the panel, whether within a complete temporal-granularity unit or not (see shadowed area), and then zoom into the temporal range implicitly determined by these contents. The user indicates the temporal region of interest by marking-up the range of interest (indicated by the shadowed area), which is then expanded to fill the whole panel (bottom).
Figure 5. Content-based zoom operator
3.3 Absolute and Relative Timelines To change the point of view dynamically from an absolute (calendar-based) timeline to a relative timeline is another KNAVE-II innovative capability. The relative timeline is set by identifying security significant events in the security domain ontology (e.g., reboot, installation), which serve as a date of reference (time zero) to all the other displays. Such a feature would be useful for detecting various types of attacks. Assume the following scenario: a number of computers in a specific organizational unit were infected by a worm. Although each computer might have been infected at a different time-point, the user can align the data parameters to the specific event by, e.g., activating an email attachment, and visually recognize the same behavior pattern after that event. Once the relative timeline has been selected the time display will change to +/- time units starting from that event, based on the time granularity selected (hours, days, months). The user can interactively select the event to be used as the zero-time reference, through access to the predefined list of potential reference points (Figure 6).
Exploration of raw data and abstract concepts includes navigation along semantic links in the domain’s temporal-abstraction ontology, such as abstracted-from relations, using the semantic explorer (Figure 7). By using this explorer the user is able to obtain context-sensitive explanations in reply to questions such as “In which patterns does the specific parameter take part?”, or “From what data is this alert derived?” We have defined four types of special semantic relations of a concept in the knowledgebased temporal ontology [4], which are: the meta-children relation, such as abstracted-from in the case of parameters, or parts in the case of events; the meta-parents relation, such as abstracted-into in the case of parameters, or part-of in the case of events; the meta-siblings relation, such as the other arguments in the function defining the parameter, or other components on the pattern into which the current entity is abstracted, or other parts of the event of which the current event in focus is a part; and the context relation, such as the generated-context relation for most entities, or the generated-from relation in the case of contexts themselves. These special relations depend on the type of concept in the current focus, and enable the user to navigate to other concepts semantically related to the focused concept. Table 1 summarizes and briefly describes the types of special semantic relationships. Table 1. Types of special semantic relationships Relation MetaType Children Parameter Abstractedfrom Event
Parts
Pattern
Components
Context
Sub-Context
MetaMeta-Siblings Parents Abstracted-into Other parameters abstracted into the "parent" parameter Parts-of Other parts belonging to the "parent" event Components-of Other components defining the "parent" pattern Super-Context Other sub-contexts of the super-context
Contexts Generated context Generated contexts Generated contexts Generated from
especially when the number of subjects is very large, or when the user is trying to detect distributed or propagated attacks. Since the KNAVE-II enables visualization and exploration of an individual subject (e.g., computer, server), we introduce its enhanced version VISITORS (Visualization and Exploration of Multiple TimeOriented Records) [28]. Similarly to the KNAVE-II, VISITORS interacts with the Temporal Abstraction Controller (Figure 2) by queries, but the fashion of interaction is different.
Figure 7. Exploration of data and knowledge in KNAVE-II. The user employs the semantic relationships of a concept, which depend on its type (e.g., abstracted-from, abstracted-into, siblings, created context, etc.) to navigate to other concepts semantically related to the original concept. The KNAVE-II system also enables explanation of displayed abstractions or high-level derived patterns. In these explanations the user receives the answer to a question such as: “what classification functions define this abstraction?” In such a case the user will be shown the knowledge-based definition of the concept (See Figure 8).
Figure 8. Knowledge-based explanation. The user can examine the temporal-abstraction knowledge that was used to derive a specific displayed concept. Note that the user can click on the "Persistence Function" tab to explore the interpolation function used to join separate data points or intervals into a longer interval. KNAVE-II also supports easy and fast search and retrieval of ontology-based security-significant concepts. The search and retrieval service (shown at the left bottom side of the main interface in Figure 3) enables a text-string lexicographic search. The search retrieves all the related concepts from the domain’s temporal-abstraction ontology. Clicking on a Find Similar checkbox triggers the retrieval of similar-sounding concepts without requiring the user to have prior knowledge about the exact form a concept takes in the ontology knowledge-base.
4. VISITORS: MULTIPLE TIMEORIENTED RECORDS EXPLORATION As mentioned before, an aggregate view of multiple subjects is sometimes more essential than a separate view of each subject,
The VISITORS includes two modules: the Query Builder module which enables the construction of aggregation queries, and the visualization and exploration module of the time-oriented security data.
4.1 Aggregation Queries We have designed a formal representation of our aggregation queries language, which queries the set of subjects. We distinguish between three types of queries: Get Subjects Query. This query retrieves the list of subjects from a selected database which satisfy a set of constraints, defined by user. The user may exploit three types of constraints: -
Non-Temporal constraints such as IP address, computer ID, computer location, etc.
-
Time and Value Knowledge-based constraints. Use both raw and derived temporal abstraction concepts and their values in order to define bound constraints on the value of a concept, duration of a concept, and start/end point of a concept. Definition of time and values pairwise interrelations between concepts is available as well.
-
Statistical constraints. By such constraints the user is able to investigate which are the subjects in the database having specific values (or range of values) within a given statistical range of threshold values.
By using the Get Subjects Query, the user can construct the following complex query: “Select all the computers and servers in the management department whose CPU Usage State was abstracted as Very-High for more than 80% of the time for at least one hour after Windows patching.” Get Temporal Intervals Query. The result of this query is a set of time intervals when certain portions of the subjects have a specific value within a predefined range. For example, “Select all time-intervals over which after an Installation event a computer was infected by a virus within the next hour.” Get Concept Data Query. Given a list of subjects and a list of interesting time intervals, this query retrieves the time-oriented data (raw or abstract) of a selected concept. For example, “What was the value of the IP Scan State during January 17-21 for computers #1 - #10.” It must be noted that no existing SQL or other query tool can answer the above queries, because the processing of such queries requires temporal reasoning mechanisms to be applied. The processing of our aggregate queries may take a lot of time, especially in the security domain, which deals with a great amount of data and where the number of subjects is very large. We address this problem by using two approaches which reduce the computation time of query processing: (1) parallel computation of the temporal abstractions on multiple machines; and (2) using data-driven incremental temporal abstraction computation in
which only the relevant abstractions are updated when new data arrive, and all of the derived abstractions are stored in a database [29, 30].
4.2 Visualization Tasks in VISITORS The data-set retrieved by the Get Data Concept Query, i.e., the subject’s time-oriented data, can be represented in a visual form. Our design supports visualization for both raw and abstract data sets. Generally we explore four dimensions or axes in our visualization. First, all visualized data are time-oriented. Second, we visualize data for a group or union of subjects as well as individual subject’s data visualization. Third, we can show the subject’s data for each concept separately (e.g., CPU usage, amount of packets, etc.) or visualize interrelations between number of concepts. Last, we can represent data within various time granularities (e.g., the maximal value of the day or per hours). Below we present several examples of the visualization tasks that we support.
4.2.1 Visualization of a single-concept over time Figure 9 visualizes the data of a single raw parameter (CPU Usage) over time for a group of computers. The horizontal axis represents the timeline (February 2006) and the vertical axis represents the concepts possible values in percents. The points' insight and their level of saturation enable the viewer to judge the average amount of items belonging to each area. Minimal values are indicated by the bottom blue line and maximal values of a group by the top red line.
4.2.2 Visualization of associations among multiple concepts over time This type of visualization (see Figure 11) is designed for the case in which we need to view interrelations between data of a number of concepts for a group of subjects. By using this visualization the user is able to compare the data of predefined concepts for a group of selected computers, for example, the inter-relations between the following concepts: CPU usage – Memory usage – Incoming traffic – Out going traffic. Furthermore, the visualization enables the user to answer the question: “how can constraining one parameter affect the association between multiple concepts?” by applying necessary constraints. The user can change the range of the values on the raw data axis by trackbars, (e.g., a range of 80%-100% of CPU usage) and view how reducing them influences the other parameters; or choose some values on the abstracted data (e.g., High value of IP Datagrams Sent) in order to view the correspondent values of other parameters in a group. In the example in Figure 11, the user selected two primitive concepts (CPU Usage and Memory Usage) and two abstract concepts (IP Datagrams Received State and IP Datagrams Sent State). The values of the abstract concepts are indicated by their color, from bottom to top: very-low – blue; low – light blue; normal - green; moderately high - yellow; high – orange; veryhigh - red). Values for visualization were chosen from a specific time interval, e.g. May 2006, specified dynamically by the user (note: the user can explore the correlations among selected parameters within various selected time intervals and within various time granularities). Each point on a value axis represents the mean value of the corresponding concept for one computer during May 2006. The correspondent values for one computer are underlined by wide connected lines. At the top of the display the user can see the units of the corresponding axes.
Figure 9. Visualization of raw parameter for a group of computers Figure 10 visualizes the distribution of an abstract parameter (GIF Downloaded State) for a group of computers. In this view the horizontal axis represents the timeline (May 2006) and the vertical axis represents the distribution of the values of the derived parameter. Each value is presented by a color (from bottom to top: “low”- blue, “normal” – green, “high” – yellow, and “very-high” red). The user can see the proportions of the number of computers in each value for the required time interval (e.g., on May 10, 25% of the computer had the value “Very-High”).
Figure 10. Visualization of the distribution of an abstract parameter
Figure 11. Visualization of multiple concepts associations
5. DISCUSSION In this paper we have presented two tools that enable the user to visualize and explore raw time-oriented security data and higher level context-specific interpretations, derived from the raw data, based on predefined knowledge. The visualizations of both tools provide simple summarized graphical views of the relevant data, thus enabling the user to understand the state of the monitored device quickly and to identify potential attacks. Once an attack has been identified the tool can assist in tracing back the source of the attack by further query and exploration of the security data. KNAVE-II tool provides visualization and exploration of the time-oriented security data of a single device. VISITORS provides, in addition to the KNAVE-II visualizations, aggregated visualizations that will enable the user to detect propagated
attacks in the network and summarization of the overall state of the network.
[9] Conti G. Network Attack Visualization. DEFCON 12, August 2004.
Knowledge-based interpretations and their visualizations will allow naïve users to explore complex alarms or patterns previously defined by a security expert and to recognize various types of attacks such as port scanning, worm infection (see Figure 3), or any other type of attack.
[10] Abdullah K., Lee C., Conti G. and Copeland J. Visualizing Network Data for Intrusion Detection. IEEE Information Assurance Workshop (IAW), 2005.
The visualization tools provide a uniform presentation for the various types of data and temporal abstractions, and thus, once a new type of attack is released, the security expert needs only to update the knowledge-base (i.e., there is no need to modify the tools, only the ontology underlying them). We intend to evaluate both tools with the assistance of system administrators and of security experts. By using the security ontology with additional temporal patterns of attacks (e.g., "a high number of FTP connections while there is no user activity", a pattern that might indicate a Trojan behaviour; "increasing number of RST packets", a pattern which might indicate port scanning, etc.), we would like to evaluate the functionality and usability of the tools for assisting the user in the performance of the following tasks: (a) identifying attacks or significant patterns; (b) identifying the source of an attack by exploring the data; and (c) understanding the overall status of the network over time.
6. ACKNOWLEDGMENTS This work was supported by the Duetsche Telekom Company.
7. REFERENCES [1] Abdullah K., Lee C., Conti G., Copeland J. A. and Stasko J. IDS RainStorm: Visualizing IDS Alarms. Workshop on Visualization for Computer Security (VizSEC05), USA, 2005.
[11] Erbacher R.F., Kim C. and Sundberg A. Designing Visualization Capabilities for IDS Challenges. Proceedings of the IEEE Visualization for Computer Security, 2005. [12] Yin X., Yurcik W., Li Y., Lakkaraju K., and Abad C. Visflow - connect: Providing security situational awareness by visualizing network traffic flows. Proceedings of the Workshop on Information Assurance (WIA04), 2004. [13] Lakkaraju K., Yurcik W. and Lee A. J. NVisionIP: NetFlow Visualizations of System State for Security Situational Awareness. Proceedings of CCS Workshop on Visualization and Data Mining for Computer Security, 2004. [14] Lakkaraju K., Bearavolu R., Slagell A., Yurcik W. and North S. Closing-the-loop in NVisionIP: integrating discovery and search in security visualizations. Workshop on Visualization for Computer Security (VizSEC05), October, 2005. [15] McPherson J., Ma K. L., Krystosek P., Bartoletti T. and Muelder C. PortVis: A Tool for Port-Based Detection of Security Events. Proceedings of CCS Workshop on Visualization and Data Mining for Computer Security, 2004. [16] Muelder C., Ma. K. L. and Bartoletti T. Interactive Visualization for Network and Port Scan Detection. Proceedings of RAID 2005, September, 2005. [17] Oline A. and Reiners D. Exploring Three-dimensional Visualization for Intrusion Detection. Workshop on Visualization for Computer Security (VizSEC05), October, 2005.
[2] Conti G. et al. Countering Security Analyst and Network Administrator Overload Through Alert and Packet Visualization. IEEE Computer Graphics and Applications, March 2006.
[18] Conti G., Grizzard J., Ahamad M. and Owen H. Visual Exploration of Malicious Network Objects Using Semantic Zoom, Interactive Encoding and Dynamic Queries. Workshop on Visualization for Computer Security (VizSEC05), October 2005.
[3] Shabtai A., Shahar Y. and Elovici Y. Using the KnowledgeBased Temporal-Abstraction (KBTA) Method for Detection of Electronic Threats. the 5th European Conference on Information Warfare and Security (ECIW2006), Finland, June 2006.
[19] Muelder C., Ma K.L., Bartoletti T. A Visualization Methodology for Characterization of Network Scans. Workshop on Visualization for Computer Security (VizSEC05), October, 2005.
[4] Shahar Y. A framework for knowledge-based temporal abstraction. Artificial Intelligence, 90(1.2): 79.133, 1997. [5] Shahar Y. and Musen M.A. Knowledge-based temporal abstraction in clinical domains. Artificial Intelligence in Medicine 8(3): 267.298. 1996. [6] Shahar Y. Dynamic temporal interpretation contexts for temporal abstraction. Annals of Mathematics and Artificial Intelligence. 22(1-2): 159-92, 1998. [7] Martins S.B., Shahar Y. et al. Evaluation of KNAVE-II: A tool for intelligent query and exploration of patient data. Proceedings of Medinfo 2004, San Francisco, CA, September, 2004. [8] Conti G. Malware Cinema: A Picture is Worth a Thousand Packets. Black Hat Europe, March 2006.
[20] Colombe J.B. and Stephens G. Statistical Profiling and Visualization for Detection of Malicious Insider Attacks on Computer Networks. ACM Workshop on Visualization and Data Mining for Computer Security (VizSEC/DMSEC04), 2004. [21] Koike H. and Ohno K. SnortView: Visualization System of Snort Logs. ACM Workshop on Visualization and Data Mining for Computer Security (VizSEC/DMSEC04), USA, 2004. [22] Snort - An open source network intrusion prevention and detection system, http://www.snort.org/. [23] Ankerst M., Jones D.H., Kao A. and Wang C. DataJewel: Tightly integrating visualization with temporal data mining. ICDM Workshop on Visual Data Mining, 2003.
[24] Bade R., Schlechtweg S. and Miksch S. Connecting timeoriented data and information to a coherent interactive visualization. CHI 2004:ACM Press, 2004, pp. 105-112.
[28] Klimov D. and Shahar Y. A Framework for Intelligent Visualization of Multiple Time-Oriented Medical Records. AMIA, 2005.
[25] Buono P., Aris A., Plaisant C., Khella A. and Shneiderman B. Interactive pattern search in time series. Conference on Visual Data Analysis, January 2005.
[29] Spokoiny A., and Shahar Y. Momentum – an active timeoriented database for intelligent abstraction, exploration and analysis of clinical data. Proceeding of the workshop on Intelligent Data Analysis in Medicine and Pharmacology (IDAMAP2003), Cyprus, 2003.
[26] Hochheiser H. and Shneiderman B. Dynamic query tools for time series data sets: Timebox widgets for interactive exploration. Information Visualization, vol. 3, pp. 1-18, 2004. [27] Chittaro L. and Combi C. Visualizing queries on databases of temporal histories: new metaphors and their evaluation. Data and Knowledge Engineering, vol. 44, pp. 239-264, 2003.
[30] Spokoiny A. and Shahar Y. Momentum – An active timeoriented database for intelligent abstraction, exploration and analysis of clinical data. Medical Informatics (MEDINFO). San Francisco, 2004.