An Interactive Decision Support Application for Learning Assessment in a Class Setting Bee Yew This paper presents a functional learning assessment application that meets the needs of both the instructor and students in a class setting. For the instructor, the focus of this interactive application is on the management of class learning assessment. This interactive spreadsheet application is independent of the grading scale for course items and is based on course item weights and weighted score percentages. A demonstration of a grade performance analysis for a database management system course reflects class achievement of instructional goals under equitable learning achievement option plans. For self-regulated student learners who seek to improve their class performance, this application facilitates making adjustments in learning strategies. This application bridges the concept of a self-regulated learner with learning outcomes through its tracking, what-if, and goal-seeking capabilities. The goal-seeking feature in this application allows students to determine the required minimum grade required for a specific course item to maintain or improve their current grade standing in class. A survey of students using this application revealed the perceived usefulness of this application in the areas of decision support and increased understanding of the learning criteria used by the instructor to assess class performance.
Introduction The role of grades in learning assessment and methods of assessing student performance has been investigated and discussed from social development, cognitive learning, and pedagogical research perspectives. The common understanding that the grading system in educational institutions is a necessary evaluative component of the student learning process parallels the perception of the grading system as an “appraisal system that provides orientation and confirmation of achievement of learning attempts.” (Haagen, 1964, p. 89). Criticisms of standardized test assessment, which refers to objective or multiple-choice tests, include their emphasis on factual recall and single correct answers, inherent bias in the wording and content of test items, and limitations in the assessment of higher levels of thinking skills such as application, analysis, synthesis and evaluation in Bloom’s taxonomy of learning objectives (FairTest Organization, 2006). According to Sherman (1985), effective learning is influenced by stable variables,
institutionally-controlled variables, and learnercontrolled variables. Stable variables such as a learner’s socioeconomic status and standardized test scores are widely used as predictors of academic success. Examples of institutionallycontrolled variables that may have an impact on learning are class size, temporal organization of course materials, academic standards, learning skill programs, and instructional techniques. The learner-controlled perspective in effective learning focuses on the management of the learning process. Learning is a cognitive activity that is an executive function of the learner for which self-regulating learning strategies are employed in an academic learning environment. A behavioral-oriented strategy such as checking solutions in practice problem solving provides feedback for achieving a sense of self-efficacy in learning for the learner (Zimmerman, 1989). A self-regulating strategy is emphasized in the Bee Yew is Assistant Professor, Department of Management, Fayetteville State University, Fayetteville, North Carolina.
Information Technology, Learning, and Performance Journal, Vol. 25, No. 1
1
2
development of a decision-support application that aids a student in monitoring and exploring grade performance in a class setting. The decision support application in this paper recognizes that the interactions between the learner and the learning environment in a class setting are through employment of self-regulating learning strategies to achieve a desired grade outcome. The interactive application can be regarded as an alert system that allows for grade performance analysis. The functions of updating, monitoring, what-if, and goal-setting in this application allow a student, who is also a decision maker, to consider a possible shift in strategy to move closer to attaining an outcome.
The Grade Performance Decision Making Process Given the scenario above, a grade decision support application developed in Excel provides a way for a student to monitor his or her grade performance. This application supports a student in the process of making decisions in a learning resource allocation situation. Resources are defined to be both external and internal to the student and within the control of the student. Such resources include personal time commitment to learning, application of learning skills, and the use of learning resources and influencing strategies to improve or maintain a course grade level. Influencing strategies could include collective efforts such as forming a study group or participating in an online learning community, or an individual effort in seeking more feedback from the instructor on learning task definition. It is expected that a student who is oriented towards academic achievement and faced with competing demands for his or her time will need to know the impact of each graded component on the overall or summative course grade. This is similar to the scenario in which a decision maker, faced with the responsibility to evaluate several courses of action, will need to consider situational factors. Situational factors may, and usually do, lead to a compromise on an acceptable outcome that is associated with the chosen course of action. The satisficing principle
Yew
in decision-making theory describes the behavior of a rational decision maker when resource constraints exist. These constraints are regarded as uncontrollable from the decision maker’s perspective. A student who chooses, due to other situations that compete for his or her time and cognitive resources, to opt out of an extra credit term paper or an optional test that may improve a current B grade to an A grade, is an example of a learning resource allocation decision that is satisficing in principle.
The Self-Regulated Student Learner The learner-controlled perspective on learning is found in the self-directed learning and selfregulated learning literature. Long (2006) defines self-directed learning as a purposive mental process, usually accompanied and supported by behavioral activities involved in the identification and searching out for information. The learner consciously accepts the responsibility to make decisions about goals and effort, and is, hence, one’s own learning change agent (para. 3). In essence, a self-regulated learner is someone who employs the purposeful use of strategies to achieve academic goals. Such strategies are actions and processes that include using methods such as self-evaluating, organizing and transforming, goal setting and planning, seeking information, self-consequating, and rehearsing and memorizing (Zimmerman, 1989). Self-regulation, according to O’Neil and Abedi (1996), is made up of three constructs, metacognition, effort, and anxiety. Metacognition is the “conscious and periodic self-checking of whether one’s goal is achieved, and when necessary, selecting and applying different strategies” (O’Neil & Abedi, 1996, pp. 3-4). Their paper concludes that planning, cognitive strategy, self-checking or monitoring, and selfawareness are valid measures of the metacognitive state. In addition, a positive relationship was found to exist between the level of metacognition,
An Interactive Decision Support Application for Learning Assessment
academic performance, and learning task complexity. This paper presents an illustrative use of a software application that provides support for a self-regulated learner in making conscious decisions that lead to the use of appropriate strategies to achieve an acceptable outcome. “Late bloomers” or “late starters” may benefit from the use of this application as they will be alerted to corrective action for improved grade performance before it is too late. A strategy such as making use of key learning resources may help to improve grade standing. This may be as simple as understanding the rubric system used by the instructor, using a template document prescribed by the instructor for a report or term paper, or reviewing a portfolio of samples of student work made available by the instructor. In addition, learning resources can include class notes, recorded lectures, practice solutions, and use of Internet and library resources that a student can rely on for defining a learning task. According to a study by Elton and Laurillard (1979), learners who are able to coordinate learning resources with learning task demands seem to have a greater chance of success in learning achievement, and an individual’s learning behavior can be quickly influenced by changing a learning assessment form or format. This coordination can only be realized through an understanding of the criteria used as a basis for learning assessment.
Learning Assessment Prevailing factors that have an impact in academic settings such as the nontraditional characteristics of students need to be addressed through course design and a learning-centric assessment approach. About 75 percent of undergraduate students in 1999-2000 are considered to be nontraditional students according to the National Center for Education Statistics (2002). Nontraditional students have at least one of the following seven characteristics or risk factors: financial independence, part-time attendance, delayed enrollment, full-time work, dependents, single parenthood, or lack of a high school diploma. Nontraditional students are classified as
3
minimally, moderately, or highly nontraditional depending on the number of characteristics that are identified with the individual. These risk factors are found to be negatively associated with persistence and degree attainment. The types of learning evaluation in assessment are formative and summative evaluation. Summative evaluation focuses on grading, such as in standardized testing, and does not provide useful information about teaching and learning (Boud, 1995). In contrast, formative evaluation focuses on the learning process and describes evaluating learning tasks that are more complex. The basis of such tasks is building or developing knowledge and thinking skills. Assessment methods that focus on formative evaluation are learning-centric assessment methods. The common practice of a principally lecturebased classroom environment with standardized test assessment has given way to alternative forms of assessment that focus on applications of knowledge and skills in real situations. Alternative assessment is defined in the MSN Encarta dictionary as “any form of measuring what students know and are able to do other than the traditional standardized tests” (“Alternative assessment,” 2006, para. 1). Alternative assessments, according to Herman, Aschbacher, and Winters (1992), require students to create or produce something that taps their higher level thinking or metacognitive skills. As an example, a learning task in a database management system course includes an understanding of normalization theory. The theory explains the reasons for normalizing tables in database design and hones the student’s ability to question assumptions about attribute relationships. Learning-centric assessment methods such as in-class and homework exercises, test questions that ask “why” or “how,” database design progress reports, and learning summaries can assess the achievement of learning the theory. In an academic class setting, performance standards are course requirements set by the instructor using absolute weights for various learning achievement tasks. Intuitively, the measurement of learning achievement is not an
4
exact science when one considers the variability in the instructor’s ability to match instructional goals with learning achievement tasks. A student’s prior knowledge and skills play a role in the understanding of learning tasks and expectations over time; thus some students may take a longer amount of time to achieve a learning task. Criterion-referenced assessment is emphasized in the AACSB International standard on learning assurance (2006), which focuses on learning goals and the assessment of learning outcomes through course-embedded assignments and rubric systems for evaluating course knowledge and skill content. Aviles (2001) provides a case for the assessment of grade performance that is based on the criterion-referenced method over the normreferenced method. According to Aviles, normreferenced methods that result in grade curving based on mean and standard deviation measures may lead to a lack of perceived need for improving teaching skills, course content, and student learning assessment. This may further impair efforts in curriculum planning and management. Criterion-referenced assessment is also associated with the goal of improving learning assessment of defined knowledge and skill competencies in academic settings. This approach requires an explicit articulation of criteria for evaluating student work. It has been argued that the assignment of letter grades in the qualitative assessment of a report-writing assignment, such as a B for a report that is coherent and B+ for a report that has evidence of originality, is somewhat subjective, experience-conditioned, knowledge-related, culture-bound, and emotionally influenced (Saliu, 2005). An intervention treatment study based on participation in an assessment workshop revealed that students who attended the 90-minute workshop earned significantly better grades than those who did not attend the workshop (Rust, Price, & O’Donovan, 2003). The results of this study demonstrate that a knowledge transfer process is required to communicate both explicit and tacit knowledge about assessment.
Yew
Grade Performance Assessment Option For many college and university environments, student subpopulations such as traditional and nontraditional students pose challenges to assessing students using a fixed system of weights for evaluative criteria. A more flexible course design that accommodates several assessment options provides students with choices in how they would prefer to be assessed for their learning performance in class. In a flexible course design class, there should not be any perceived inequity in the assessment options; neither should there be any perceived trade-off between learning objectives and standards with the assessment options. Assessment options suggested here can be compared to health insurance options. A typical HMO provider offers tiered options for medical benefit coverage that is set against the amount of deductible and coverage for withinnetwork or out-of-network healthcare providers. Similarly, with assessment options for learning achievement, students have to choose an option that maximizes their strengths in applying specific learning skills with consideration for the availability of personal time for certain learning tasks such as group projects. Although there are studies that have pointed to the advantages of peer learning and the importance of developing collaborative skills in postsecondary education, many real class situations reveal that students generally find group work to be a negative learning experience. Group members’ lack of preparation and contributions, external class time responsibilities, lack of group work experience, age, and cultural differences are examples of concerns expressed by students about group work (Barfield, 2003). His investigative study on the influence of social processes in student groups for two multiple section courses in Group Interaction and Decision Making and Conflict Management, revealed that age and number of hours worked per week were significantly related to group satisfaction and perceived fairness of group grade received.
An Interactive Decision Support Application for Learning Assessment
The instructor can provide grading options for various learning tasks that can improve learning satisfaction and performance. As an example, an instructor may offer students two grade performance assessment option plans in a course, Plan A with 60% of the course grade evaluated in individual work, which may consists of a combination of tests, assignments, and a summary report, and the remaining 40% of the course grade evaluated based on a group project, and Plan B, with 70% of the course grade for individual work and 30% of the course grade on a group project. The rationale for different assessment plans can be viewed from a selfdirected learning perspective in which the “learner assumes the primary responsibility of planning, implementing, and evaluating the learning process,” with the instructor assuming the role of the facilitator of the process (Brockett & Hiemstra, 1995). Also, it can be argued that the principle “one size does not fit all” can be applied to the interrelated concepts of assessment and learning, and that fairness and choice could have similar meanings in certain situations.
Assessment of Performance The concept of weights as described in the above course assessment plans is expressed in quantitative models and implemented in many evaluative techniques such as the weight scoring sheet for evaluating alternatives and the beta risk factor which estimates the volatility of stock against a broad market index in the Capital Asset Pricing model. Weights may be exact or imprecise, and they may be either statistical or subjective estimates. A simple expression of weights is the min-max normalization of numerical values to the [0,1] range. The weights for emphasizing the importance of course items in this application are preset by the instructor and are regarded as the instructor’s subjective estimates of the relative importance of items in achieving learning of the subject based on Bloom’s higher order thinking skills (Faculty Innovation Center, 2006). Thus the distribution of preset weights on items projects the instructor’s preferred instructional goals for developing certain cognitive skills. The examples provided in
5
this paper will demonstrate a learning achievement assessment option plan in an actual course setting. The performance requirements for a course are usually included in the syllabus. Such requirements can be reported based on points possible for each item as in the following class scenario:
3 tests @ 100 points = 300 possible points 5 homework assignments @ 20 points = 100 possible points 1 database report = 100 possible points 1 oral presentation = 50 possible points
Let’s assume that the cutoff grade percentage for the overall course performance is 90% for the letter grade A, 80% for the letter grade B, and so on. In the above case, the total possible points for the course are 550 points, and the weights for each item can be easily reported as well. Students should have no problem computing their current standing in grade percentage by taking scored points for assessed items and dividing by the sum of possible points for these items. As an example, say two tests have been assessed with scores of 75 and 85 and three homework assignments assessed with scores of 17, 18, and 15 respectively. The student grade standing is therefore 80.77%, which is equivalent to the letter grade B. A student concerned with what he or she has to make for the remaining items in order to make a B course grade will have no problem figuring that an overall minimum of 80% must be achieved for the remaining items. This is based on calculating or estimating the course weight for these assessed items, which is 47.27%, or about 50.00%. To calculate the course weight for these assessed items, you divide the total possible points for two tests and three homework assignments by the total possible points for all the items. But the situation is less clear when one third of the course is assessed at a grade standing of 65%. A formula to compute the overall minimum grade percentage for remaining items is provided as follows:
WPmin
OGPdesired WPattained 100% Pevaluated
6
where WPmin is the overall minimum for the remaining coursework. OGPdesired is the overall grade desired by the student, and Pevaluated refers to the percentage of completed coursework in percent. Assuming that the student in this case desires an overall course grade of “C” (70%), then WPattained which is the weighted percentage of coursework attained, is 21.67%. This is obtained by multiplying Pevaluated of 33.33% with the current grade standing of 65%. Using the formula above, the answer is an overall minimum of 73% on the remaining course items is required to maintain a “C” letter grade for the course. Without the use of the above formula, an overestimation of an expected overall minimum for the remaining components is likely. This, of course, may only have a negative impact on the student in the sense that he or she may work harder than necessary to earn a desired grade. However, the formula presented does not provide an answer to the question, “What do I have to make in percentage score on an upcoming test to improve my current grade from 85% to 90%?” The goal-seeking feature in Excel is employed in the proposed grade application to provide an answer to this question.
The Decision Support Application An example of the interactive decision support application for grade performance assessment is illustrated for an introductory course in database management systems. The course grade performance assessment application is designed for student use. A set of instructional and learning goals for this course are: 1. Demonstrate understanding of the objectives of a database management system, relational data model concepts, relational database design theory, physical database design, and database administration issues. 2. Construct a database design by applying normalization techniques and using the extended entity relationship diagramming technique.
Yew
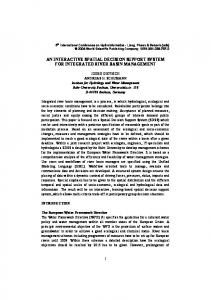
3. Implement a complete database system with an interactive form and reporting applications in Microsoft Access. 4. Document the process of design and implementation of the database system. 5. Communicate the learning experience gained from the system implementation and demonstrate the functionality of the system in oral form. The course is designed to incorporate both theory and practice, and student learning is assessed based on an alternative form of assessment. The requirements for this course consist of three tests weighted at 15%, 15%, and 20% respectively, homework assignments for which the total weight is 20%, and a database project weighted at 30% of the course grade. Tests are a combination of multiple-choice and problem-solving questions. In this application, the number of homework assignments need not be fixed. For this course, it is expected that there will be a minimum of five homework assignments, one assignment for each topic covered in the course. Homework assignments differ in complexity in terms of the amount of time required and the perceived level of concept difficulty. As such, the points assigned to each homework assignment reflect the instructor’s perception of the level of challenge for the average student. Based on student performance and feedback, the instructor has the option to increase the number of homework assignments for more practice. For example, the normalization concepts and procedures are harder for students to grasp than concepts about the relational data model. The worksheet design allows the instructor to add more homework assignments if they are deemed necessary to develop a better understanding of difficult concepts. Figure 1 illustrates a sample worksheet for analyzing course grade performance by a student at some point during the semester. Grading scales can be different for course items in the same group. For example, for the first exam, 40 multiple-choice questions were graded at 1 point each and 7 problem-solving and short-essay questions were graded at 5 points each. Thus, the total number of points for this test is 75 points. In the second exam, the test has 50 multiple-choice
An Interactive Decision Support Application for Learning Assessment
7
Figure 1. Student Version: Decision Support Grade Application Your overall performance level as of Target overall performance level Deviation from target level Computed weight %
Weight Assigned 15.00% 15.00% 20.00%
20.00%
Item E1 E2 E3 Hmk1 Hmk2 Hmk3 Hmk4 Hmk5 Hmk6
8/20/06
Score 85 79
Possible 75 100
45 72 95 50
50 75 122 50
88.78% 90.00% -1.22% 55.00%
B
Score in % 113.33% 79.00% 0.00% 90.00% 96.00% 77.87% 100.00% 0.00% 0.00% 0.00% 0.00% 0.00%
Weighted % 17.00% 11.85% 0.00% 2.73% 4.65% 4.98% 3.37% 0.00% 0.00% 0.00% 0.00% 0.00%
2.50%
Project Proposal
8
10
80.00%
2.00%
2.50%
Project Progress
9
10
90.00%
2.25%
20.00%
Project Report
0.00%
0.00%
5.00% 100.00%
Project Oral Total
0.00% NA
0.00% 48.83%
NA
questions at 1 point each and 10 problem solving questions at 5 points each, adding up to 100 possible points for this test. The points assigned to different types of questions are based on the instructor’s estimation of the relative demand on higher order thinking skills. Solving a problem by showing the steps in a solution demonstrates greater understanding of a concept than responding correctly to a multiple-choice question. In the grade performance assessment management application, each incoming graded course component will result in a newly computed overall course grade. The overall course grade is considered as the target. The goal-seeking feature in Excel can be used to compute the score for a future course item to achieve a desired overall course grade. The grade application worksheet in Figure 1 is a snapshot of the completed course requirements at a certain point during the semester. The ! symbol to the far right of the
NA
!
! ! ! ! !
! !
worksheet indicates missing grade information for course requirements that have not been entered or evaluated. “NA” stands for nonapplicable as, in this case, the totals for the three columns have no useful information. It is important to note that the weights assigned to various course items are assumed to reflect, to some extent, good assessment knowledge and the application of higher order thinking skills. A summary of the features in this application is provided as follows: 1. Overall grade performance reporting is as of the current point in time. 2. The performance target can be changed by the individual over time. 3. The possible scores for individual items can be based on any number scale. 4. The weighted percentage for an item is the achieved level of performance based on the assigned weight for the item.
8
Yew
5. The totals for score, possible, and score in percentage are NA, as these summaries do not provide any useful information because of the different weights assigned to items and the allowance for any number scale for each item. The weighted percentage for an item WPi is computed by the following formula:
WPi Wi SPi where for item i, W i is the weight in percentage, and SPi is the score percentage. The weighted percentage is used instead of score percentage for several reasons. The most important reason is the naïve and incorrect assumption that the average of score percentage for all items is equivalent to the actual average grade performance level when there are different assigned weights for some of the items. An example of this situation is provided in Figure 1 in which a 15% weight is assigned to the first two tests and a 20% weight is assigned to the third test. In another possible situation, the instructor may provide an optional comprehensive examination for a course that is structured to focus more on the application of knowledge and skills in project-related requirements. The options provided to students are option A, which is 15% for all three tests, and option B in which a 10% weight is assigned to the first two tests and a 25% weight for the comprehensive test. The overall grade in percentage for a course with at least one item that has a different assigned weight is given by the following expression:
Gradeoverall
WP W
i
i
i
When
W i
i
i
1 , or 100%, all the items have
been evaluated and assessed and the overall grade is the course grade earned by the student. An advantage of using weighted percentages for items is that the current grade performance can be easily computed using this application. Thus, at any time, a student can evaluate his or her
grade standing or performance in the course with respect to completed course items. Midterm reporting is mandated by some institutions; this application ensures that the grades reported at mid-semester accurately reflect the current grades with respect to the actual completion of course requirements. Another interesting feature of this application is the flexibility in the number scale that can be used for grading. Grading is an exercise that requires judgment, experience, and expertise in the subject matter. The process of assigning points to problems in different subtopics is based on the instructor’s assessment of the level of concept difficulty. Difficult subtopics should be supported by instructional effort spent in the formative assessment of concept learning. Instructional effort can take the form of additional class time spent in learning activities or the development of a learning guide to facilitate learning of more challenging concepts. Therefore, if the test only consists of two problems in which problem B is assessed as two times more difficult than problem A, and the test is graded out of 100 possible points, then the solution to problems A and B will be assigned 33.33 points or 33.33% of the test grade and 66.67 points or 66.67% of the test grade respectively. A different scale that imparts the same weight percentage information is 30 possible points assigned to problem B, and 15 possible points assigned to problem A. In this case the test is graded out of 45 possible points. Assessment options can be probed by changing the weights for allowed items. The shift towards focusing on learning assessment rather than an instructor’s teaching performance as evaluated in a summative score is a continuous improvement approach to developing courseteaching materials or course design. Learning is a process that requires continuous update of the knowledge base. This applies to both instructor and student in their respective roles. The ability to match instructional goals with learning assessment and instructional strategies is an experiential process. Grade curving methods that include a fixed proportion of grades and statistical derivation of final grades based on mean and standard deviation measures lack interpretative
An Interactive Decision Support Application for Learning Assessment
power when the grade distribution is not a normal distribution (Echauz & Vachtsevanos, 1995). Personal class teaching experience revealed that actual or realized student learning outcomes may not be at the expected level based on factors such as a lack of basic or required knowledge and skills in students, a mismatch of instructional goals with the methods of instruction, and inappropriate learning assessment methods. Variability in student learning and understanding of the subject, task definition, grading criteria, and instructor expectations over time means that assessment of learning performance at different times should take into account the learning curve experience factor. The emphasis on continuous improvement in teaching for the instructor implies that some measure of flexibility in learning assessment is necessary. Corrective actions that involve major or minor revisions of course curricular design apply to future classes. An approach that incorporates tacit assessment knowledge for the current class situation is the adjustment of weights on course items. The weight emphasis in this interactive grade application allows an instructor to adjust weights for items based on reflective thinking about the possible factors influencing the performance level
9
of the class. Such reflective thinking may also be triggered by an analysis of the grade performance of students in class. By changing the weights for course items, the instructor can see the impact of changes on the overall grade performance of students. Figure 2 illustrates the use of weights in exploring the final course grades for a hypothetical database management systems class. The worksheet is set up to allow the instructor to probe changes in course item weights based on averages in percentage for these items found in the last row of the worksheet. Reducing the item weight for the first exam from 15% to 10% and increasing the item weight for the project report grade from 20% to 25% in the weight table shown in Figure 3 results in students with ID numbers 2, 3, 10, 13, 15 and 19, moving up to the next level of grade achievement. The advantage of adjusting weights in this class scenario is that it draws upon making tacit information in assessment explicit with justification for such adjustment. The original and revised sets of weights represent equitable learning options that address student subpopulations such as traditional and nontraditional students. Instructional justification documentation in the context of learning
Figure 2. Instructor Version: Database Management System Course Worksheet for Evaluating Final Course Grades
10
Yew
Figure 3. Database Management System Course Weight Table Weights
Original
Revised
E1
15%
10%
E2
15%
15%
E3
20%
20%
HMK
20%
20%
Pprop
2.50%
2.50%
Pgress
2.50%
2.50%
Prep
20.00%
25.00%
Poral
5.00%
5.00%
100%
100%
outcomes, instructional goals, and assessment methods provides important information for continuous improvement in curriculum design and teaching. The grade worksheet application in Figure 2 is set up to allow for analysis at any time during the semester when the course requirements are partially completed. Values for item weights in percentage are entered into the weight table when course items for students have been graded and entered into their respective grade columns in Figure 2. Goal seeking is a feature in Excel that employs either a linear or non-linear optimization technique to generate an approximate solution for a variable to achieve a specified target level for a goal variable. Goal-seeking can be regarded as an accelerated what-if spreadsheet analysis. In whatif analysis, scenarios are generated by changing values in input cells to probe changes in an output cell. This output cell is an expression of the input cells and is typically a performance measure. When the level of a performance measure is known or expected, goal-seeking analysis is appropriate. Consider the following goal-seeking scenario for the interactive grade performance assessment application: Referring to Figure 1, a student would like to know what score is needed for the project report to make an A grade for the course. The student must first enter an arbitrary value for possible points for the
project report before initiating the goalseeking algorithm. After clicking on “Goal Seek” in the Excel Tools menu, the student will be prompted for the information for the “Set cell,” “To value,” and “By changing cell” parameters. The “Set cell” is the cell that contains the formula for the overall performance level. The “By changing cell” refers to the cell reference in the Score column that corresponds to points obtained by student for the course item in question. The spreadsheet program computes a result of 93.35% for the project report’s Score in percentage. This feature can be used to probe any specific course item to analyze assessment options available, for example whether to take an additional comprehensive test option, and application of appropriate learning strategies to improve grade standing.
Perceived Usefulness of the Application To assess the utility of this interactive application, an e-mail survey was administered to students who were enrolled in the decision support systems course and to students who had completed the course in the previous two semesters. The decision support systems course is a senior-level course for the management information systems degree program. The choice of this course is based on an in-class illustration of the grade application worksheet as a decision support application at the beginning of the semester. The concepts underlying the application were explained and students were required to set up the application. This exercise reinforced student understanding of decision making and the what-if and goal-seeking methods of spreadsheet analysis. The e-mail survey was sent to all 14 students who were currently enrolled in the course and to students whose e-mail accounts still existed in the university e-mail directory after completion of the course in the two previous semesters. The results of the survey are tabulated in Figure 4.
An Interactive Decision Support Application for Learning Assessment
11
Figure 4. Student Survey Results on Perceived Usefulness of Application for Decision Support System Course
Item Q1. Overall, the DSS grade application is a useful tool. Q2. I understand the application well. Q3. I have used the application to evaluate my grade standing at various times during the semester. Q4. The application has helped me to focus my effort in improving grade standing. Q5. I would recommend that this application be used by students in other classes. Q6. The application has helped me to understand the importance of weights and criteria evaluated in this course performance assessment. Q7. The Excel application is a good illustration of decision support concept.
The survey also included a section for further comments by students. A listing of student comments follows: “Excellent tool, I agree that this tool should
be given to you in every class.” “This is a wonderful tool that can be used to
estimate where a student stands (grade wise) in the class that allows the student to make a decision on study habits.” “I think that the DSS grade application is a useful tool but at the discretion of the user.” “I have tested different scenarios using hypothetical test scores to help me to understand what I can achieve under these situations.” “I believe this is a good way for students to see where they are and also see where they need improvement by asking the professor what they can do to improve in that area.” “This is a very informative tool for the class.” “I think that the Excel grade application is an excellent tool that can be used throughout the college or graduate school.” “I strongly recommend students to use this application—not only to monitor their grade, but to learn from it as well. The application may be used for future reference.”
Number of responses (total = 21; 11 currently enrolled, 10 graduated or have completed course) Strongly Agree Neutral Disagree Strongly Agree Disagree 11 7 3 0 0 8 11 2 0 0 10
6
2
3
0
9
5
5
2
0
11
7
3
0
0
9
8
4
0
0
15
5
1
0
0
Conclusion In an academic classroom setting, the decision makers are both the instructor and the students. This application is designed to meet the instructor’s need in assessing the learning performance of students based on defined learning goals or criteria. In the example of the homework assignment for the database management systems course, the interactive spreadsheet allows the instructor to be flexible about the number of homework assignments. In an assessment system that is based on points, the addition of one homework assignment would not be possible, as this requires the instructor to change the points allocated to other course items such as exams or projects. The key to this grade performance application is the focus on the assignment of weights to course items. Another advantage of the application is that the instructor is not confined to a fixed-point scale for grading. The same exam can be graded out of 100 points or 60 points. This increases the flexibility for the instructor to add a new test question to an exam that focuses on an important concept that had not been sufficiently covered or well understood in a prerequisite course. An exam that was graded out of 60 for 6 questions at 10 points for each question will now be graded out of 70 points to include the additional
12
question. The application implemented with exam weights and computation of weighted percentages will automatically compute the overall grade performance. In addition, this application allows for consideration for equitable assessment options to address the learning needs of subpopulations, for example traditional and nontraditional students in the same class. For the student, the emphasis in using the application shifts from content-based assessment issues to the tracking of grade performance in class and making conscious decisions on adjusting learning strategies to improve grade standing. Additionally, for a student receiving financial aid, the decision to maintain a required minimum overall grade point average is a concern. By being able to know interim grades, a student can act appropriately. This application offers continuous monitoring of grade performance that allows for the modification of learning behaviors that may lead to learning improvement and performance. It is also assumed that students who are selfregulated learners will find this application to be beneficial. When the application is set up as a grade workbook with rows for students and columns for various course items, computations of weighted percentages, and overall performance as in Figure 2, the instructor can explore possible changes in weights for course items based on the perceived level of success in employing teaching strategies that improve student learning or the achievement of instructional goals. Weight adjustments for course items imply varying degrees of challenge in teaching topic-specific or skill-specific requirements that can be addressed through future teaching strategies or curriculum revisions. The emphasis on student learning outcomes in the current assessment trend in higher education requires instructors to be more reflective in their assessment strategies. Student class performance must, therefore, be evaluated carefully with reflection on the achievement of instructional goals and the learning process. The practice of course grade curving without further analysis of class performance does not lead to any degree of understanding about what changes in assessment and student learning are needed for future improvement. Equitable assessment options
Yew
need to be provided for students exhibiting nontraditional characteristics who have employment and family commitments or other challenges in implementing self-directed learning plans at the undergraduate or graduate levels. The proposed interactive grade performance analysis application can be regarded as a supporting tool for students and instructors in the assessment of learning and instruction.
References Alternative assessment. (n.d.) In MSN Encarta online dictionary. Retrieved 2006, from http://encarta. msn.com/dictionary_/alternative%2520assessment .html AACSB International. (n.d.) Assessment Resource Center: Overview of Assessment. Retrieved 2006, from http://www.aacsb.edu/resource_centers/ assessment/overview-expectations.asp Aviles, C. (2001). Grading with norm-referenced or criterion-referenced measurements: To curve or not to curve, that is the question. Social Work Education, 20(5), 603-608. Barfield, R. L. (2003). Students’ perceptions of and satisfaction with group grades and the group experience in the college classroom. Assessment and Evaluation in Higher Education, 28(4), 355370. Boud, D. (1995). Assessment and learning: Contradictory or complementary? In P. Knight (Ed.), Assessment for learning in higher education (pp. 35-48). London: Kogan. Brockett, R. G., & Hiemstra, R. (1995). Self-direction in adult learning: Perspectives on theory, research and practice. New York: Routledge. Echauz, J. R., & Vachtsevanos, G. J. (1995). Fuzzy grading system. IEEE Transactions On Education, 38(2), 158-165. Elton, L. R. B., & Laurillard, D. M. (1979). Trends in research on student learning. Studies in Higher Education, 4(1), 87-102. Faculty Innovation Center. (2006). Higher order thinking skills. Retrieved August 1, 2006, from http://fic.engr.utexas.edu/files/HigherOrderThinki ngSkills(FIC).pdf#search=%22Bloom%20higher %20thinking%20skill%22 FairTest Organization. (2006). What’s wrong with standardized test? Retrieved June 29, 2006, from http://www.fairtest.org/facts/whatwron.htm Haagen, C. H. (1964). The origins of a grade. Journal of Higher Education, 35(2), 89-91.
An Interactive Decision Support Application for Learning Assessment Herman, J. L., Aschbacher, P. R., & Winters, L. (1992). A practical guide to alternative assessment. Alexandria, VA: Association for Supervision and Curriculum Development. Long, H. B. (2006). Skills for self-directed learning. Retrieved August 3, 2006, from http://facultystaff.ou.edu/L/Huey.B.Long-1/Articles/sd/ selfdirected.html National Center for Education Statistics. (2002). Special analysis 2002: Nontraditional undergraduates. Retrieved August 11, 2006, from http://nces.ed.gov/programs/coe/2002/analyses/no ntraditional/sa01.asp O’Neil, H. F. Jr., & Abedi, J. (1996). Reliability and validity of a state metacognitive inventory: Potential for alternative assessment (CSE Technical Rep. No. 469). Los Angeles, CA: National Center
13
for Research on Evaluation, Standards, and Student Testing. Rust, C., Price, M., & O’Donovan, B. (2003). Improving students’ learning by developing their understanding of assessment criteria and processes. Assessment and Evaluation in Higher Education, 28(2), 147-164. Saliu, S. (2005). Constrained subjective assessment of student learning. Journal of Science Education and Technology, 14(3), 271-284. Sherman, T. M. (1985). Learning improvement programs: A review of controllable influences. Journal of Higher Education, 56(1), 85-100. Zimmerman, B. J. (1989). A social cognitive view of self-regulated academic learning. Journal of Education Psychology, 81(3), 329-339.
Material published as part of this journal, either on-line or in print, is copyrighted by the Organizational Systems Research Association. Permission to make digital or paper copy of part or all of these works for personal or classroom use is granted without fee provided that the copies are not made or distributed for profit or commercial advantage AND that copies 1) bear this notice in full and 2) give the full citation. It is permissible to abstract these works so long as credit is given. To copy in all other cases or to republish or to post on a server or to redistribute to lists requires specific permission and payment of a fee. Contact Donna Everett,
[email protected] to request redistribution permission.