Climatic Change, Volume 90, Numbers 1-2, pp 89-111, September 2008.
An interactive multi-scale integrated assessment of future regional water availability for agricultural irrigation in East Anglia and North West England
C Henriques1, IP Holman1, E Audsley2,1 and K Pearn2,1 1
Department of Natural Resources, Cranfield University, UK
2
Silsoe Research Institute, UK [Now at 1].
Corresponding author: I.P. Holman Cranfield University Cranfield Bedford MK43 0AL United Kingdom
Tel:
+44 (0) 1234 750111
Fax:
+44 (0) 1234 752970
Email:
[email protected]
Abstract
A multi-scale approach has linked farm level decisions with regional water availability assessments that allow for environmental water needs and the competing demands for water. This is incorporated within a user-interactive software tool, enabling the impact of a range of variables to be easily examined. Climate change leads to increased potential irrigation demand in East Anglia and North West England. Under baseline socio-economic conditions, results suggest that such increased future water demands can be met in the North West, but in the drier East Anglian region are counter to the decreasing water availability under all climate scenarios. The decreasing availability is moderated or exacerbated according to the environmental priorities of the future socio-economic scenarios. Under economically-focussed regional futures, water supply availability increases at the expense of the environment, despite high water demands.
Under environmentally-focussed futures, demand
restrictions are needed due to the further decreased water availability as a consequence of the high
1
environmental priority. Results show that the effectiveness of water pricing for reducing irrigation demand is also scenario-dependent. Where regional food production is important, irrigation demand is relatively price-insensitive and abstraction controls will be most effective, whereas in a global market-drive future, irrigation demand is shown to be price-sensitive.
1. Introduction
Agriculture is the largest global user of water representing around 70% of global water use (UN/WWAP, 2003). It is also likely to be the water user which is most affected by climate change because irrigation water demands are particularly sensitive to changes in precipitation, temperature, and carbon dioxide levels (Frederick and Major, 1997).
Although irrigated agriculture is most
important in dry regions of the world, supplementary irrigation has become increasingly important (Stansfield, 1997) in temperate regions to increase yields of certain crops (e.g. sugar beet, maize, etc) or to maintain/improve crop quality (e.g. potatoes and vegetables).
There have therefore been
numerous studies investigating the likely effect of climate change (temperature, rainfall and CO2) on irrigated crops. Many of these studies have identified the yield benefits of irrigation (e.g. Davies et al., 1997) or the increased irrigation demand for the current production areas (e.g. Doll, 2002; Weatherhead and Knox, 2000). However, such studies fail to integrate potential irrigation demand changes with water resource availability, competing water demands or changed agro-economic conditions. Approaches that have been taken to do this have included the use of farm level volumetric irrigation caps (Jones 2001) or linkage with water resource and planning models (e.g. Victoria et al., 2005; Thomson et al., 2005; Rosenzweig et al., 2004; Strzepek et al., 1999; Izaurralde et al.,2003). These latter studies have generally included scenarios of competing demands (public water supply, industry) arising from changes in population and GDP (usually consistent with the equivalent SRES socio economic scenario), within which priority–based optimization algorithms (e.g Rosenzweig et al., 2004) allocate water between these uses. However, despite the more realistic representation of limited irrigation supply in these studies, they still assume that irrigation is occurring within the current socio-political environment surrounding water resource management, abstraction licensing and agricultural policy.
Irrigation is a small but important part of UK agriculture, accounting for about 150 000 ha of land and 160 000 Ml of water in a 'dry' year, both of which are expected to increase due to climate change (Woods 2000). Despite its small volumetric demand, irrigation is of significant economic importance to farmers, growers, and the food industry, improving crop yields, quality, consistency and reliability. The likely increasing demand for irrigation caused by climate change (Arnell et al., 2001, Downing et
2
al., 2003) is in competition for water with other users (such as the domestic sector and the environment) which are variably affected by climate and socio-economic change.
To better understand the interactions between irrigation and competing water demands in changing climate and socio-economic futures, this paper describes the regional results of linking a farm level cropping decision model with a hydrological model, describing water resource availability, abstraction management and water demand, in East Anglia and North West England. The models have been developed for, and integrated within, an interactive software tool (the ‘Regional Impact Simulator’ – Holman et al., 2008) to allow stakeholders to perform their own integrated assessments of climate and/or socio-economic change.
2. Agriculture and irrigation in East Anglia and North West England
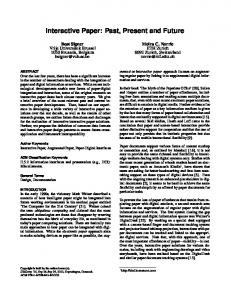
The North West of England is the larger of the two regions (Figure 1) and is dominated by higher land in the north and along its eastern boundary. The proximity of the North Atlantic produces a generally milder and wet climate (average annual rainfall = 650 - 3200 mm), allowing for the effects of altitude. The diversity of the physical environment produces a range of farming systems, from rough grazing for sheep in the uplands, permanent grassland for sheep and cattle in the lower hills to mixed arable and dairy farming in the lowlands. Urban development is focussed in the south of the region around Liverpool and Manchester.
The climate of East Anglia is influenced by its low relief and proximity to the continent, resulting in lower average annual rainfall of 550 - 750 mm per year and a greater daily and monthly temperature range. As a consequence of its relatively dry climate and low-lying topography it is an intensively cultivated area, with an emphasis on arable agriculture. The area has a relatively low level of urbanisation, with the exception of key urban centres such as Cambridge and Norwich.
Irrigation is regionally focussed in England, with East Anglia and North West England representing the two contrasting ends of the current irrigation demand continuum. In 2003, 8% of the estimated actual national irrigation abstraction occurred in the North West while the highest volume (around 50%) was abstracted in Anglian region, a larger area which includes East Anglia. Although total irrigation use in England and Wales represents less than 1.5% of total abstraction, during peak periods irrigation can account for more than 70% of total abstraction in the intensively irrigated areas of Anglian region (Morris et al., 2004).
3
There has been a steady trend of increasing irrigation demand, with an underlying increase in water use for irrigation in the Anglian region of about 3% per year. Overall this has led to a national doubling of the amount of water used between 1975-2000. In response to seasonal shortages in water and increasing restrictions on summer abstraction licences, the amount of water stored in on-farm reservoirs doubled from 33 million to 64 million m3 in the period 1984 to 1995 (Weatherhead et al., 1997).
3. Methodology
Agricultural and water resource management decisions are taken at very different scales. A multiscalar approach (Victoria et al., 2005) has therefore been adopted to integrate the agricultural, hydrological and human systems, within a context provided by the climate and regional socioeconomic scenarios: 1. Field – crop yields are simulated based on soil and climate conditions; 2. Farm – farm level cropping systems are developed, based upon the different gross margins resulting from the field-scale crop yields, irrigation cost and regional economic conditions (from the socio-economic scenarios), taking into account rotational and labour restrictions etc; 3. Sub-catchment and catchment – the water available for abstraction is calculated for each subcatchment and catchment, based upon simulated Flow Duration Curves and a measure of how willing society is to impose abstraction-related environmental stress on the rivers; 4. Region – a regional water supply – demand balance is conducted to assess the ability to meet water demand and to ascertain whether demand restrictions / increased supply are needed.
In order to achieve the necessary fast model run times (Holman et al, 2008), the models were based upon existing, robust, state of the art methodologies that allow the estimation of suitable impact indicators for the whole region. The modelling approaches are described further in Sections 3.2 and 3.3
3.1 Scenarios
3.1.1 Climate change scenarios The United Kingdom Climate Impacts Programme 2002 scenarios, known as the UKCIP02 scenarios (Hulme et al., 2002), have been used. These are based on the high-resolution regional climate model
4
(HadRM3) from the Hadley Centre for Climate Prediction and Research. Four climate scenarios were selected (the 2020s Low emissions, 2020s High emissions, 2050s Low emissions and 2050s High emissions) to capture the effects of uncertainties in future greenhouse gas emissions on UK climate and to allow investigation of the evolution of change.
In all seasons, and for all scenarios, there is a northwest to southeast gradient in the magnitude of the climate warming over the UK, with the southeast consistently warming by several tenths of a degree Celsius more than the northwest. Changes in total annual precipitation, relative to 1961-90, range from –4 to +3% by the 2020s and –9 to +7% by the 2050s. Winter precipitation increases in all regions with the largest changes of up to 23% occurring in the east.
Conversely, in summer,
precipitation decreases across virtually all of the UK with the largest changes of up to –32% occurring in the south.
3.1.2 Socio-economic scenarios
Shackley and Deanwood (2003) developed regional socio-economic scenarios (SES) specifically for the case study regions, which were enhanced (Holman et al., 2008). The SES are summarised below in the context of agriculture in the two regions.
Regional Stewardship (RS) - The emphasis in this storyline is on recognising and conserving regional assets, accepting that this might result in a significantly reduced level of economic growth. Intensive agriculture will become more expensive through national and regional level policies, including new taxes or tradeable permits on fertilisers and pesticides. Construction of farm winter reservoirs will be encouraged due to higher water charges for irrigation, but rules will limit their development when they significantly reduce winter flows. Incentives for less intensive agriculture will be provided through regional subsidy packages. The organic foods sector and local farmers markets will grow in response to local demand.
Global Markets (GM) - Global Markets is based on the pursuit of high and sustained growth within a global context. There will be a very strong split between agriculture that can compete on global scales in the absence of subsidies and that which is not competitive, which will go out of business. There will be some niche markets e.g. for organic foods, but they will remain marginal to the bulk of economic activity. Dairy and beef farming in the North West and horticulture remain globally competitive and remain as intensive as today in larger farm units.
5
Global Sustainability (GS) - Here the global approaches to achieving sustainable development take precedence over regional responses. Through the Common Agricultural Policy (CAP), agriculture is directed towards that which is most suitable to be grown locally in the context of a continental scale landmass. The intensive agriculture of East Anglia is transformed towards sustainable production by taxes on fertilisers, pesticides and herbicides, and subsidies for organic and low-intensity farming. There is stronger emphasis on movement towards low intensity farming in the uplands of the North West.
Regional Enterprise (RE) - The Regional Enterprise scenario is the most bullish of the four scenarios, suggesting vibrant, semi-autonomous regions, keen to promote and maintain their distinctive qualities in a highly competitive world. Agriculture will be much more exposed to the market and could decline as a result, although there would be support where this promotes regional cohesion. Many forms of arable agriculture in East Anglia will be competing successfully on the global market. In the North West, some agricultural activities, including dairy and horticulture, will flourish, whilst others such as subsidy-dependent hill farming will die away.
3.2 Modelling of agricultural land use decision making
The agricultural metamodels are derived from the full agricultural land use estimation model described in Rounsevell et al. (2003) and Holman et al. (2005), which combines a crop model which predicts the yield of a wide range of crops as a function of climate and soil type, with a farm model which determines the optimum cropping given crop gross margins, labour and machinery costs and soil workability of a generic farm. The agriculture metamodels are described in Audsley et al (2008) and summarised below.
Crop yields for all 2500 ha grid squares within each region are predicted from crop-specific neural networks, which were fitted to crop yield data from the ACCESS model (Holman et al., 2005), soil data (rooting depth and soil water availability), weather parameters, latitude, carbon dioxide level and irrigation level data. The performance of the neural networks are evaluated in Audsley et al. (2008)
The farm metamodel uses a regression approach to predict the percentage of the farm in each of the given crops and the resulting profit. Based upon the level of profit, land is classified as either cropped, extensive or abandoned, from which levels of production, water use and nitrate leaching are calculated. The regression equations use the relative crop gross margin of each crop, the soil type and workable hours in the winter, the maturity date of each crop, spring and autumn evapotranspiration and rainfall, and the change in labour and machinery costs.
6
The model iterates, altering the prices of crops and water, to obtain the correct level of production of each commodity, limited by the scenario-defined permitted level of irrigation in each region. A maximum of 10 iterations are allowed as this has been found to be sufficient in most cases. In the agriculture metamodel, only potatoes (representing irrigated vegetables) and sugar beet can be irrigated, for which the optimum level of irrigation (0, 100mm or 200mm per season) is chosen, given the cost (variable, capital and labour) of irrigation. Although processing factories do not currently exist, sugar beet is permitted in the North West in order to determine future potential. Any solution of the agricultural metamodel (areas of all the available crops) defines an amount of irrigation used in the region, due to the relative gross margins of the irrigated and non-irrigated crops. It is assumed that the baseline model solution corresponds to the current availability of irrigation water. For future scenarios the crops produced and irrigation used are compared to the required levels of production and irrigation water availability. If any value is outside a tolerance, the prices of the crops and water are iteratively adjusted.
3.3 Modelling of water resources, water supply, and water demand The hydrological and water resources metamodels are fully described in Henriques (2007) and summarised as follows.
3.3.1 Modelling of catchment hydrology The catchment hydrological model is based upon a regionalised catchment scale empirical method, the Low Flows Estimation method of Gustard et al. (1992), which has been previously validated and calibrated over a wide range of conditions in the UK. That method has been modified to estimate the water resources indicators for each catchment i.e. the Mean Flow (MF) and the naturalised Flow Duration Curve (FDC). The MF (m3/s) is calculated from: MF = (AAR – LOSSES) × AREA × 3.17×10⁻⁵
(1)
Where: AAR is the Average Annual Rainfall, mm LOSSES are the losses due to the average annual evapotranspiration, mm AREA is the catchment area, km2
The LOSSES parameter of Gustard et al. (1992) was adapted to be sensitive to changes in landuse/cropping (from the Agriculture metamodel) and urbanisation (from the Urban and Suburban land classes of the Land Cover Map 2000 for the baseline, and from the spatial urbanisation patterns within the future SESs). LOSSES from agricultural crops in a catchment for a given climate scenario
7
were estimated from Equation 2, where the coefficient k reflects both the soil water stress and crop coefficients, which were derived from multiple runs using the WaSim model (Hess et al., 2000) for the range of soil-crop-climate combinations.
LOSSES ETp i crops k i cropi 1 n
(2)
Where: ETp is the catchment average annual Potential Evapotranspiration, mm ncrops is the number of modelled crop types (including grass) Ki is the average annual coefficient relating the actual evapotranspiration of crop i to the potential reference evapotranspiration Cropi is the proportion of a catchment with the crop type i LOSSES from urban areas were estimated from Equation 3. Urban areas are assumed to consist of 100% hard surfaces and Suburban of 50% hard surfaces and 50% grass. It is assumed that 0.4 mm of rainfall is retained on hard surfaces after rainfall to be lost through evaporation, based upon Van de Ven et al. (1992).
LOSSES
Suburban Suburban ETp k grass Urban 0.4 Wetdays 2 2
(3)
Where: Suburban is the proportion of a catchment with Suburban land class Urban is the proportion of a catchment with Urban land class kgrass is the coefficient relating the actual evapotranspiration of grass to the potential reference evapotranspiration estimated as described above for the crops. Wetdays is the annual number of wet days with rainfall greater than 0.4 mm, days
The LOSSES for the remaining non-agricultural portions of the catchments, or for those catchments flowing into the region, was estimated from Equation 4, based on that in Gustard et al. (1992).
LOSSES = r × ETp
(4)
Where: r is the reduction factor due to catchment dryness as a function of AAR
For each catchment, the naturalised daily flow exceeded 95% of the time; i.e. the low flow Q95, was first derived (according to Gustard et al. 1992) from the estimated MF (using equations 1-4), and then the naturalised FDC is derived from the estimated MF and Q95 using the area-weighted average of
8
the 10 low flow Hydrology Of Soil Types (HOST) groups (Boorman et al., 1995) plus lakes and urban fractions (from the sum of Urban and Suburban land classes). The estimated naturalised FDC using the derived improved methodology was successfully validated by comparison of the simulated low and high flows, Q95 and Q10 (i.e., the daily flow exceeded 10% of the time) respectively, with gauged data (Table 1) from 79 catchments throughout the 2 contrasting regions, demonstrating the robustness of the metamodel.
3.3.2 Modelling of catchment abstraction availability Only a proportion of the total manageable resource assumed to be represented by the long term naturalised FDC for each catchment is available for abstraction.
The integrity of freshwater
ecosystems depends upon adequate quantity, quality, timing, and temporal variability of water flow. It is important therefore that national water management policies explicitly incorporate freshwater ecosystem needs, particularly those related to naturally variable flow regimes (Baron et al., 2002). England and Wales has the most heavily protective system of abstraction control in the UK, as the Environment Agency (and its predecessor the National Rivers Authority) has statutory powers to license all abstractions. To be reasonably consistent with current abstraction management policy in England, an approach similar to that of the Environment Agency's Resource Assessment Management (RAM) framework (Environment Agency 2002; Dunbar et al., 2004) has been chosen out of the many methodologies available for calculating environmental flow allocations (e.g. reviews by Acreman and Dunbar, 2004; Tharme, 2003). Moreover, it has been assumed that abstraction licensing restrictions are likely to be in operation under all socio-economic futures due to the longstanding water resources management structure in England and Wales.
Within the RAM methodology, five environmental weighting bands that classify the flow regime (and from which, when coupled with the FDC, the total annual abstraction availability is estimated) are based on site-specific assessment of species’ sensitivity to abstraction pressures. In the absence of such data regionally, the environmental weighting bands have been substituted by a subjective 5-point Regional Environmental Priority (REP) scale, which represents the willingness of society to allocate water to aquatic ecosystems to prevent abstraction-related hydrological stress by protecting low flows and flow variability of the catchments. The values chosen range from 2 (high) for environmentallyfocussed futures (GS and RS) to 4 or 5 (low) for market-driven futures (RE and GM, respectively), with the Baseline being given as 3 (medium).
3.3.3 Modelling of regional water supply– demand balance
9
Because of regional supply networks, abstraction of water does not necessarily occur close to the point of use, or indeed in the same catchment. Water is currently transferred over large distances, and the future extent of such transfers or the network that supports them cannot be predicted for the various socio-economic storyline. As a result, water supply and demand are estimated at the regional scale and the robustness of the regional supply-demand system to the pressures exerted in the scenario is measured by the relative balance of the supply and the demand.
The abstraction availability in each catchment is summed to derive the regional abstraction availability to which the reservoir storage capacity and net regional water imports are added. Where regional boundaries do not match catchment boundaries, the catchment water availability is reduced by the proportion outside the regional boundary.
Regional water demand is given by the sum of the agricultural irrigation (from the agricultural metamodel), domestic, and industrial/commercial demand, augmented by leakage calculated as a proportion of water provided by the Public Water Supply (as opposed to direct abstraction by users). Although domestic water demand, especially personal washing and garden watering is sensitive to both climate and socio-economic change (Environment Agency, 2001, Herrington, 1996), it has been assumed that the dominant driver is socio-economic in terms of consumption trends and population. It has also been assumed that industrial use is insensitive to climate change as it is conditioned by technologies and modes of use (Arnell et al., 2001), although Downing et al. (2003) defends that climate change impacts on industry and commerce are likely to be higher than the impacts on domestic consumption. However, those impacts of climate change are minor compared to the impacts of socio-economic factors (Downing et al., 2003). Leakage, as a percentage of the public water supply, increases from baseline under the RE scenario due to low levels of investment in leakage control, while it decreases the most under the GM scenario due to the market forces of competition (Environment Agency, 2001).
4. Results The intention of the Regional Impact Simulator was to develop a user friendly and interactive software tool, which stakeholders could use to assess the implications of climate and socio-economic change for themselves.
The Regional Impact Simulator is freely available to the stakeholder
community through the UK Climate Impacts Programme website (www.ukcip.org.uk), so that the user can interactively examine different scenarios, and the effects of individual model input parameters. The value of the Simulator (and the metamodels described within this paper) is not therefore limited to the restricted number of model runs described herein.
10
4.1 Reconciling changes in abstraction availability and irrigation demand under future climate scenarios
Climate change impacts the naturalised flows on which the abstraction availability is based, with the reduced annual rainfall and increased evapotranspirative losses in the 2020s and 2050s being reflected in reduced river flows. As a result, under baseline socio-economic conditions less water is available for abstraction for all users (Figure 2) under all climate scenarios, although the significant effects do not manifest themselves until the 2050’s, as the reductions by the 2020s shown in Fig. 2 are only around 10% of current levels. By the 2050s under a High climate change scenario, abstraction availability in East Anglia is reduced by over 250 Ml/d, a reduction of around 30% compared to current availability. Similar absolute reductions in abstraction availability are seen in the North West region, although abstraction availability is much higher in the North West compared to East Anglia.
In parallel with the reduction in abstraction availability, there are variable changes in irrigation demand in both regions (Figure 2) due to autonomous adaptation. In East Anglia, irrigation demand appears to remain relatively stable, apart from under a 2050s High climate scenario when it increases by about 40% (compared to the baseline). In the North West, irrigation demand increases by between 200 and 250% under the 2050s High and 2050s Low, respectively, but the large percentage rise reflects the very low baseline irrigation demand. The changes in irrigation demand result from: 1. the increase in water demand by the irrigated crops due to the warmer and drier growing season in all the climate scenarios; 2. the relative changes in gross margins due to the differing yield response of all arable crops, leading to differing crop selection choices by farmers arising from autonomous adaptation, and; 3. shifts in the relative irrigation of sugar beet and potatoes.
In East Anglia, despite the relatively static or increasing irrigation demand, Figure 3 shows that the total regional production of potatoes and sugar beet (i.e. irrigated and unirrigated) increases under the 2020s climate scenarios (relative to the Baseline). In the 2050s, the production of sugar beet declines and potatoes increases under a Low emissions scenarios whilst both potato and sugar beet production decrease under a High emissions scenario.
The changes in the 2020s appear to result from a
combination of a CO2 fertilization effect and a shift in irrigation from sugar beet to the higher value potatoes (and horticultural crops). In the North West, a similar pattern is seen, although sugar beet production declines under the 2020s High scenario. The decline in sugar beet and potato production under the 2050s High climate shown in Figure 3 appears to occur within the unirrigated cropping, with a small increase in the irrigated areas and in irrigation demand (Figure 4).
11
The net result of the decrease in abstraction availability coupled with the increase in irrigation demand differs between the two regions. Even under a 2050s climate, with its resultant decrease in abstraction availability, there is still a positive supply-demand balance in the North West (Figure 5) due to the very high water availability, indicating that the increased irrigation demand should be satisfied. However, in East Anglia, the supply-demand balance under baseline socio-economic conditions shows a progressively increasing supply deficit (Figure 5) indicating that current water resource management practices would become unsustainable. Significant demand management and supply augmentation would be required to maintain a balance, but if the environmental flow allocation for the river ecology is not to be changed, this could not be satisfied without further irrigation demand constraints (Table 2).
4.2 Influence of climate and socio-economic changes on abstraction availability and the supplydemand balance
With changing futures, the profitability of irrigation changes, due to changes in water costs, demand for produce, gross margins etc.
Table 3 shows that future irrigation demand in East Anglia
significantly differs across the SES for the same climate scenario, but increases almost under all futures compared to the baseline.
The largest changes to the regional supply-demand balance are dependent on the socio-economic futures (Table 4). Under the GS and RS scenarios, the high REP requires water to be allocated to protect the river ecology at the expense of abstraction availability (Table 5). The net result is that despite reduced water demand in these futures (mainly from industrial/commercial users, Table 5), there is a significant water resources deficit. Under the lower REP scenarios of GM and RE, the interaction of supply with demand differs. Under the GM scenarios, approximately sufficient water can be abstracted to satisfy the demand, but under the RE scenarios the reduced abstraction availability (due to a higher REP than the GM future, but which is still lower than the baseline), and high demand (partly due to very high leakage) produces a negative supply-demand balance (Table 5).
As a result of the combination of the climate and different socio-economic pressures, for East Anglia under the 2050s High climate, water shortages are likely without significant adaptation. Under GM, GS and RS the water deficit is smaller than under baseline socio-economic conditions (Table 5) and thus the socio-economic pressures moderate the impacts of climate change. The deficit under all the scenarios is likely to lead to further restrictions on water demand, particularly in drier than average years, unless adaptation responses are implemented or a relaxation of the environmental allocation becomes inevitable.
12
5. Discussion
5.1 Assessing changes in abstraction availability
Freshwater is vital to human life and societal well-being, and so its utilization for consumption, irrigation, and transport has long taken precedence over services and functions provided by freshwater ecosystems. With a limited resource, water has to be shared or allocated between competing uses, principally public water supply, the environment, irrigation and industrial water supply. The relative weights which society puts upon these different uses will affect the mode of resource allocation. Historically human water uses have taken priority over the environment in many parts of the world, with public water supply for drinking taking overall precedence.
However, there is growing
recognition that fluvial ecosystems are legitimate users of water (Naiman et al., 2002) and that functionally intact and biologically complex aquatic ecosystems provide many economically valuable services and long-term benefits to society (Baron et al., 2002). Increasingly, therefore policy is placing greater or greatest priority on the environment - for example, the Water Framework Directive in Europe aims to ensure that all water bodies achieve ‘good ecological status’ which requires the hydromorphological conditions (including flows) to be close to pristine. To achieve these aims, it is necessary to ensure that the environmental needs are identified (Tharme, 2003; Acreman and Dunbar, 2004) and met.
Evaluation of the regional abstraction availability is the most difficult component of a regional study as no simple figure can be given for the environmental flow requirements of rivers (Acreman and Dunbar, 2004). In the past, such assessments were based on simple ‘hydrological methods (Tharme, 2003) such as fixed-percentage or look-up table methodologies in which a minimum flow based upon a set proportion of the dry weather flow represented by the Q95 was maintained. Acreman and Dunbar (2004) suggest that where many catchments need to be assessed, rapid methods such as lookup tables are appropriate. However, the modified-RAM approach adopted in this study, using a REP, produces an ecologically acceptable FDC which retains many characteristics of the flow regime such as the low flows and flow variability, which are not given by the simple methods.
The approach taken to derive abstraction availability in this study bases the availability of water on the naturalised FDC i.e. the flows that would occur in the absence of abstractions and discharges. Abstraction is therefore allowed based upon the potential impacts of abstraction on river flow (and hence on the aquatic ecosystem) without considering the potentially moderating influences of
13
abstraction returns. As such is does not allow for re-use of water, either directly through nonconsumptive grey water use (Diaper et al., 2001) or indirectly through recharge of aquifers by leaking water supply pipes (Yang et al., 1999; Hooker et al., 1999) or river flow augmentation from sewage treatment works.
In East Anglia and the North West where significant volumes of water are
abstracted from groundwater or are provided by reservoirs or water transfers, water returns will significantly increase the availability of water for abstraction in receiving catchments during summer low flow periods.
5.2 Influence of socio-economic futures on regional water supply
Within global change studies it is important to recognise the water needs of the aquatic environment, but also to recognise that the relative priorities given to human and environmental needs is neither static nor constant between socio-economic futures. The results for the abstraction availability under the different climate and socio-economic scenarios have shown that significant effects of climate change are not manifested until the 2050s but that the socio-economic futures cause large changes in water supply.
The regional water supply is affected through direct and indirect interactions of differing importance with the hydrological and policy environments.
The SES directly affect the water supply by
increasing reservoir storage and water imports and by altering the landscape by two principle means: 1. Future regional population and urban planning policy will determine the changes to the Urban and Suburban areas within the regions and consequent hydrological effects resulting from changed evapotranspiration and surface sealing. 2. The agricultural policy within the SES determines future changes to the agricultural landscape and the crops grown within it. This might result from: a. changes to agricultural policy e.g. farm subsidies, CAP reform; b. changes in fuel/transport/climate change mitigation policy leading to large demands for non-food bioenergy crops; c. technical changes such as increased yields; and d. non-agricultural policy scenario inputs such as increased labour and fertiliser costs.
These SES-induced landscape changes, coupled with changes in agriculture practices resulting from climate change, affect the abstraction availability by altering the hydrological behaviour through changed evaporative losses. Despite these direct impacts on hydrological behaviour, the indirect influence of the socio-economic futures on abstraction availability through the policy arena is much
14
more significant. The determination of the volumes of water that can be abstracted is determined by the value that society places on the environment and the consequent reluctance for environmental stress to be imposed on aquatic habitats and species. By accepting greater environmental stress, particularly at times of low flow, a future society can significantly increase the availability of water for human uses but at the probable cost of reduced ecosystem services.
Table 6 separates out the changes in water supply in East Anglia due to climate change (given by a 2050s High climate), the direct landscape change and reservoir capacity and net water imports effects, and the indirect REP effects, under the GM and RS futures. These show that the regional decrease in abstraction availability due to climate change is partially moderated, under both futures, by the changes in the urbanisation and agriculture landscapes caused by the SES. However, the greatest effect is that caused by the choice of the environmental rights of the river systems to water. The spatial variability of the distribution in abstraction availability changes due to climate change and socio-economic change are shown in Figure 6.
5.3
Limiting future irrigation abstraction – water pricing, tradable markets or licence
restrictions?
Significant future water resource shortfalls have been identified in East Anglia under current socioeconomic conditions and the environmentally-protective GS and RS SES under all climate scenarios. Such a situation is already recognised as there is already no additional water available for surface or groundwater abstraction, particularly in summer, in many parts of East Anglia. The future drier conditions will therefore necessitate significant adaptation responses if draconian water resource restrictions under the current water management policies are not to be implemented in these socioeconomic futures.
The two principal institutions responsible for drought management in the two study areas are the Environment Agency (the national environmental regulator) and the water utilities. Currently, the policy instruments that they deploy to manage drought are informational, infrastructural and regulatory. It has been advocated by Merrett (2004) that the regulatory instruments of drought management should be replaced by economic instruments, or that water markets should be set up for farmers to sell their water rights (Merrett, 2003). However, water markets are likely to lead to the transfer of water away from agriculture towards higher value uses such as the leisure sector (in particular golf courses) and domestic and industrial water use.
15
Whilst such an approach has advantages, such as providing the greatest volumetric economic benefit, it may have significant social and economic implications for the rural agricultural community (Morris et al., 2004) in removing a resource which provides access to higher value commodities such as potatoes, vegetables etc. Irrigated farming in England performs well against financial and social indicators of sustainability - farm incomes and value-added after subsidies are shown by Morris et al. (2004) to be considerably higher than rainfed cropping, reflecting the role of supplementary irrigation for produce quality enhancement. In social terms, rural employment is higher and the seasonality of work (picking and processing) is more even, often with very positive multiplier effects in the local community.
In areas of future water deficit arising from climate and socio-economic change such as East Anglia, banning or severely restricting the use of water for irrigation is a policy response that should be considered with extreme caution. Restrictions on agricultural irrigation can be achieved directly through regulatory approaches (e.g. licence restrictions) or indirectly via economic instruments (principally volumetric abstraction costs). Historically, the Environment Agency in England and Wales was only empowered to charge for water on the basis of the costs of administering the licensing and regulation system, and not for the environmental costs of abstraction. The main instrument to currently limit the environmental impacts of abstraction is that of restrictions on the abstraction licences, especially volumetric or trigger limits on summer abstraction.
However, the Water
Framework Directive will introduce changes in the use of economic instruments, in particular the principle of full cost recovery of water services which will include the cost of environmental protection and mitigation of impacts.
The effectiveness of economic instruments on agricultural water demand is not solely dependent on water pricing, but also on the food production priorities and markets of the SES. Irrigated agriculture within the economically-driven GM future under a 2050s High climate, in which local food production is not a priority in the global market, is relatively price sensitive to irrigation water costs with increases in total cost producing progressively larger reductions in water demand (Figure 7). Although average total irrigation costs (for relatively large irrigated areas) currently range between £0.30 - 0.70 per m3 applied in the field according to the need for water storage, licensed abstraction charges are only about 5-7% of total costs, so that a 5% increase in total costs reflects a doubling in the current volumetric charge. In contrast, a far greater increase in water costs within the RS future produces no significant decrease in irrigation demand as local food production is a priority with resultant higher crop prices and gross margins. For example an absolute increase in water cost of 50% produces a decrease in irrigation demand of less than 10%. This is despite the higher default costs of water under this scenario which are 190% of current levels. The above cost increases under the RS scenario represent significant increased costs to the farmer. However, regional irrigation
16
demand, even under these higher costs, is similar to the current baseline demand (Figure 8), although changes in irrigation demand are not spatially uniform.
Although the overall effect of price increases on irrigation demand differs between the scenarios, there are similarities in the simulated farmer responses. In both cases, the increase in water cost leads to a relative shift in water usage towards higher value crops, so that there is a larger decrease in sugar beet production (-5% for both GM and RS) than for potato production (and by inference vegetable production), because of its higher value (-0.4% for GM and -1.3% for RS). Such a shift has been observed in the UK, with the largest decreases in irrigated area and volume for low value uses such as irrigating cereals and grass (Weatherhead et al., 1997).
The results show that the efficacy of pricing to control water demand varies according to the socioeconomic conditions prevailing within a future. Under futures where local sustainable agricultural production is a priority, total irrigation water costs need to rise significantly before significant reductions in irrigation abstraction are observed.
Because of the strength of irrigation demand
amongst the potato (and by inference vegetable) irrigators and the high marginal benefit of water on these crops, farmers would, at least in the short term, be inclined to absorb the price increases before they significantly change their water consumption. Morris et al. (2004) suggest that to achieve a 10% reduction in water consumption in England using the water price mechanism would require water prices to rise from £0.03/m3 for summer water to about £0.75/m3, which would lead to a 40% reduction in income to the farmers.
In such socio-economic futures, constraints on irrigation demand are best managed through volumetric restrictions on the abstraction licences, and trigger limits on summer abstraction. In more market-orientated futures, the likely increases in water charges of 30-40% over the next five years, possibly doubling over 10 years (Morris et al., 2004) due to full cost recovery may be sufficient to control demand.
6. Conclusions
A multi-scale approach has been applied for linking farm level agronomic decisions with an assessment of regional water supply that allows for the water needs of the aquatic environment and the competing demands for water in East Anglia and North West England. Irrigated agriculture is a regionally important sector in East Anglia, and will continue to be so in some form in most socioeconomic futures. Climate change may lead to increased irrigation demand arising from increased
17
atmospheric demand (East Anglia and North West) and increased crop suitability (North West). Under baseline socio-economic conditions, such increased demands for water can be met under all climate scenarios in the North West. However, in the drier East Anglian region, increases in irrigation demand are counter to the decreasing availability of water mainly due to the reduced winter rainfall under all climate scenarios. Therefore, in the absence of socio-economic change, the availability of water for irrigation in East Anglia is likely to get further restricted.
This study incorporates the relative priorities given to human and environmental water needs recognising that they are neither static nor constant between socio-economic futures. The future supply-demand balance is mainly dependent upon the water demand under economically-focussed futures (GM and RE) and upon the water supply, as primarily determined by the priority given to the environmental allocation of water, under environmentally-focussed futures (RS and GS). For East Anglia, under GM and RE, the lower priority that is given to environmental flow requirements results in significantly increased availability of water, but which is wholly (RE) or partly (GM) offset by increasing demand from all sectors (domestic, industrial/commercial and agriculture) and leakage. Under RS and GS, the decreased allocation of water for abstraction and resultant decreased supply does not meet the decreased demand, necessitating further adaptation.
The simulated future water shortages in East Anglia suggest that adaptation responses will have to be applied to the different water users, although the need differs according to the socio-economic futures, as the impacts of climate change on the water supply-demand balance are moderated under the GS, GM and RS futures.
Restrictions on agricultural irrigation can be achieved directly through
regulatory approaches (e.g. licence restrictions) or indirectly via economic instruments (volumetric abstraction costs). The effectiveness of water pricing as an irrigation demand reduction tool is dependent upon the scenario. Under a scenario in which regional food production is important (e.g. RS), the demand for irrigation water is relatively insensitive to water price and abstraction control will be more effective. However, in the globally competitive future of GM, irrigation demand is pricesensitive with relatively small price increases causing large reductions, especially in irrigation applied to sugar beet.
7. Acknowledgements This work was carried out as part of the RegIS2 project (CC0362) funded by the UK Department for Environment, Food & Rural Affairs, with support from UK Water Industry Research (UKWIR). Catarina Henriques was partly funded by the Portuguese ‘Fundação para a Ciência e a Tecnologia’, funded by the European ‘Fundo Social Europeu’ and the National MCES. River gauging data was provided by the National River Flow Archive maintained by the Centre for Ecology and Hydrology.
18
8. References Acreman M, Dunbar MJ (2004) Defining environmental river flow requirements- a review. Hydrology and Earth System Sciences 8(5): 861-876 Arnell NW, Liu C, Compagnucci R, da Cunha L, Hanaki K, Howe C, Mailu G, Shiklomanov I, Stakhiv E (2001) Hydrology and Water Resources. In: McCarthy JJ, Canziani O, Leary NS et al. (eds), Climate Change 2001: Impacts, Adaptation, and Vulnerability. Contribution of Working Group II to the Third Assessment Report of the Intergovernmental Panel on Climate Change, Cambridge University Press: Cambridge, pp. 191-233 Audsley E, Pearn KR, Harrison PA, Berry PM (2008) The impact of future socio-economic and climate changes on agricultural land use and the wider environment in East Anglia and North West England using a metamodel system. Climatic Change 90(1-2), 57-88 Baron JS, Poff NL, Angermeier PL, Dahm CN, Gleick PH, Hairston NG, Jackson RB, Johnston CA, Richter BD, Steinman AD (2002) Meeting ecological and societal needs for freshwater. Ecological Applications 12(5): 1247-1260 Boorman DB, Hollis JM, Lilly A (1995) Hydrology of Soil Types: A Hydrologically based classification of the soils of the UK. Institute of Hydrology Report No. 126, Wallingford, UK Davies A, Jenkins T, Pike A, Shao J, Carson I, Pollock CJ, Parry ML (1997) Modelling the predicted geographic and economic response of UK cropping systems to climate change scenarios: The case of potatoes. Annals Of Applied Biology 130(1): 167-178 Diaper C, Jefferson B, Parsons SA, Judd SJ (2001) Water-recycling technologies in the UK. J. Water Environ. Manage. 15(4): 282-286 Doll P (2002) Impact of climate change and variability on irrigation requirements: A global perspective. Climatic Change 54(3): 269- 293 Downing T, Butterfield R, Edmonds B, Knox J, Moss S, Piper B, Weatherhead E (2003) Climate Change and Demand for Water. Final Report to DETR, London. (Available in http://www.sei.se/oxford/ccdew/) Dunbar MJ, Acreman MC, Kirk S (2004) Environmental flow setting in England and Wales – current practice: future challenges. J. Water Environ. Manage. 18: 5-10 Environment Agency (2001) A scenario approach to water demand forecasting. National Water Demand Management Centre, West Sussex
19
Environment Agency (2002) Resource Assessment and Management Framework- Summary Document. R&D Manual W6-066M version 3 Frederick KD, Major DC (1997) Climate change and water resources. Climatic Change 37(1): 7- 23 Gustard A, Bullock A, Dixon JM (1992) Low flow estimation in the United Kingdom. Institute of Hydrology Report No. 108, Wallingford, UK Henriques C (2007) Hydrology and water resources management in East Anglia and North West England in the context of climate and socio-economic change. PhD dissertation, Cranfield University, UK http://hdl.handle.net/1826/2743 . Herrington P (1996) Climate Change and the demand for water. HMSO Department of the Environment, London Hess T, Harrison P, Counsell C (2000). WaSim Technical Manual, HR Wallingford and Cranfield University Holman IP, Rounsevell MDA, Shackley S, Harrison PA, Nicholls RJ, Berry PM, Audsley E (2005) A regional, multi-sectoral and integrated assessment of the impacts of climate and socio-economic change in the UK: I Methodology. Climatic Change 71: 9-41 Holman IP, Rounsevell MDA, Cojacaru G, Shackley S, McLachlan C, Audsley E, Berry PM, Fontaine C, Harrison PA, Henriques C, Mokrech M, Nicholls RJ, Pearn KR, Richards JA (2008) The concepts and development of a participatory regional integrated assessment tool. Climatic Change 90(1-2), 5-30 Hooker PJ, McBridge, D, Brown, MJ, Lawrence, AR, Gooddy DC (1999) An integrated hydrogeological case study of a post-industrial city in the West Midlands of England. In: Chilton J (ed), Groundwater in the urban environment – selected city profiles. AA Balkema, Rotterdam, pp 145–150 Hulme M, Jenkins GJ, Lu X, Turnpenny JR, Mitchell TD, Jones RG, Lowe J, Murphy JM, Hassell D, Boorman P, McDonald R, Hill S (2002) Climate Change Scenarios for the United Kingdom: The UKCIP02 Scientific Report. Tyndall Centre for Climate Change Research, School of Environmental Sciences, University of East Anglia, Norwich, UK Izaurralde RC, Rosenberg NJ, Brown RA, Thomson AM (2003) Integrated assessment of Hadley Center (HadCM2) climate-change impacts on agricultural productivity and irrigation water supply in the conterminous United States - Part II. Regional agricultural production in 2030 and 2095. Agricultural And Forest Meteorology 117(1-2): 97-122 Jones RN (2001) An environmental risk assessment/management framework for climate change impact assessments. Natural Hazards 23(2-3): 197-230
20
Merrett S (2004) The potential role for economic instruments in drought management. Irrigation And Drainage 53(4): 375-383 Merrett S (2003) The urban market for farmers' water rights. Irrigation And Drainage 52(4): 319- 326 Morris J, Weastherhead EK, Knox JW, Vasileiou K, de Vries TT, Freemand D, Leiva FR, Twite C (2004) The case of England and Wales. In: Vecino JB, Martin CG (eds) Sustainability of European Irrigated Agriculture under Water Framework Directive and Agenda 2000. Final report of 5th Framework project EVK1-2000-00057, ISBN 92-894-8005-X Naiman RJ, Bunn SE, Nilsson C, Petts GE, Pinay G, Thompson LC (2002) Legitimising fluvial ecosystems as users of water: an overview. Environmental Management 30(4): 455-467 Rosenzweig C, Strzepek KM, Major DC, Iglesias A, Yates DN, McCluskey A, Hillel D (2004) Water resources for agriculture in a changing climate: international case studies. Global Environmental Change-Human And Policy Dimensions 14(4): 345-360 Rounsevell MDA, Annetts JE, Audsley E Mayr T, Register I (2003) Modelling the spatial distribution of agricultural land use at the regional scale. Agriculture, Ecosystems and Environment 95(2-3): 465-479. Shackley S, Deanwood R (2003) Constructing social futures for climate-change impacts and response studies: building qualitative and quantitative scenarios with the participation of stakeholders. Climate Research 24 (1): 71-90. Stansfield CB (1997) The use of water for agricultural irrigation. J. Water Environ. Manage. 11(5): 381-384 Strzepek KM, Major DC, Rosenzweig C, Iglesias A, Yates DN, Holt A, Hillel D (1999) New methods of modeling water availability for agriculture under climate change: The US Cornbelt. Journal Of The American Water Resources Association 35(6): 1639-1655 Tharme RE (2003) A global perspective on environmental flow assessment: emerging trends in the development and application of environmental flow methodologies for rivers. River Research and Applications 19: 397-441 Thomson AM, Rosenberg NJ, Izaurralde RC, Brown RA (2005) Climate change impacts for the conterminous USA: An integrated assessment - Part 5. Irrigated agriculture and national grain crop production. Climatic Change 69(1): 89-105 UN/WWAP (United Nations/World Water Assessment Programme) (2003) UN World Water Development Report: Water for People, Water for Life.
UNESCO (United Nations
Educational, Scientific and Cultural Organization) and Berghahn Books, Paris, New York and Oxford
21
Van de Ven, F.H.M, Nelen, A.J.M and Geldof, G.D (1992) Urban Drainage. In: Smart, P and Herbetson, J.G (eds), Drainage design, Blackie, Glasgow and London, pp 118-150. Victoria, F.B., Viegas, J.S., Pereira, L.S., Teixeira, J.L. and Lanna, A.E. (2005)
‘Multi-scale
modeling for water resources planning and management in rural basins’, Agricultural Water Management 77(1-3): 4-20. Weatherhead, E.K., Knox, J.W, Morris, J., Hess T.M., Bradley R.I. and Sanders, C.L. (1997) Irrigation demand and on-farm water conservation in England and Wales, Final Report to Ministry of Agriculture, Fisheries and Food. MAFF Project OC9219. Cranfield University, Bedford. Weatherhead, E.K. and Knox, J.W. (2000) ‘Predicting and mapping the future demand for irrigation water in England and Wales’, Agricultural Water Management 43(2): 203-218. Woods, A. (2000) ‘Agriculture: Sustainable business - Sustainable environment?’ J. Water Environ. Manage. 14 (2): 94-98. Yang, Y., Lerner, D.N., Barrett, M.H. and Tellam, J.H. (1999) ‘Quantification of groundwater recharge in the city of Nottingham, UK’, Environmental Geology 38(3): 183-198.
22
Cumbria
#
Solway Firth
The Broads Norfolk
#
Peterborough
Lake District
#
The Fens Norwich
#
#
#
Morecambe Bay Lancashire #
Cambridge
Cambridgeshire
Liverpool # #
20
Manchester 20
Kilometers 0 20 40
0
Cheshire N
Figure 1: The (left) North West and (right) East Anglian regions
23
20 Kilometers
Suffolk
#
Change in resource/demand (Ml/d) Change in resource / demand (Ml/d)
2020s Low
2020s High
2050s Low
2050s High
2050s Low
2050s High
100 0 -100 -200
Abstraction availability Irrigation demand
-300
2020s Low
2020s High
100 0 -100 -200
Abstraction availability Irrigation demand
-300
Figure 2: Change in irrigation demand and abstraction availability in (upper) East Anglia and (lower) North West for different climate scenarios under current socio-economic conditions
24
25
Change in regional production (%)
2020s Low
2050s Low
2050s High
20 Potatoes Sugarbeet
10 0 -10 -20
2020s Low Change in regional production (%)
2020s High
2020s High
2050s Low
2050s High
60 Potatoes Sugarbeet
40 20 0 -20 -40 -60
Figure 3: Percentage change in total regional production of potatoes and sugar beet in (upper) East Anglia and (lower) North West, relative to baseline
26
Change in irrigated area (ha)
Change in irrigation demand (Ml / 100 ha land) 25 - 50 1 - 25 0 -34 - -1
0.9 - 1.3 0.1 - 0.9 0 -0.9 - -0.1 -1.7 - -1.0
Figure 4: Change in irrigated area of (left) sugar beet potential and (centre) potatoes in North West and (right) change in irrigation demand under 2050s High climate and baseline socio-economic scenario (relative to baseline)
27
Supplydemand balance (Ml/day) .
Supply demand balance (Ml/day) .
200 100 0 -100 -200 -300 -400 Baseline
2020s Low
2020s High
2050s Low
2050s High
Baseline
2020s Low
2020s High
2050s Low
2050s High
2000 1600 1200 800 400 0
Figure 5: Regional water supply demand-balance (negative = deficit of supply) for (upper) East Anglia and (lower) North West under baseline socio-economic scenario (Ml/day)
28
Change in abstraction availability (%) 75 - 113 25 - 75 -25 - 25 -75 - -25