An Interactive Reverse Engineering Environment for Large-Scale C++ Code Alexandru Telea∗ Institute of Mathematics and Computing Science University of Groningen, the Netherlands
Abstract Few toolsets for reverse-engineering and understanding of C++ code provide parsing and fact extraction, querying, analysis and code metrics, navigation, and visualization of source-code-level facts in a way which is as easy-to-use as integrated development environments (IDEs) are for forward engineering. We present an interactive reverse-engineering environment (IRE) for C and C++ which allows to set up the fact extraction process, apply userwritten queries and metrics, and visualize combined query results, metrics, code text, and code structure. Our IRE tightly couples a fast, tolerant C++ fact extractor, an open query system, and several scalable dense-pixel visualizations in a novel way, offering an easy way to analyze and examine large code bases. We illustrate our IRE with several examples, focusing on the added value of the integrated, visual reverse-engineering approach.
1
Introduction
Static code analysis is an important step in activities such as program understanding, software maintenance, reverse engineering, and redocumentation. Within static analysis, several operation are executed, such as code parsing and fact extraction, fact aggregation and querying, and presentation. To be effective in scenarios ranging from architecture extraction to code transformation and quality control, the various software tools involved in the above operations must comply with several requirements. First, a fact extractor must be able to produce both high-level facts (e.g. call and inheritance graphs) and low-level facts (e.g. syntax trees) from possibly incorrect and incomplete millions of lines-of-code (LOC). Second, mechanisms should be provided to select the subsets of interest from the extracted raw data, query and analyze these in a variety of ways to detect various code smells or compute quality and safety metrics. Third, interactive presentation and exploration mechanisms should be provided to drive the entire understanding process. Finally, to be practical for a wide range of software engineers, all above tools should be tightly integrated and simple to use and learn. For C++, few tool-chains meet all above requirements, especially the simplicity-of-use for non-experts. We present here an Integrated Reverse-engineering Environment (IRE) for C and C++ which provides seamless integration of code analysis (parsing, fact extraction, metric and query computations) and presentation (interactive visualizations of source-code, metrics, and code relations). Our solution is aimed at detailed, full-scale, low-level code analysis up to the level of local variables, as opposed to more general reverseengineering tools which extract and present only the high-level sys∗
[email protected]
†
[email protected]
Lucian Voinea† SolidSource BV Eindhoven, the Netherlands
tem architecture. In the same time, we advocate an open solution where queries, metrics, and presentations are fully user customizable. Overall, our IRE offers to reverse engineers the look-andfeel of Integrated Development Environments (IDEs) such as Visual C++ or Eclipse, enhanced with scalable visual presentations which let users easily browse and analyze huge code bases. Our focus here is to detail on the architecture of the IRE and of its several components (parser, query system, coordinated visualizations), and the design decisions which have made possible the creation of an IRE which satisfies all requirements mentioned earlier. For a related paper focusing mainly on the IRE’s applications, see [Telea et al. 2008a].
This paper is structured as follows. In Section 2, we overview related efforts on interactive visual reverse engineering, with a focus on C++. Section 3 presents the architecture of our IRE and details the design of its main components: the C++ fact extractor and the fact query system. Section 4 presents the visualizations provided by our IRE, details on tool integration issues, and describes sample applications. Section 5 details on performance and user experience issues. Section 6 concludes the paper and outlines future work directions.
2
Related Work
Many reverse engineering toolsets exist in the research and industry arena. Here, we focus mainly on high-performance tools supporting C++ and which cover the entire spectrum from fact extraction to querying and presentation. There are two main classes of C++ fact extractors. Lightweight extractors do only partial parsing and type-checking and thus produce only a fraction of the entire static information, e.g. S RC ML [Collard et al. 2003], SNIFF+, G C C XML. Heavyweight extractors perform (nearly) full parsing and type checking, e.g. DMS [Baxter et al. 2004], ASF+SDF [van den Brand et al. 1997], CPPX [Lin et al. 2003], E LSA [McPeak 2006; McPeak ], and C OLUMBUS [Ferenc et al. 2004]. We aim to enable users to perform detailed analyses of all bits of the source code, so we need a heavyweight extractor. Such extractors can be further classified into strict ones, based on a compiler parser which halts on lexical or syntax errors, e.g. CPPX; and tolerant ones, based on fuzzy parsing or Generalized Left-Reduce (GLR) grammars, e.g. C OLUMBUS. Such extractors are typically run in batch mode. Their output is typically analyzed and queried using text-based tools, or, more rarely, visualization tools. Many software visualization systems exist, ranging from source-level [Eick et al. 1992; Lommerse et al. 2005] up to architecture visualizations [Storey et al. 2000]. Tools used to evaluate code smells or compute code metrics [Lanza 2004] fit somewhere between the extraction and visualization tools. However, there are few, if any, tools which combine heavyweight, tolerant C++ fact extraction with code analysis and visualization in a single scalable reverse-engineering environment, in the same way forward-engineering IDEs such as Visual C++ combine compilers, linkers, debuggers, profilers, code editors, and various visual plugins.
3
Environment Architecture
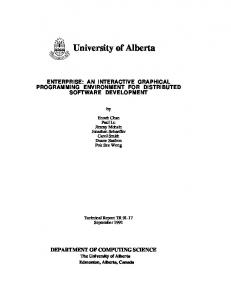
We present here S OLID FX, an integrated reverse-engineering environment (IRE) for C and C++ that combines fact extraction, querying, analysis, and visualization in a single coordinated system. Our IRE consists several tools: a parser and fact extractor, a query and metric computation engine, and several data views. These communicate via a central fact database (Fig. 1), which contains both the raw data extracted from the source code and refined data created during an analysis session. To understand the various subtleties involved and design decisions involved in its construction, we next detail our IREs architecture.
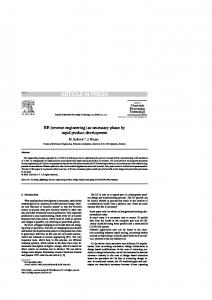
scribed next. First, we introduce some terminology. A code base is parsed one translation unit at a time. A translation unit consists of a source file and all its included headers, much like for a compiler. A topform is a syntax element appearing on the highest scope level in a translation unit or in a namespace. Hence, a translation unit is a sequence of topforms or namespaces containing topforms. For each translation unit, we extract four types of data elements, to create our so-called fact database: 1. syntax: the complete AST of the unit, including its headers; 2. type: the type nodes created during disambiguation; 3. preprocessor: the preprocessor directives used; 4. location: each syntax and preprocessor element has a (f ile, row, column) location in the code. This is needed for location-based queries (Sec. 3.6) and for visualizing queries and metrics on the code (Sec. 4). Our fact extractor works in four phases (Fig. 2). First, the parser, preprocessor and preprocessor filter operate in parallel. The preprocessor reads the input files specified via a project setup (Sec. 3.5) and outputs a token stream enriched with location data (Sec. 3.2). The parser reads this stream as it performs reductions and builds the AST, and extends E LSA’s parser to handle incomplete and incorrect input (Sec. 3.3). Second, the AST is disambiguated and typechecked using E LSAs original type-checker. Third, the extracted data is filtered to keep the facts of interest by a customizable filter strategy (Sec. 3.4). The results are written to file using a compact binary format. Finally, the output files can be queried using a query API which enables users to define and execute arbitrarily complex queries on the extracted facts (Sec. 3.6). These phases are detailed next.
3.2
Figure 1: Dataflow architecture of S OLID FX
3.1
Fact Extraction
We parse C and C++ code using our own fact extractor, built atop the E LSA parser. E LSA is a C and C++ parser [McPeak 2006] constructed using a GLR grammar with the E LKHOUND parsergenerator [McPeak ]. Atop the parser which produces a parse forest of all possible input alternatives, E LSA adds the complex typechecking, scoping, and symbol lookup rules that disambiguate the input to yield an Annotated Syntax Graph (ASG). The ASG contains two types of nodes: abstract syntax tree (AST) nodes, based on the GLR grammar; and type nodes, which encode the typeinformation created during disambiguation and type checking, and are attached to the corresponding AST nodes. However powerful, E LSA lacks several features needed to make it usable within an open, extendable, interactive environment. No preprocessor facts are extracted; error recovery lacks, so incorrect code causes parse errors or even crashes; not all Standard C++, nor its dialects, are covered; no project concept is provided, so analyzing large code bases is tedious; the output cannot be filtered or queried for specific facts; no linker is provided to find common symbols across translation units; and location data is output for the beginning of syntax elements only, and only as lines (no columns). We have extended E LSA to eliminate all these limitations, as de-
Enhanced Preprocessing
Parsers such as E LSA typically keep a map from which AST node locations can be computed. As mentioned, exact location information is essential for query and metrics visualization (see Sec. 4). However, macro expansions make this map unreliable. The parser does not know when a location arises from an expansion and thus cannot always exactly map locations to the original source. Exact token locations in the input source file are only present in the preprocessor. Solving this issue involved several subtleties, as follows. We modified both the preprocessor and parser so that each syntax construct has a location consisting of a begin and an end marker, each having a row and column attribute, a file-ID, and whether the marker is inside a macro expansion. The file-IDs for a constructs begin and end markers can differ, due to some complex uses of the #include directive. Also, a construct can arise partly from a macro expansion and partly not, which is why we need to flag for expansion at both ends. We cannot use a standard preprocessor, e.g. from gcc or Visual C++, as these do not report location changes due to expansions. We solve the problem using a customizable preprocessor library, e.g. Wave [Karlsson 2005] or LIBCPP [Stallman and Weinberg 2006]. We modified these to stream markers (described above) together with tokens to the parser. Markers flow unchanged through the parser (Fig. 3). We use two lexical scanners, one in the preprocessor (A) and one in the parser (B). To keep the two scanners in sync, we also stream token lengths with the markers. Using a single scanner, as in e.g. ANTLR [Parr and Quong 1995], is a slightly faster and cleaner design, but implies heavy re-coding of both LIBCPP and E LSA. We took here a pragmatic approach, similar to SNIFF+ [Bischofberger 1992]: We use existing tools with minimal changes, as long as they match our requirements.
Figure 2: Architecture of the S OLID FX C++ parser (main components marked by thick frames)
Figure 3: Enhanced preprocessor-parser architecture
3.3
Parsing Erroneous Code
E LSA requires syntactically correct and complete input. To parse incorrect and incomplete code, and handle both lexical and parse errors, we added special grammar rules starting with a special “garbage” token to the E LKHOUND C++ grammar. For correct C++, such rules are never entered. During the GLR parsing, we track so-called error-recovery states (ERSs), in which garbage tokens can be shifted. Upon a parse error, we move the parser to the most recent ERS at the front of the parse tree, which cleans up all unreachable parse tree states. Such ERSs reflect parse positions within the erroneous part. At error recovery, we prefix the scanner output by a token sequence starting with the garbage token followed by the right amount of opening or closing braces to match the nesting-level where the error occurred relative to the ERS. After prefixing, the normal GLR algorithm continues. The prefixed scanner output, from the parse error onwards, gets matched to an error-recovery rule which skips the erroneous input so parsing continues normally. Our approach, where error-handling grammar rules get activated on demand, resembles the hybrid parsing strategy suggested, but not implemented, in [Knapen et al. 1999]. Our method lies between ANTLR’s simple error recovery, i.e. consuming tokens until a given one is met, and its more flexible parser exception handling, i.e. consuming tokens until a state-based condition is met. Just as ANTLR’s authors [23], we found the complexity not in the grammar, but in efficiently saving and restoring the parsers intricate internal state in the error recovery. Our recovery method does not try
to guess the meaning of erroneous code by trying to fit it into correct grammar rules, as e.g. [Burke and Fisher 1987], as this can easily lead to misinterpretations. Our error-recovery rules match any token to the nearest semicolon or the outermost brace pair. Hence, we can recover from topform, class-scope, and even function-scope errors. Our error recovery added only 6 rules to the original E LSA grammar. This optimally balances error recovery granularity, performance, and simplicity. We could provide error recovery at finer levels, e.g. expressions. Yet, this means keeping more information in the ERS and substantially more complex recovery rules, hence an overall slower parsing.
3.4
Output Filtering
All extracted data elements (AST, type, preprocessor) are assigned a per-extraction-unit unique ID. This lets all IRE tools (parser, filter, linker, query system, and visualizations) communicate via lightweight sets of node-IDs, or selections. The generated data is saved in compressed binary format, together with index maps mapping the element IDs to their binary file offsets. We also save separate index maps for the most important elements, i.e. topforms, declarations, functions, and global variables. These maps allows constant-time file retrieval of any extracted element by its ID, and also fast iteration over all elements of indexed element-types. Both mechanisms are vital in implementing fast queries (Sec. 3.6) and visualizations (Sec. 4). The saved data is detailed enough to exactly reconstruct the input code from it. Output size can be a problem, e.g. when the analyzed code in-
cludes large headers such as STL, Boost, or the Windows headers, of which only a tiny fraction is typically used in the code. We provide output filters to modularly specify what to output and what not. One filter mimics a compiler, i.e. eliminates all extracted elements which are not referenced in the source code, e.g. unused declarations or macros from the headers. Filtering unreferenced code elements from included headers typically reduces the size of the translation units, and hence their I/O and querying time, by more than one order of magnitude (see Sec. 5.1). Another filter outputs only elements originating from a given set-of-interest of the input files, as follows. Note that an AST node can originate from one or more files, e.g. when a syntax construct ends with a macro defined in another file or #includeing code. The filter outputs an AST node if at least one of its originating files is in the set-of-interest. As an AST node needs full context to be useful, we actually output the topform containing it and all referenced type-nodes too. Filtering is done by two separate engines, one for preprocessor data (Preprocessor filter), implemented in LIBCPPs callback functions [Stallman and Weinberg 2006], and one for AST and type data (AST filter), implemented using the visitor pattern API of E LSA’s AST (Fig. 1). The filtered output is streamed to the outputgenerator which creates binary files.
3.5
Project concept
E LSA does not have the notion of a project. It must be run on every input file with correct command-line parameters, e.g. include paths, compiler flags, and #defines. For code bases thousands of files, this is not scalable. We created a project concept for S OLID FX that allows easy handling of industry-size code bases. Sources are grouped in batches, based on path, file-type, or user preferences. Batches can be enabled, disabled, and ordered for extraction as desired. Specifying extraction order can save time, as results can be analyzed before an entire project has been processed (Sec. 4). This is important for large projects taking hours to process (Sec. 5.1). Besides input files, projects also specify a compiler profile and a list of project profiles. Compiler profiles specify which compiler dialect to emulate (e.g. g++, Microsoft Visual C++, or Borland C++) and which standard headers to use. Supporting different dialects is essential for correct analysis. Visual C++s extensions, e.g. throw(...) directive, finally clause and asm{} statement, are added via extra grammar rules. The g++ extensions are already supported by the original E LSA parser. Profiles provide an open way to add C++ extensions to S OLID FX, such as Qts signal and slot extensions, if needed. Project profiles specify system and user include paths, #defines, and forced includes. They are handy when analyzing many code bases which use the same library or third-party code. We also created a translator from makefiles and XML-based Visual Studio projects to S OLID FX projects, enabling users to analyze complex projects with virtually no setup effort. Different approaches for project handling exist, e.g. C OLUMBUS so-called compiler wrapping [Ferenc et al. 2004]. This overloads the compiler and linker tools by the fact-extractor and extractorlinker respectively, using the P AT H environment variable, and runs the original makefiles to do the extraction. Compiler wrapping is an interesting technique that we plan to implement in the near future. We also built a so-called linker, similar to CANLINK in C OLUM BUS . Our linker identifies the occurrences of the same topform in different parsed (output) files and saves these in a per-project index file, or linkmap, which can be next used by analysis tools. Unlike a classical compiler linker, which only links functions and global variables, we can handle any kind of topform, e.g. declarations.
3.6
Fact Querying and Metrics
The AST of a 100 KLOC code base can easily contain over one million nodes. On such data, users need to ask both detailed, lowlevel questions e.g. ”find all calls of a default constructor which throws an exception called X”, and high-level questions, e.g. ”show the systems call graph” or ”show all highly-complex functions”. We provide an open query engine, designed as a C++ class library, that handles both types of questions. Queries read and write selections. A query effectively implements the function sout = {q(x, pi ), ∀x ∈ sin } which finds those code elements x from a given selection sin which satisfy a function q(x, pi ), where pi are specific query parameters. The query engine design satisfies two goals: performance, i.e. execute complex queries on MLOC-sized code bases (which may not fit in the computer memory) in a few seconds; and flexibility, i.e. let users design complex queries in an easy and non-intrusive way. We achieve both goals by the following architecture (Fig. 4). The function q(x, pi ) is implemented by a number of specialized query subclasses, as follows. For AST nodes x, V isitorQuery visits the AST tree rooted at the input node x and searches for nodes of a specific syntax-type T , e.g. function, optionally checking for attributes, e.g. the functions name. For each of the 170 syntax types T in our C++ GLR grammar, we generate a query class containing children queries for T s non-terminal children and data attributes for T s terminal children. For instance, the F unction query has a property name for the functions name, and two children queries body and signature for the functions body and signature. Besides queries for AST nodes, which search for syntax, we also created T ypeQueries which search for type-data, and LocationQueries which search for code fragments having a particular file, line, or column location in the code. Queries can be composed in query-trees. Query composition semantics is controlled by a separate customizable Accumulator class (Fig. 4). When a child qc of a query q yields a hit, q calls its Accumulators accumulate() method, which returns true when the Accumulators condition has been met, else false. All query nodes use by default an AN D-accumulator, which returns true when all queries in a query-tree are satisfied. We designed Accumulator subclasses for different operators, e.g. AN D, OR, , and similar. These let us easily implement complex queries by combining simple ones. For example, to find all functions whose name begins with ”Foo” and have at least two parameters of type ”Bar”, we set the F unction querys name attribute to ”Foo*” using wildcard expressions, the name attributes of the T ype nodes of the functions P arameter children-queries to Bar, and an AtLeastAccumulator with a default-value of 2 on the functions Signature child-query. Overall, the query composition can be modified transparently by different accumulators, without having to change the query classes. We store query-trees in XML, and provide a query editor, so users can edit queries on-the-fly, without recompilation, and organize queries in custom query libraries. We have so far designed over 50 queries that cover a number of static analyses, such as identifying basic code smells e.g. case branches without break, class member initializations differing from the declaration order, changing access specification of a class member when overriden, base classes with constructed data members and no virtual destructors; and extracting class hierarchy, include, and call graphs. Queries can be executed on both in-memory and on disk fact databases. On-disk queries are very efficient and have a negligible memory footprint, given the index maps that allow random access to elements-by-id and iterating over same-type elements (Sec. 3.4).
Figure 4: Query system architecture, with main elements marked in bold We also implemented a cache mechanism which loads and keeps entire parsed translation units in memory on a most-recently-used policy. This improves query speed even further at the expense of more memory, roughly one megabyte per 5000 LOC. Another simple and effective speed-up uses early query termination when evaluating the query-tree accumulators. All in all, these mechanisms allow us to query millions of ASG nodes in a few seconds. Queries are related to code metrics. We implemented many objectoriented code metrics and code smells, e.g. cyclomatic complexity, number of accessor methods, and actually most other metrics described in [Lanza and Marinescu 2006], simply by counting the results of their corresponding queries. Metrics are saved as SQL database tables, one table per selection, indexed by the selected elements IDs and storing one metric per column, and used further in visualizations (Sec. 4).
4
Visual Program Analysis
The fact extractor, linker, and query and metric engines are coupled with the fact database in an Integrated Reverse-engineering Environment (IRE). Together with these, the IRE provides a number of text and graphical views. These enable users to set up an extraction project, browse the fact database, and perform queries and compute metrics. The IRE revolves around the selection data model (Sec. 3.4): Each view displays one or more selections, and each IRE operation reads and writes one more selections too, following the dataflow model in Fig. 1.
4.1
Integrated Visualizations
Figure 5 shows several views of our IRE, as follows1 . The project view allows setting up an extraction project, just as a classical build project in e.g. Visual C++. The fact database shows the fact files created by the S OLID FX parser. The selection view shows all selections in the fact database. The extraction generates one selection for every parsed file. More selections can be created by analysis 1 For a video showing the IRE in use, see www.solidsource.nl/ video/SolidFX/SolidFX.html
operations and direct user interaction, as described further. Each selection has several visual user-controllable attributes: • visibility: Visible selections are shown in the data views (code, metrics, diagrams) discussed below. • color: A selection can be assigned a color. This is either a single base color, or a color mapping which translates from one of the selections computed metrics to a rainbow (blueto-red) colormap. Base colors identifying specific selected elements in the data views, while colormaps show a metrics variation over a range of selected code elements. The code view shows the source code, rendered from the original source files if available, else by printing the parsed AST. The first method is preferred as it is slightly faster and uses less memory. Users can point-and-click this code to select and apply queries or metrics (from the query libraries) which match the clicked nodes type. The query results, stored as selections (Sec. 3.6), are added to the selection view, which acts like a clipboard. Code views also show the code fragments in the visible selections highlighted with their respective colors, atop the code text. One novel feature is the ability to zoom out the code views, decreasing font size, until each code line becomes one pixel line, similar to the well-known SeeSoft tool [Eick et al. 1992]. This enables users to overview up to ten thousand lines on a single screen. In combination with colored selections, this view highlights specific code fragments, e.g. results of a safety query or code smell, or the distribution of a complexity metric, in their code context. The metric view shows the SQL tables storing the metrics available for the currently active selection in the selection view. Each row shows one selection element, having as columns its textual source code description and computed metrics. Instead of a simple Excellike table widget, we implemented this view using the table lens technique [Telea 2006]. Just as the code view, the metric view can be zoomed in and out. Completely zoomed out table cells are replaced by vertical colored and/or scaled bar graphs which show the metrics values for each column. The table view can also be sorted on any of the metric values, and rows having the same value for a given metric can be grouped together. This allows powerful analyses to be done in just a few clicks, e.g. locating the most complex
Figure 5: Integrated reverse-engineering environment views in S OLID FX code fragments (sort on complexity), or detecting correlations of several code smells or metrics across different units (compare two table columns). The query library view shows all queries in the XML-based query library. Each query has an own GUI allowing the setting of its specific attributes (Sec. 3.6), e.g. the name of a variable to search for in the ”Find variables” query, or the depth n in the ”Find all classes of an inheritance depth exceeding n” query. The query input is the currently active selection in the selection view, and the output adds a new selection to the same view. The UML view renders selections containing (template) class declarations as an UML diagram. The graph underlying the diagram, containing classes as nodes and inheritance and uses relations as edges, is extracted by a query, and laid out using the GraphViz or VCG libraries [AT & T 2007; Lemke and Sander 1994]. As uses relations, we consider type and variable uses, including function calls. Class, method, and member metrics computed on the input selection of this view are visualized by colored icons, extending the technique described in [Telea et al. 2008b]. Just as the code and metric view, the UML view is zoomable, allowing to create overviews of hundreds of classes. The call graph view demonstrates the integration of third-party tools in ou IRE, as detailed later in Sec. 4.3. Scale is a major problem when understanding and reverse engineering real-world systems. Within our IRE, we handle scale with several mechanisms. Our S OLID FX parser can efficiently parse million-LOC C/C++ code bases (see Sec. 5.1); the query engine searches our on-disk indexed fact database rapidly and with a small
memory footprint (Sec. 3.6); and the data views can be zoomed out to show thousands of lines of code and metric values on a single screen. All views are linked, so clicking on any element in a view highlights it in all other views where it appears, thereby making complex assessments easy. Also, all views and queries accept selections as input and/or output, thereby making cascaded analyses easy to do.
4.2
Example Applications
We now present three typical applications of our IRE. Given the limited space, we confine ourselves to a brief overview only. First, we examine the complexity of the wxWidgets code base, a popular C++ GUI library having over 500 classes and 500 KLOC. After extraction, we query all function definitions and count their lines-of-code (LOC), comment lines (CLOC), McCabes cyclomatic complexity (CY CLO), and C-style cast expressions (CAST ). Next, we group the functions by file and sort the groups on descending value of the CY CLO metric, using the metric view widget. Figure 6 bottom-left shows a zoomed-out snapshot of this widget focusing on two files A and B. Each pixel row shows the metrics of one function. The long red bar at the top of file B indicates the most complex function in the system (denoted f 1). The other columns show that f 1 is also the best documented (highest CLOC), largest (highest LOC), and, strikingly, is in the top two as number of C-casts (CAST ). Clearly, f 1 is a highly complex and important function in wxWidgets. Double-clicking its table row opens a file view showing all the function definitions and our selected f 1 flashing (Fig. 6 top-left, see also the video). The functions in the code view are colored to show two metrics simultaneously,
Figure 6: Assessing code complexity (left and bottomright) and portability (topright) using a blue-to- red colormap: the CY CLO metric (fill color) and the CAST metric (frame color). Here, f 1 stands out as having both the body and frame in red, i.e. being both complex and having many casts2 . Using the metric view, we also see that the function having the most casts, f 2 (located in file A), is also highly complex (high CY CLO), but is barely commented (low CLOC). This may point to a redocumentation need. In the second example, we examine a legacy C commercial system of several hundreds of files and approximately 500 KLOC. Its designers suspected C-cast problems creating portability issues when going from a 32-bit to a 64-bit platform. To check this, we selected all functions and computed their number of C casts (CAST ) and #defines (DEF ). The metric view helped us detect a strikingly strong correlation of the two metrics (Fig. 6 top-right). Upon closer examination in the code view, we found that virtually all casts occur in #defines, which are further centralized in a few headers. This is a lucky case, as the designers can remove the dangerous casts easily and in one place just by editing those #defines. In the third example, we examine the modularity of a C++ UML editor [Telea et al. 2008b]. We first extract the class inheritance and association (method calls) relationships using a query, and compute 2 We
recommend viewing this paper in full color
the LOC, CLOC, and CY CLO metrics for all methods. Next, we use the UML view to display a class diagram of the system (Fig. 6 bottom-right). The inheritance relations are drawn in opaque black, whereas the associations are drawn with 50% transparency, thereby de-cluttering the view. As a novel feature, we use a 3column metric view within each class to display its three metrics (LOC, CY CLO, CLOC from left-to-right) for its methods. We next sort all metric views on the CLOC metric. We immediately see that the class in the system having the most methods, marked X in Fig. 6 bottom-right, also has the largest methods (warm-colored LOC bars) and most complex methods (longest CY CLO bars). But this is also the class with the most comments (longest CLOC bars). All these indicate that X is a so-called ”God class” [Lanza and Marinescu 2006]. The system designer confirmed afterwards our suspicion: this was indeed the most complex class in the system containing the intricate editors rendering code. In the last example, we are interested to locate the complexity hotspots of the same UML editor as discussed in the previous example. We visualize the architecture as an UML diagram (see Fig. 7) extracted directly from the system’s C++ source code. The UML diagram shows several subsystems of our editor: the data model (storing UML diagrams), the visualization core (containing core rendering code), the visualization plug-in (containing optional rendering
code), and the STL classes used for implementation purposes. The individual subsystems are identified by hand and visualized using smooth textured contours, as described in [Byelas and Telea 2006]. Next, we compute a number of software metrics (McCabe’s complexity, lines-of-code, lines-of-comments) using S OLID FXon the methods of the examined code base. Finally, we visualize the code metrics directly on the UML diagram, using the adapted table-lens technique, as shown earlier in Fig. 6 bottom-right: For each class, the rows of its table correspond to its methods, while the table columns correspond to the metrics computed for that class. In the case of the example show here, these are the lines-of-code (LOC) and cyclomatic complexity (CY CLO), sorted on decreasing complexity. The height of each class is proportional to its method count. Just as for the metric view discussed before, coloring and sorting the metrics on various criteria emphasizes potentially interesting outliers and correlations. Using this visualization, Figure 7 quickly lets us locate one class (marked X in the figure) which has more methods, and is significantly more complex, than the rest. This class would typically pose important maintenance problems to a system. However, by looking at the general UML diagram organization, we notice that class X is not part of the important subsystems (core, data model) but part of the optional plug-in code. And indeed, the developer of this system confirmed us that the plug-in code is much less stable and clean, thus less maintainable, than the rest.
4.3
External Tool Integration
S OLID FX supports two types of tool integration. First, we provide an open AST and query API (written in C++) to our proprietary fact-database format, so developers can write plug-ins for our IRE. This is how we integrated the table-lens view. Second, we provide exporters the fact database to formats such as XML (for the AST), XMI (for UML diagrams), SQL (for metrics), and Dot and VCG (for general graphs). For example, the inset in Fig. 5 shows a C++ system call-graph, drawn by the hierarchical edge-bundling tool of Holten [Holten 2006], connected via a data exporter, as opposed to the tighter integration via our own API, done for the table-lens. This view shows the strong communication between two halves of the analyzed system (thick edge bundle in the middle). The edge bundling visualization tool was integrated via a data exporter, and not the finer-grained API, since we did not avail of this visualization tool’s code, but only of the binary executable.
5
Evaluation
We now detail on the performance and usability of our presented IRE.
5.1
Performance
We benchmarked S OLID FX on several code bases of hundreds of files and millions of LOC, and compared it with C OLUMBUS, one of the most prominent heavyweight C++ extractors in existence. We ran both tools on a 2.8 GHz PC with 1024 MB RAM. For pure C, we used Quake 3 Arena [Id Software 2006] and Blender [Blender Org. 2006]. C code tends to use less (or smaller) standard headers than C++, but more macros. For C++, we used VTK [Kitware, Inc. 2006], Coin3D [Systems in Motion 2006], wxWidgets [Smart et al. 2005] and S OLID FX. VTK and Coin3D are complex 3D graphics libraries written in portable C++, with few templates or exceptions. wxWidgets uses precompiled headers and exceptions. S OLID FX, our own tool, massively uses STL, Boost, and exceptions. For mixed C and C++, we used Mozilla [Mozilla Corp. 2006], which
has about 2.5 MLOC without headers and 205 MLOC with headers3 . The considered code bases are a mix of libraries and applications using varying coding patterns, all straining extractors in different ways.
Figure 8: Projects used for benchmarking Figure 8 details the tested code bases. We count LOCs after header inclusion, before macro expansion, and excluding comments. All needed headers were available, except for Mozilla, which missed some headers included by test applications. We extracted using a Visual C++ 7 profile. Figure 9 shows the performance of S OLID FX compared to C OLUMBUS. For both tools, we filter out facts from the system headers. We notice several facts. First, S OLID FX is, on the average, several times faster than C OLUMBUS, while outputting at least as much data as the latter. However, S OLID FXs output is more than one order of magnitude larger than that of C OLUM BUS . We believe this is due to the very fine-grained location data, saved for every parsed token, our potentially less optimal storage design, and possibly the fact that we do not use preccompiled headers (PCHs). The throughput of S OLID FX (input LOC parsed/second) highly varies over projects, due to different code density, line length, and complexity. We count lines before macro expansion, so code with many macros which expand to large fragments, e.g. the E LSA parser within S OLID FX, have a roughly three times lower throughput than any other C++ project considered. Filtering system headers from the output can reduce the amount of code with as much as 50%, thereby roughly doubling the parsing speed, as for S OLID FX which heavily uses Boost, STL, and Standard C++ (Table 2). For an extensive performance analysis, see further [Boerboom and Janssen 2006]. We stress the aim of our comparison was not to conclude that our tool surpasses C OLUMBUS in all respects, but to show that, with several design decisions (Secs. 3.1-3.5), one can build a robust tool able to analyze industry-scale, complex, C++ code in times competitive with professional extractors, starting mainly from open-source components. One might argue that, from a visualization perspective, displaying the number of casts, defines, and (comment) lines-of-code of a code base using some table lens and SeeSoft-like views are not such challenging tasks. Two comments are important here. First, it is precisely the simplicity and tight integration of such views with the queries, that makes our solution highly usable and easy to learn. 3 The raw performance of any parser should be evaluated against the code size after preprocessing
STL classes
visualization plug-in
visualization core
data model
class X
LOC CYCLO
most complex method (CYCLO=40)
complex implementation class X
Figure 7: Correlating metrics and structure to locate complexity hot-spots
5.2
Figure 9: Performance comparison of S OLID FX and C OLUMBUS
Second, we are not aware of a similar solution that offers comparable functionality, although reverse-engineering and visualization tools have a long history. We believe that the reason for this apparent contradiction is that designing such a solution is far from trivial, even if its ingredients (parser, view, queries) are known in principle. The main purpose of this paper (and the above included application examples) is to clarify as much as possible the challenges (and solutions) of such a design, and show what can be achieved with it for the end user.
User Experience
We have used our IRE for undersanding and reverse-engineering open-source code (see Sec. 5.1) but also several MLOC-size commercial embedded and database software systems. The eight users involved ranged from undergraduate students to professional developers with over 10 years of industrial experience. All were experienced in C and/or C++, and worked before with at least another C or C++ fact extractor. For the same tasks, we previously used the same parser and view tools, but not integrated as an environment. For the parsing phase, the IRE was not much more effective - a simple text makefile-like project was sufficient. However, for the exploration phase, the IRE and its tight tool integration were massively more productive than using the same tools standalone, connected by little scripts and data files. Reverse-engineering and maintainability and quality assessment scenarios are by nature iterative and exploratory, so they map perfectly to repeated selection, query, and interactive visualization operations. Our users often asked if we could provide the functionality shown here with Eclipse and/or other C++ extractors, besides ours. Integrating our S OLID FX extractor in Eclipse should be relatively simple. Yet, integrating all views shown here will be very complex, as they use advanced OpenGL graphics features unsupported in Eclipse. Using other C++ extractors is also problematic, as few pro-
vide the fine-grained, efficient, comprehensive fact-querying API needed to give the support level described here. Actually, the only environment we know which could provide similar functions is Visual Studio 2005, which recently started opening its compilers low-level APIs for tool builders. CDT, an open C/C++ development toolkit for Eclipse, is also a promising effort which resembles S OLID FX, albeit in a much earlier consolidation stage [CDT Team 2007].
6
Conclusions
We have presented S OLID FX, an integrated program understanding and reverse-engineering environment (IRE) for C and C++ built by combining a tolerant heavyweight parser, an open query API, and several visualization tools in a coordinated framework. Our IRE promotes the same way of working in reverse engineering as in classical forward-engineering IDEs, thereby making reverse engineering activities fast and easy to learn and perform by end users. We are currently working on several extensions for S OLID FX. First, we envisage merging the so far distinct UML and code views in a single, novel way capable of showing both the detailed source code and its various types relations (calls, inheritance, use, definition, etc). Second, we work on providing a simple and intuitive visual way for constructing complex queries for less specialized users, thereby making our environment more accessible.
References AT & T. 2007. GraphViz. www.graphviz.org. BAXTER , I., P IDGEON , C., AND M EHLICH , M. 2004. DMS: Program transformations for practical scalable software evolution. In Proc. ICSE, 625–634.
I D S OFTWARE, 2006. Quake 3 arena 1.31b. ftp.idsoftware. com. K ARLSSON , B. 2005. Beyond the C++ Standard Library - An Introduction to Boost. Addison-Wesley Professional. see also www.boost.org. K ITWARE , I NC ., 2006. kitware.com.
The visualization toolkit 4.2.
www.
K NAPEN , G., L AGU E¨ , B., DAGENAIS , M., AND M ERLO , E. 1999. Parsing C++ despite missing declarations. In Proc. IWPC, 114–122. L ANZA , M., AND M ARINESCU , R. 2006. Object-Oriented Metrics in Practice - Using Software Metrics to Characterize, Evaluate, and Improve the Design of Object-Oriented Systems. Springer. L ANZA , M. 2004. CodeCrawler - polymetric views in action. In Proc. ASE, 394–395. L EMKE , I., AND S ANDER , G., 1994. VCG: visualization of compiler graphs. Tech. Report, Univ. des Saarlandes, Saarbr¨ucken, Germany. L IN , Y., H OLT, R. C., AND M ALTON , A. J. 2003. Completeness of a fact extractor. In Proc. WCRE, 196–204. L OMMERSE , G., N OSSIN , F., VOINEA , L., AND T ELEA , A. 2005. The visual code navigator: An interactive toolset for source code investigation. In Proc. InfoVis, 24–31. M C P EAK , S. Elkhound: A fast, practical glr parser generator. Computer Science Division, Univ. of California, Berkeley. Tech. report UCB/CSD-2-1214, Dec. 2002. M C P EAK , S., 2006. The Elsa C++ parser. www.cs.berkeley. edu/\˜smcpeak/elkhound/sources/elsa.
B ISCHOFBERGER , W. 1992. Sniff+: A pragmatic approach to a C++ programming environment. In Proc. USENIX C++ Conference, 67–81.
M OZILLA C ORP., 2006. Mozilla firefox 1.5. ftp.mozilla. org.
B LENDER O RG ., 2006. Blender 2.37a. www.blender3d.org.
PARR , T., AND Q UONG , R. 1995. ANTLR: A predicated-LL(k) parser generator. Software - Practice and Experience 25, 7, 789– 810.
B OERBOOM , F., AND JANSSEN , A. 2006. Fact extraction, querying and visualization of large C++ code bases. MSc thesis, Faculty of Math. and Computer Science, Eindhoven Univ. of Technology. B URKE , M. G., AND F ISHER , G. A. 1987. A practical method for LR and LL syntactic error diagnosis and recovery. ACM Trans. Prog. Lang. Sys. 9, 2, 164–167. B YELAS , H., AND T ELEA , A. 2006. Visualization of areas of interest in software architecture diagrams. In Proc. SoftVis, ACM Press, 20–28. CDT T EAM. 2007. C/C++ development toolkit. www.eclipse. org/cdt. C OLLARD , M. L., K AGDI , H. H., AND M ALETIC , J. I. 2003. An XML-based lightweight C++ fact extractor. In Proc. IWPC, IEEE Press, 134–143. E ICK , S., S TEFFEN , J., AND S UMNER , E. 1992. Seesoft - a tool for visualizing line oriented software statistics. IEEE Trans. Soft. Eng. 18, 11, 957–968. ´ , T. 2004. Extracting F ERENC , R., S IKET, I., , AND G YIM OTHY facts from open source software. In Proc. ICSM. H OLTEN , D. 2006. Hierarchical edge bundles: Visualization of adjacency relations in hierarchical data. In Proc. InfoVis, 741– 748.
S MART, J., H OCK , K., AND C SOMOR , S. 2005. Cross-Platform GUI Programming with wxWidgets. Prentice Hall. S TALLMAN , R., for gcc 4.2.
AND
W EINBERG , Z., 2006. The C preprocessor
¨ S TOREY, M. A., W ONG , K., AND M ULLER , H. A. 2000. How do program understanding tools affect how programmers understand programs? Science of Computer Programming 36, 2, 183207. S YSTEMS IN M OTION, 2006. Coin3d 2.4.4. www.coin3d.org. T ELEA , A., B YELAS , H., AND VOINEA , L. 2008. A framework for reverse engineering large C++ code bases. In Proc. SQM’08, Springer ENTCS. to appear. T ELEA , A., T ERMEER , M., L ANGE , C., AND B YELAS , H. 2008. AreaView: An editor combining uml diagrams and metrics. In www.win.tue.nl/˜alext/ARCHIVIEW . T ELEA , A. 2006. Combining extended table lens and treemap techniques for visualizing tabular data. In Proc. EuroVis, 5158. B RAND , M., K LINT, P., AND V ERHOEF, C. 1997. Reengineering needs generic programming language technology. ACM SIGPLAN Notices 32, 2, 54–61.
VAN DEN