Jul 21, 2011 - that the tool's usability and performance were satisfactory. Outcomes from the user testing have resulted in a number of concrete ..... Browsing.
© 2011 IEEE. Personal use of this material is permitted. However, permission to reprint/republish this material for advertising or promotional purposes or for creating new collective works for resale or redistribution to servers or lists, or to reuse any copyrighted component of this work in other works must be obtained from the IEEE. DOI Bookmark: http://doi.ieeecomputersociety.org/
An Interactive Web-based Visualization Tool in Action: User Testing and Usability Aspects Bahtijar Vogel, Arianit Kurti, Marcelo Milrad, and Andreas Kerren School of Computer Science, Physics and Mathematics Linnaeus University, Växjö, Sweden {bahtijar.vogel, arianit.kurti, marcelo.milrad, andreas.kerren}@lnu.se
Abstract—In this paper, we present our efforts in relation to the evaluation of an interactive web-based visualization tool developed for supporting environmental sciences learning. The tool enables the visualization of different types of geo-tagged content and sensor data collected using mobile devices. It also utilizes APIs that provide multiple visual representations of the data set. These representations allow users to actively interact with graphs, maps, images, and data tables. In order to test the usability, novelty and interactivity of our web-based visualization tool, we have conducted a study involving university students in the field of teaching environmental sciences. The results and analysis of the user testing indicate that the tool’s usability and performance were satisfactory. Outcomes from the user testing have resulted in a number of concrete suggestions for further enhancement and improvements of our visualization tool in relation to application functionality, navigation and interaction. Keywords: Usability evaluation, user testing, web-based visualization, geo-tagged data.
I.
INTRODUCTION
Visualizing data interactively through the use of different dynamic presentations that rely on graphs, charts, maps and other techniques is often a powerful way to make sense from a vast amount of gathered data [1]. In recent years, several initiatives have been carried out in relation to the use of web technologies to visualize geo-temporal data [2], [3], [4], [5]. In line with these developments, the efforts related to the design and implementation of our web-based visualization tool have been motivated by the following: 1) Geospatial web and digital maps services combined with web-based visualization techniques and Web APIs [6] 2) Cloud computing, the “applications delivered as services over the Internet” [7] 3) Web-based cyclic development using prototyping approaches for enabling us to validate and to test the different versions of the tool based on users’ feedback [8] and 4) Technology-Enhanced Learning as the field of exploration and testing of our web-based visualization tool. As a result of our research efforts, we have developed three prototypes of a web-based visualization tool. This tool was developed making use of Google Cloud Services to process and visualize geo-temporal data. Its features were carried out in three different iterations following the requirements engineering cycle (see also: Vogel [9]). The
specific domain in which these efforts were applied is the field of environmental science learning. The need for allowing users to explore, analyze and reflect on different representations of environmental data in an interactive manner indicates the importance of web-based visualization tools in this domain. The usability evaluation of web-based applications has gained increasing attention in the web engineering community [10]. Usability evaluation is used to test the features of a web-based application and to verify the fulfillments of user requirements [10]. The latest (third) prototype of the visualization tool enables to visualize, analyze and explore different types of geo-tagged content and sensor data collected using mobile devices. In order to address the needs for further improvements of our current prototype, we conducted a user testing of our web-based visualization tool. II.
THE PROTOTYPE
The prototype of our web-based visualization tool was developed as a part of the ongoing research project “Learning Ecology through Science with Global Outcomes (LETS GO)” [9]. In this project, students are using sensor and mobile devices for data collection in the field and the web-based visualization tool for data visualization in the classroom. Students create geo-tagged content and collect data related to water quality, measuring and collecting values, such as pH, dissolved oxygen, temperature, and conductivity. The web-based visualization tool we have developed utilizes a number of Google Visualization APIs, and it is implemented using AJAX/JavaScript. From a technical perspective, we have relied on Google Cloud Services for our implementation. This approach supports visualizations over the web allowing the access of structured data sets and visualizing them easily with any compliant data sources. Our prototype uses multiple representations, for instance, graphs, maps, data tables, charts and similar. These visual representations are embedded within the same prototype and can be accessed interactively. Three core libraries of Google Visualization API are included and loaded into the tool. The data is queried from spreadsheets in the remote server in order to visualize them. After loading libraries and querying the data, the chosen visual representations (e.g., scatterplot, line chart etc.) are instantiated and rendered. The tool also supports several filtering mechanisms for visualizing data
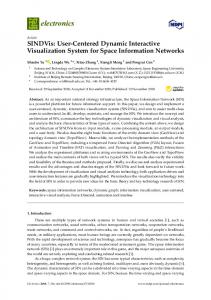
according to date, group and attribute type (kind of sensor data). The data represented in the table format supports sorting of the values in ascending or descending manner. The screen shot of the web-based visualization tool is provided in Figure 1.
Figure 1. The screen shot of the web-based visualization tool.
III.
RELATED WORK
Recently, there have been a number of efforts related to visualizing geo-tagged and sensor data using web-based technologies. Rodrigues and Rodrigues [2] have developed a visualization tool that makes use of maps APIs and Web 2.0 technologies to support asynchronous spatial collaboration between physically distributed users. In another project, GeoJunction [3], the authors propose a web-based geovisualization tool for exploring geo-temporal data related to public health. The need for supporting collaboration using these technologies has been emphasized by MacEachren and Brewer [4] and their framework for visually enabled geocollaboration. Throughout these projects, there is a need for conducting usability testing in order to validate novel concepts and ideas that involve the visualization of geotemporal data sets. Slocum et al. [5] and Nöllenburg [11] suggest that applying usability evaluation to geovisualization tools and applications throughout the whole development process still remains challenging. Furthermore, the authors provide an overview of general challenges related to usability testing of geovisualization tools. Therefore, one important aspects in this field deals with identifying proper ways for conducting user testing of web-based visualization tools that represent geo-temporal data. There are several approaches that deal with user testing and usability of web-based applications and prototypes evaluation. Fernandez et al. [12] have addressed aspects related to web usability evaluation. In a study they conducted, they present how the usability evaluation of the
final user interface can provide feedback for improving usability problems/issues. One of the main results of their efforts is that usability concerns should be taken into account in the process of web development. This latest issue has been addressed also by the work of Shneiderman [13] and Preece [14]. They suggest that usability testing could be used in order to reduce the efforts at the maintenance stages of the web-based applications. The studies presented above have defined several specific goals that concern usability evaluation as point out in [10], [12], and [15]. The main aspects that have been identified throughout these efforts and that are relevant for our user testing study are listed below: • Application functionality, • Navigation (easy to retrieve and easy to browse contents), • Interaction mechanisms and satisfaction of the users that use the web application The aspects identified above play an important role guiding the overall process of user testing and development of our web based visualization tool. Therefore, the main concern that guided this study could be formulated as follows: To verify and understand if the design and development of our web-based visualization tool fulfills the user requirements in relation to application functionality, navigation and interactivity for supporting environmental science learning. In order to validate usability aspects related to our prototype, we have conducted a user testing study that will be introduced next. IV.
USABILITY STUDY
One of the main objectives of our study is to identify usability issues related to the web-based visualization tool we have developed and implemented. The data collection techniques used in this study includes observations, tasks and questionnaires, analysis of screen capturing, and follow-up interviews. According to [15], the process of conducting a usability study includes a complementary approach that combines heuristic evaluation and user testing methods. A heuristic evaluation approach has been used during the three cycles of prototyping process of our web-based visualization tool as mentioned earlier, where we performed a systematic inspection of a user interface (see also Vogel [9]). This activity is illustrated in Figure 2 where heuristic evaluation represents the first step of the cyclic evaluation process. However, in this study we focus only on the user testing approach that represents the second phase of the evaluation process as suggested by [15]. Throughout this user testing, we have closely followed the cyclic evaluation process of a web-based visualization tool as described in Figure 2. Inspired by the work of Harms and Schweibenz [15], we have modified and extended this cyclic process by including screen capturing and follow-up interviews as additional techniques for collecting data that may help to further identify usability issues. Developing materials for the user testing follows the second evaluation process in our study that includes tasks and questionnaires, analysis of screen capturing, and follow-
up interviews. The data gathered from the user testing is analyzed, and the suggestions for the rebuilt of the tool are introduced. This is an iterative cycle that continues towards the next version of the tool. For developing materials and conducting the user testing, a mixed method using quantitative and qualitative analysis has been employed. Quantitative data gathered from questionnaires and tasks have been analyzed using descriptive statistics. The questionnaires were developed using a five points Likert scale (1 = Strongly Disagree; 2 = Disagree; 3 = Neutral; 4 = Agree; 5= Strongly Agree). These values represent the subjective satisfaction of the users with regard to the web-based visualization tool and its functionalities. For gaining in depth insights in these usability issues, we also performed a qualitative analysis of screen capturing and follow-up interviews.
activities while performing the tasks. Participants spent approximately 30 minutes for performing all tasks. Additionally, students spent another 30 minutes answering questionnaires. After the initial analysis of the questionnaire and in order to increase the reliability of our results, we have performed analysis of the screen recording and conducted follow-up interviews with the participants. The follow-up interviews started a couple of days after the user testing. TABLE I.
Description 1 2 3 4
5 6 7
8
Figure 2. The cyclic evaluation process of a web-based visualization tool based on [15].
9
A. Participants, Tasks and Settings We have conducted a study involving university students in the field of learning environmental sciences that used the web-based visualization tool. Eighteen participants took part in our user testing. Participants were undergraduate students (teacher students); some of them already with teaching experience in K-12 schools. They comprised a group that varied in ages from twenty up to forty-three years old; eleven of them were females and seven males. Previous to performing the user testing, participants have been involved in a series of learning activities related to the topic of water quality. Activities included an introduction lecture (in the classroom) to the topic followed by a hand on session (in the lab) and a field study in which the students measure water quality and collected sensor data using mobile devices. In order to carry out the user testing, we developed ten specific tasks presented in Table I. They have been developed in order to identify the aspects related to usability issues of the tool. More specifically, the tasks helped us to assess the tools functionality, navigation and interactivity, and the user requirements derived from our earlier developments. Each task had its own timestamp marked with start and end time. To enrich the quality of our data, we used a screen capture application on each computer to save the users’
THE TASKS
10
Show (using the filtering panel) the data collected from your group in the table view format. Identify and browse the pictures taken by your group Using the filtering panel, view the data collected from your group and another one beside yours. In the front panel view, use the following icon to change the visualization type from table to column chart and then to line chart view. Identify the conductivity values collected by your group only using Attributes in the filtering panel view. Then, present these values using the column chart view. Plot the values of dissolved oxygen and pH for all groups in the scatter plot view. Locate the points where your data has been collected using the zooming feature in the map view. Show only the data collected by your group in the table view. With the mouse, point to the first row and look at that point in the map. Repeat this task for the third sample that was taken. Using the column chart or the scatter plot view, place the mouse over the graphs and then obtain at least 4 individual values from 4 different attributes. Open a new tab in your browser, go to the following URL: http://xyz.com and type those values corresponding to your group Find all the locations where pH was higher than “6.5”. After you found the locations, go to http://xyz.com (same form as in Task 9) and type which of the samples (first, second or third, all or none of them) you took was the highest, and then press the submit button.
B. Data Analysis and Results The questionnaire was comprised of seventeen questions. Thirteen questions were related to the tasks performed by the students, while the last four questions were related to the overall rating of the tool. In order to gain better insights from the results of the different tasks, some of them have been covered by more than one question. Based on the collected data (responses to the questions, time to finish each task, number of occurrences of answers), we analyzed the subjective ratings of the collected data using descriptive statistics by getting the mean, standard deviation and confidence interval. To get more reliable results, the desired confidence level was set to 95% for all calculations of the confidence interval. Figure 3 represents the overall results from the questionnaire. The bar chart presents the mean for each task as answered from the participants, and the error bars present the standard deviation for each task. The results
suggest that the overall mean derived from all tasks is 4.2 with an overall standard deviation of 0.721. The overall confidence interval was ± 0.33 and the range for true population mean falls overall from 3.87 to 4.53.
Figure 3. Questionnaire/tasks results
Although the overall results show a high level of satisfaction from the users, we have identified, especially from Tasks 9 and 10, that there were usability issues/problems. The purpose of these two tasks was to perform activities that include finding, navigating, analyzing and annotating data. In this regard, participants were required to obtain individual values using the visualization tool and afterwards to annotate this data (take notes). In these two particular tasks, we got the highest standard deviation values from questionnaires. To further investigate the reasons behind the higher standard deviation values with regard to tasks 9 and 10, beside the questionnaires, we made cross-reference analyses relating the number of occurrences for answers, the timing required for accomplishing the tasks and the calculation of confidence interval for each question. These results are presented in Table II below and indicate that the number of occurrences for ‘strongly agree’ and ‘agree’ was relatively high. In particular, Table II presents the number of occurrences for each one of the answers, the approximate Time (≈) to accomplish a task and the confidence interval. TABLE II. Task Question T1 - Q1 T2 - Q2 T3 - Q3 Q4 T4 - Q5 Q6 T5 - Q7 T6 - Q8 Q9 T7 - Q10 T8 - Q11 T9 - Q12 T10 -Q13 Total
The sign “/” in this table represents that none of the participants answered, and “0” means less than a minute. There is a difference on the time spent between Tasks 9 and 10 in comparison with the others. The total time spent in Task 9 for all participants was 92 minutes with an average time of 4 minutes per participant. The total time spent for Task 10 was 80 minutes, with an average time of 3 minutes per participant. Other tasks were performed on average in one minute or less time. Furthermore, the confidence interval for Task 9 was ± 0.48 with the range for true population mean from 3.52 to 4.48. This interval was ±0.42 for Task 10 with the range for true population mean from 3.47 to 4.31. These results clearly indicate usability issues of the tool related to the aspects of interactivity, navigation and orientation. Furthermore, they gave us an indication that there is a need to further analyzing the data in order to get a better understanding of the results that emerged during the user testing. Therefore, we followed up with the analysis of the screen recordings captured during the user testing study, and follow-up interviews, with a reason to further strengthen the results and analysis of our study. C. Screen Recording Analysis Screen recordings have been analyzed using a qualitative approach that focused on the identification of critical incidents. As an initial screen recording analysis, we have selected a couple of these recordings. Moreover, we identified slightly different answers/results during the screen recording data analysis than those from the questionnaires. This approach helped us to obtain and to specify the difficulties with regard to particular tasks users may have. The initial analysis of the screen recordings helped us to identify problems related to navigation, functionality, interaction and orientation within the tool. These problems are listed below. • Students had difficulties using the filtering panel. • User found difficult to understand whether they needed to tick the checkboxes in order to compare the data between different groups. • The picture loading functionality was unclear.
OVERIVEW OF THE COLLECTED DATA.
Number of occurrences for each answer Strongly Dissagree Neutral Agree Dissagree / / 2 7 / 9 / / 9 / / 2 10 / / 2 8 / / 2 11 / / 1 7 / / 6 12 / 1 2 7 / / 8 5 / / / 6 / / 1 6 / 2 3 7 / 1 5 / 4 34 104
Strongly Agree 9 9 7 6 8 6 5 3 3 13 11 7 5 92
Time Average Total ≈ ≈ 0 5 9 0 1
17
0 1
6 26
1 1 1 4 3
23 15 21 92 80
Confidence level 95% Confidence Range for true Interval ± population mean 0.32 4.07 to 4.71 0.24 4.26 to 4.74 0.31 3.97 to 4.59 0.3 3.92 to 4.52 0.32 4.01 to 4.65 0.26 4.02 to 4.54 0.37 3.57 to 4.31 0.34 3.6 to 4.28 0.35 3.37 to 4.07 0.21 4.51 to 4.93 0.29 4.27 to 4.85 0.48 3.52 to 4.48 0.42 3.47 to 4.31 N/A
• • • • • •
It was difficult to find specific values in the data sets. It was very difficult for them to switch to another tab on the web browser and to write down the notes. Students had difficulties in finding the icons for changing the different type of visualizations. Finding the pictures related to each group was unclear. It was unclear how to obtain individual values from visual representations, such as scatter plot, bar chart or line chart. Students had difficulties on how to point to the table view and retrieve the data on the maps.
D. Follow-up Interviews In order to get deeper insights beyond those issues identified in the previous section we also performed followup interviews. It is important to mention that some of the answers received during the interviews were slightly different from those we received from the questionnaire. The follow-up interviews allowed us to further clarify the results in general and helped us to get complementary information in relation to what the screen capture analysis showed. Although the interviews were conducted with a selected number of participants, we gained valuable information that helped us to improve our understanding with regard to potential problems with the tool. Those participants that finished the tasks fastest and those that finished slowest were selected for interviews. The outcomes from the follow-up interviews provided us with additional insights to supplement the other information sources we had. A number of issues and suggestions for improvement have been identified and they are listed below: • Tasks that were related to data comparison between different groups using the filtering panel were difficult. • Some users indicated that they did not actually use the checkbox at all for performing the filtering. • Finding the pictures with the correspondent groups in the content view panel was considered not an easy task. • For some of the students, changing the visualization forms from one presentation to another was difficult (e.g., from table view to bar chart or line chart). • On the map, the marker should include more information. For instance, pictures can be embedded on it implying that each location can have a starting point marked as Test 1 or Sample 1. • Tasks 9 and 10 were difficult specifically for the note taking (annotation). • The tool should support other languages in addition to English, so that it is easier to understand which concepts and terms are used. • The tool should have a free text searching mechanism. Overall, users reported that some tasks were easy to accomplish (mainly those related to navigation and identifying information), while some of them were very difficult to perform (especially those that required exploring, analyzing and reflecting on different representations of the data sets, as for Tasks 9 and 10). However, in general the students reported that using the tool helped them to visualize
the data they collected in the field in novel ways. Overall, the students believed on the benefits of using this kind of visualization as a tool for supporting learning in the subject of study in this particular domain. V.
DISCUSSION AND LESSONS LEARNED
Based on the analysis of the data we collected two important aspects have been identified: 1) Users found the tool consistent and satisfactory for achieving their needs related to environmental sciences; 2) While performing relatively complex tasks, users identified a number of difficulties related to usability issues. The results indicated that overall there was a high level of satisfaction with the tool (mean 4.2, stdev 0.721, and confidence interval ±0.33 with the range for true population mean from 3.87 to 4.53). Statistical results, especially those related to Tasks 9 and 10 pointed out some issues related to the usability of our tool. Data gathered from the screen capturing and follow up interviews strengthened these results and suggested that there were some problems while changing different visualizations, obtaining individual values, annotating the data, and loading the pictures. More specifically, we have identified that the lack of note taking/annotation functionality clearly affected the usability of the tool (as indicated for Tasks 9 and 10). The results of the questionnaires, screen recordings and follow-up interviews indicated that this functionality should be included in the coming version of the tool. The use of multiple data gathering techniques (questionnaire, screen capturing, and follow-up interviews) has provided clear benefits in terms of identifying usability problems. The combination of these methods provided more reliable interpretation of the data we collected. This mixed approach seems to be beneficial if compared with using only one type of data gathering approach, as we may have faced contradictory results. Such a situation can be clearly identified in some cases in which the answers of the questionnaires did not correspond with the actual experience of the users while using the tool (screen recordings and follow-up interviews). TABLE III.
SUGGESTIONS FOR REBUILT
Suggestions
Functionalities Rationale
Description
Application functionality
Search Note taking or annotation
Free text search functionality. Seamlessly integrated and implemented note taking mechanism. More visible filtering panel with improved filtering options. Improve pictures loading and filtering. Better visibility and style of the icons.
Navigation
Interaction
Filtering panel Checkboxes Pictures Changing visualizations Orientation or Browsing
More compact design.
The primary aim of this user testing was to validate different aspects of our web-based visualization tool in order to get suggestions for its further enhancement. These suggestions resulted from the compilation of the overall analysis of the collected data. Table III illustrates and categorizes the different results in relation to concrete recommendations for further enhancement of the tool. VI.
CONCLUSIONS AND FUTURE WORK
Our experience with this user testing study was valuable in terms of identifying usability issues connected to our application. The outcomes of our results indicate that the current version of our web-based visualization tool meets the basic needs of the users in order to perform specific tasks and activities in the field of environmental sciences. However, as the results indicate not all aspects of application functionality, navigational and interaction of our prototype application are satisfactory. On the other hand, from the description of the tasks and the data represented in Table II, it could be noticed that there is a linear dependency between the complexity of the task, the functionality provided by the tool and the results gained from the questionnaire. In particular, these issues were evident in Tasks 9 and 10, where it was required to explore, search, retrieve and annotate different content and sensor data using multiple representations. The overall analysis for these two tasks (standard deviation, number of occurrences, time completion and confidence interval) provides a strong indication, which affected the usability of our tool. The overall analysis of the data we collected (tasks and questionnaires, analysis of screen capturing, and follow-up interviews) indicates that participants experienced the web-based visualization tool as easy to use, with an overall high level of satisfaction. Users provided also valuable and constructive feedback in relation to further enhancements of the tool, which will serve as concrete suggestions for the rebuilt of the tool. One of the most salient points was that the tool does not directly support yet collaborative tasks, especially those that include note taking and annotations. From a methodological perspective, we also consider that the process of prototyping and usability evaluation should be combined in an iterative manner in order to provide a better ways for including potential suggestions for improving already during the prototyping process. Furthermore, we consider that the cyclic evaluation process seems to be a suitable approach for conducting user testing studies of webbased visualization tools. This may be a possible answer to the usability challenges in this field, as we have mentioned earlier in Section II. With regard to the reliability of the results, we consider that a mixed method approach that combines different data gathering techniques including questionnaire, screen recordings and follow-up interviews seems to be a viable strategy to provide complimentary data sources that help us to understand how users interact with the tool. Reflecting upon the lessons learned in this study and the conclusions described above, we plan in our coming efforts
to continue to use the cyclic evaluation process for our future developments. The focus of these efforts will be primarily on developing and implementing new features and functionalities to support collaborative activities. Furthermore, from a development perspective we envision the possibility to create new visualization tools based on web technologies to support synchronous collaboration between physically distributed users in indoors and outdoors settings. REFERENCES [1] [2]
[3]
[4]
[5]
[6]
[7]
[8]
[9]
[10]
[11]
[12]
[13]
[14] [15]
J. Steele, and N. Iliinsky, “Beautiful Visualization: Looking at Data through the Eyes of Experts,” O’Reilly, 2010. R. Rodrigues, and A. Rodrigues, “Spatial operators for collaborative map handling,” Proceedings of the 15th international conference on Groupware: design, implementation, and use, LNCS, pp.303-310, 2009. R. E. Roth, A. Robinson, M. Stryker, A. M. MacEachren, and E. J. Lengerich, E. Koua, “Web-based geovisualization and geocollaboration, Applications to public health,” Joint Statistical Meeting, Invited Session on Web Mapping, Denver, CO, ASA, 2008. A. M. MacEachren, and I. Brewer, “Developing a conceptual framework for visually-enabled geocollaboration.,” International Journal of Geographical Information Science, vol. 18, pp. 1-34, 2004. T. A. Slocum, C. Blok, B. Jiang, A. Koussoulakou, D.R. Montello, S. Fuhrmann, N.R. Hedley, “Cognitive and usability issues in geovisualization,” In: Cartography and Geographic Information Science, vol 28, no. 1, pp. 61-75, 2001. S. Elwood, “Geographic Information Science: new geovisualization technologies – emerging questions and linkages with GIScience research,” Progress in Human Geography, pp. 256–263, 2009. M. Armbrust, A. Fox, R. Griffith, A. D. Joseph, R. Katz, A. Konwinski, G. Lee, D. Patterson, A. Rabkin, I. Stoica, and M. Zaharia, “A View of Cloud Computing,” Communications of the ACM,Vol 53, no 4, pp. 50-58, 2010. Sh. Abou-Zahra, “Web Accesibility Evaluation,” In Harper S, Yesilada Y. Web Accesibility: A Foundation for research. SpringerVerlag London Limited, 2008. B. Vogel, “An Interactive Web-based Visualization Tool: Design and Development Cycles,” Proceedings of the IEEE 35th Annual International Computer Software and Applications Conference Workshops - COMPSACW 2011, Munich, Germany, July 18-21, 2011. S. Casteleyn, F. Daniel, P Dolog, M. Matera, “Engineering Web Applications”, Springer Dordrecht Heidelberg London New York, 2009. M. Nöllenburg, “Geographic Visualization,” In: A. Kerren, A. Ebert, J. Meyer, Eds, Human-Centered Visualization Environments, LNCS Tutorial, Vol. 4417, Springer, pp. 257-294, 2007. A. Fernandez, E. Insfran, S. Abrahão, “Towards a Usability Evaluation Process for Model-Driven Web Development,” International Conference on Software Process and Product Measurement, LNCS, 2007. B. Shneiderman, “Designing the User Interface: Strategies for Effective Human-Computer Interaction,” (3rd). Menlo Park, CA: Addison Wesley, 1998. J. Preece, “Online communities: Designing Usability, Supporting Sociability,” Chichester, England: John Wiley & Sons, 2000. I. Harms, W. Schweibenz, “Usability Engineering Methods for the Web: Results From a Usability Study.” In: Knorz, G., Kuhlen, R. (Hg.): Informationskompetenz – Basiskompetenz in der Informationsgesellschaft. Proceedings des 7. Internationalen Symposiums für Informationswissenschaft,. Konstanz: UVK Verlagsgesellschaft mbH, 2000.