Progress In Electromagnetics Research B, Vol. 39, 355–371, 2012
AN INTERPOLATION METHOD TO CALIBRATE ELECTROMAGNETIC PROBES IN SEMI-ANECHOIC CHAMBERS C. Tremola 1, * , M. Azp´ urua 1 , E. P´ aez 1 , D. Orme˜ no 2 , and 2 A. Rebolledo 1 Instituto
de Ingenier´ıa (FII), Laboratorio de Electromagnetismo Aplicado, Centro de Ingenier´ıa El´ectrica y Sistemas, Caracas, Venezuela 2 Universidad
Cat´olica Andres Bello (UCAB), Escuela de Ingenier´ıa en Telecomunicaciones, Caracas, Venezuela Abstract—Based upon the standard IEEE 1309, a new calibration method for electromagnetic (EM) probes is proposed. The aforementioned method compares the electric field strength measured with the EM probe subject to calibration with the E-field intensity calculated through a linear interpolation of the corrected measurement using a reference EM probe. The corrected measurement results are computed by means of the calibration factors stated in the calibration certificate of the reference EM probe. The conditions and criteria, under which it is possible to calibrate EM probes inside semi-anechoic chambers in the frequency range of 80 MHz to 1 GHz, are presented. The results shows that the calibration method proposed in this paper is characterized by deviations less than 1 dB in almost all the frequencies considered, verifying the reliability of the method. The proposed approach is very useful for registering the measurement drift of EM probes used in EMC testing laboratories. 1. INTRODUCTION Electromagnetic (EM) probes are used in the measurement of EM fields for non-ionizing radiation human exposure assessment and electromagnetic compatibility (EMC) testing, among other applications. In that sense, EM fields measurement results should be assured, and therefore the EM probes must be calibrated [1–4]. Received 26 January 2012, Accepted 18 March 2012, Scheduled 30 March 2012 * Corresponding author: Ciro Tremola (
[email protected]).
356
Tremola et al.
Hence, multiple calibration methods have been developed, which are constantly evolving to meet new demands and to exploit the existing technological infrastructure of the laboratories. The conventional EM probes calibration methods are defined in terms of theoretical and experimental models of EM fields generation [4, 5]. The IEEE 1309 [3] standard for EM probe calibrations does not specify differences between fully anechoic chambers (FAC) and semi-anechoic chambers (SAC). The use of SAC in the intercomparison of EM field measurements [6] has been proposed and show satisfactory results for antenna calibration. Nevertheless, due to multi-path propagation effects, antenna coupling and poor performance of microwave absorbers between 80– 200 MHz is very difficult to predict the E-field distributions in a SAC based upon the theoretical models of propagation and therefore to generate a normalized E-field. Hence, the use of an empirical method to obtain the desired electric field is suggested. It is important, in an EMC laboratory, to count with a reliable and simple method for calibrating EM probes, assuring the quality of the measurement result and traceability of the probes to be calibrated. In this paper, an EM probe calibration method is proposed, in the frequency range from 80 MHz to 1 GHz inside a 3-meter SAC, taking into consideration of the recommendations of IEEE 1309 [3] and other publications [4–11]. The E-field strengths were calibrated at 2, 4, 9 and 20 V/m, and the reference probes used were the Multi Axis Monopole Probe (ETS-Lindgren HI-6105) and the Orthogonal Dipole Probe (ETS-Lindgren HI-6053). The proposed method allows the calibration of both the amplitude and frequency response of the EM probes. The newness of the method is that the reference E-field strength is calculated through a linear interpolation of the corrected E-field intensity measured using a calibrated EM probe, by means of the calibration factors provided in the calibration certificate. This paper is organized as follows. Section 2 describes the theoretical concepts and normative aspects on the subject. Section 3 describes the method, conditions for its valid application and criteria used to configure the calibration setup. Section 4 shows the results of the validation. Section 5 presents the conclusions of the study. 2. CONVENTIONAL METHODS IN THE PROBE CALIBRATION The standard IEEE 1309 [3] provides recommendations that should be taken into consideration to define a calibration method for EM probes (transfer standard, normalized field, standard sensor), as well
Progress In Electromagnetics Research B, Vol. 39, 2012
357
as various calibration magnitudes (amplitude response, frequency response, isotropy, response time, etc.), standard field generation methods (in time and frequency domain), the alignment and assembly of the experimental setup, and the uncertainty estimation budget. Regarding the frequency domain calibration, the use of TEM cells and Anechoic chambers is recommended for the ranges 9 kHz– 200 MHz and 200 MHz–40 GHz, respectively [4, 5]. The measurement of power amplifier harmonics, measurement of Voltage Standing Wave Ratio (VSWR) and condition of plane wave (TEM wave) should be considered according to the standards recommendations. According to standard IEEE 1309 [3], the measurement system required to generate EM fields in the frequency domain consists of RF signal generator, power amplifiers, and power sensors, as shown in Figure 1. With respect to the calibration methods, IEEE 1309 [3] provides three different methods, with no preference to any of them. The first method is identified with the letter “A” and consists in the implementation of a Transfer Standard provided by an accredited calibration laboratories. The Transfer Standard is an EM probe similar to the device subject of calibration, which is used to compare against the measurement results of the out-of-calibration EM probe. Accuracies about ±2 dB to ±3 dB are readily attainable with this method, and improved accuracy is possible if special care is taken. The advantages of this approach are convenience, reliability, and simplicity [3]. The second method, “B”, is the implementation of theoretically calculated electromagnetic field intensity. The probe to be calibrated is placed in the presence of an electromagnetic field of known intensity, and its deviation is obtained from the comparison between
Figure 1. Measurement system for the generation of E-field in the frequency domain inside a Semi-Anechoic Chamber.
358
Tremola et al.
its measurements results and the known field strength. The method “C” compares sensor measurements of a reference standard (primary standard) that contains passive or active electronic components, used to measure and calibrate the electromagnetic field for the calibration of the probe to be calibrated. As a result of the calibration process, all EM probes must be accompanied by a calibration certificate. In the calibration certificate, the calibration factors should be stated at specific frequencies and Efield intensities. In that sense, the calibration factors CF are defined as, Eapplied CF = , (1) Emeasured where Eapplied is the reference E-field strength applied, and Emeasured is the E-field strength measured by the EM probe subject of calibration. For the evaluation of linearity of the EM probe, CF are reported at a same frequency and for different intensities. Conversely, for the evaluation of the frequency response, CF are reported for different frequencies but at the same intensity. It is worth mentioning that the selection of frequencies and intensities is defined according to the criteria of the IEEE [3] and the capabilities of each calibration laboratory. 2.1. Semi-anechoic Chamber (SAC) A test environment that consists of a large area of flat surface, free from EM interferences and obstacles is essential in order to carry out radiated EMC tests and electromagnetic field measurements. This area is defined as Open Area Test Site (OATS) as established by ANSI [12]. In order to meet the ideal open field conditions, the SAC is designed not only to attenuate external electromagnetic disturbances by means of metallic shielding of the enclosure and filtering techniques, but also to minimize the internal reflections through the use of RF absorbers. The validation criteria for the SAC are the E-field uniformity (±6 dB in a mesh of 1.5 m × 1.5 m), Normalize Site Attenuation (NSA) (±4 dB) and Site Voltage Standing Wave Relation (SVSWR) (≤ 6 dB) [12, 13]. The SAC has been used previously for the calibration of EM probes. One of the most important works reported consists in the intercomparison between laboratories in seven European countries through the exchange of several probes using at least three different calibration methods [6]. The results show slight deviations between laboratories, mainly due to the influence of positioning the probe. Another important application in the use of semi-anechoic chamber is the calibration of antennas used for radiated emissions testing [14].
Progress In Electromagnetics Research B, Vol. 39, 2012
359
The method used was the Reference Antenna Method with biconical antennas in the range of 200 MHz to 1 GHz. The results were compared with the manufacturer’s calibration documents. On the other hand, other studies have focused on the design and calibration of sensors using new E-field measurement and calculation methods within semianechoic chambers [15, 16]. Their experimental results showed good agreement with the E-field calculated, confirming that the SAC may be used for these measurements. 3. THE INTERPOLATION METHOD 3.1. Formulation of the Interpolation Method This method is based on the premise that it is possible to empirically establish a linear relationship between the strength of electric field generated within the SAC and the power applied to transmitting antenna. The method consists in the application of a mathematical function of linear interpolation to obtain the antenna input power, Pt , required to generate the E-field desired. Therefore, the empirical direct relationship between the antenna input power and the E-field generated in a particular point (turntable zone) is given by, E = kPt ,
(2)
where k is an empirical numerical factor [V/(m·W)] that represents the slope of the interpolation function, when E and Pt are expressed in units of volts per meter and watts, respectively. Given two points on a line (Pt1 , E1 ) and (Pt2 , E2 ), it is possible to find slope (3) and therefore the equation that defines the value of the E-field, (4). It is important to point out that (4) is valid only when E1 ≤ E ≤ E2 and when E1 and E2 are close to the desired E-field strength. That is, k= then,
µ E=
E2 − E1 Pt2 − Pt1
E2 − E1 , Pt2 − Pt1
(3)
¶ Pt for Pt1 ≤ Pt ≤ Pt2 ,
(4)
On the other hand, Pt is related to the power of the signal generator through the power budget of the RF system (Figure 1), which is given by Pt(dB) = Pg(dB) + G(dB) − L(dB) , (5) where Pg is the signal generator output power, G the gain of the RF system, and L the combined losses of the system (attenuation in the
360
Tremola et al.
cables, connectors, etc.) The subindex (dB) is used to highlight that the magnitudes are expressed in decibels. Equations (4) and (5) are used to calculate the power that must be supplied by the signal generator in order to generate desired electric field strength for the calibration of EM probe. For the improvement of the interpolation results, E1 and E2 are calculated from the correction of the direct measures of E-field strength performed with a calibrated reference EM probe, through (6) q E = (CFx Ex )2 + (CFy Ey )2 + (CFz Ez )2 , (6) where, CFx , CFy , CFz are the calibration factors provided in the calibration certificate, and Ex , Ey , Ez are the EM probe measures in each geometric axis (x, y, z). 3.2. The Calibration Procedure This procedure is described in sequence: (i) Configure the test as shown in Figure 4. (ii) Apply an initial value of power to the signal generator (Pg1 ) in order to generate the first E-field measurement point, Em1 = (Exm1 , Eym1 , Ezm1 ). (iii) The rectangular components Em1 are measured. It is recommended that 0.75Ed ≤ Em1 < Ed , where Ed is the desired reference E-field strength. (iv) Calculate E1 and Pt1 using (6) and (5), respectively. (v) Apply an initial value of power to the signal generator (Pg2 ) in order to generate the second E-field measurement point, Em2 = (Exm2 , Eym2 , Ezm2 ). It is (vi) The rectangular components Em2 are measured. recommended that Ed < Em2 ≤ 1.25Ed . (vii) Calculate E2 and Pt2 using (6) and (5), respectively. (viii) (Pt1 , E1 ) and (Pt2 , E2 ) are used in the linear interpolation function (5). In this way, the transmitting antenna input power required is calculated to obtain the E-field desired. (ix) Calculate and set the required power that must be supplied by the signal generator. Now, the desired E-field strength, Ed , has been set. (x) Proceed to locate the EM probe to be calibrated inside the turnable zone. Record the values of the measured E-field (Em )
Progress In Electromagnetics Research B, Vol. 39, 2012
361
and calculate the calibration factors and the relative deviation, Dev, as follow, ¯ µ ¶¯ ¯ Em ¯¯ ¯ . (7) Dev = ¯20 log Ed ¯ 3.3. Requirements and Conditions In order to validate this method, it is necessary to meet the requirements established in IEEE 1309 [3] and other investigations [4– 11]. • Far-Field Condition: Before placing the transmitting antenna, it is necessary to ensure compliance with the condition of plane wave according to the Fraunhoffer criteria. This is known as the far-field distance, r, [17]: 2D2 r≥ (8) λ where D is the greater length of the antenna, and λ is the wavelength in the frequency of operation. It is advisable to place the antenna at the closest distance possible to comply with this condition, in order to increase the ratio of direct beams to the EM probe to those reflected by the SAC walls. • Antenna Height: In order to reduce the effects of mutual coupling between the antenna and the walls and floor of the SAC, it is recommend to place the antenna at a minimum height of 1.60 m from the floor. The mutual coupling affects the E-field measurements especially when using hybrid antennas of large size [18]. • Use of RF absorbers: The pyramidal RF absorbers are placed upon the ground plane between the antenna and the EM probe. Also, it is recommended to use additional absorbers walls around the turnable zone to reduce undesirable reflections of the EM wave (Figure 4). • Calculating the E-field uniformity: It has been found that the Efield uniformity increases the magnitude of the deviations obtained in E-field measurements [19]. It is recommended to measure the E-field uniformity (F U ) within the effective calibration area. The E-field uniformity was measured in an area of 0.5 m × 0.5 m using (2), located in the turntable zone (Figure 4) at a height of 1.3 m. This area corresponds to the minimum size suitable for an EM probe (HI-6053). The E-field uniformity was measured in the four corners of the mesh comparing the higher with the lower E-field strength measurements results, using (9). Figure 2 shows
362
Tremola et al.
the major variation of E-field uniformity between 80–1000 MHz. This allows predicting the influence of the position of the probe on the measured deviation in each frequency range. ¶ µ Emax − Emin . (9) F U = 20 log Emax • Influence of power amplifiers: It was observed that the power amplifiers have a significant influence on measurement results. The output power transmitted to the antenna decays over time (Figure 3), due to the variation of the gain caused by the rise of the temperature of the circuits [20, 21]. After an exhaustive statistical analysis of the data, outliers were eliminated [22–24], and the normal distribution of the measurement results was guaranteed.
E-Field Uniformity (dB)
2 1.75 1.5 1.25 1 0.75 0.5 0.25 0 80 100
200
300
500
1.000
2.000 3.000
6.000
Frequency (MHz)
Figure 2. Variation of the E-field uniformity in an area of 0.5 m × 0.5 m. E-field Measurement (9 V/m at 300 MHz) 9.24
E-field (V/m)
9.22 9.2 9.18 9.16 9.14
0
10
20
30
40
50
60
70
80
90
100
Time(s)
Figure 3. E-field decay by influence of power amplifiers.
Progress In Electromagnetics Research B, Vol. 39, 2012
363
Figure 4. Calibration setup in a 3-m SAC. In this particular case, it was found that the measurement time should be 2 s or less for a sampling rate of 35 samples/s. • Power Amplifier Harmonics and VSWR: As required by the standard IEEE 1309 [3], the harmonic content of the net power applied shall be at least 30 dB below the fundamental component harmonic for valid CW measurements. This fact was verified at each E-field strength levels (2, 4, 9 and 20 V/m) and in each measurement frequency. 3.4. The Mounting and Alignment of the EM Probe The standard IEEE 1309 [3] establishes the mounting and alignment of the probe in the calibration process. An important relationship has been found between this factor and the deviation of the calibration factors obtained in the calibration process [10]. It is important to keep the probe electronics box away from the incident electromagnetic wave. Different tests have recommended to reproduce the mounting and alignment of the reference probe used by the manufacturer [19]. The Multi Axis Monopole Probe (HI-6105) is placed with each of its axes (x, y, z) parallel to the E-field as shown in Figure 5(a). The Orthogonal Dipole Probe (HI-6053) is aligned with the orthogonal angle as shown in Figure 5(b). The probe to be calibrated must be mounted and aligned in the same manner as the reference probe.
364
Tremola et al.
(a) HI-6105
(b) HI-6053
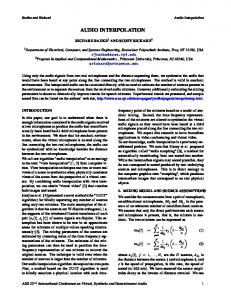
Figure 5. Orientation of the EM probes during calibration for measuring vertically polarized E field. (a) Multiaxis monopole probe, and (b) Orthogonal dipole probe [26]. 3.5. The Antenna According to the recommendations of the standard IEEE 1309 [3], in order to generate a normalized E-field, usually, above 200 MHz, standard antennas, such as open-ended waveguide or pyramidal horn antennas, are used as reference field generation devices [5]. It is possible to cover the whole frequency range using other types of antennas due to the comparative principle of method A (Transfer Standard). The Biconilog Antenna (EMCO 3109) was used for the range from 80 to 200 MHz and the Log Periodic antenna (EMCO 3148) for 200– 1000 MHz. Both antennas were used in vertical polarization in order to reduce the possible effects of coupling with the ground plane of the chamber. Caution is advised regarding the VSWR and mutual coupling in antennas [25]. 4. VALIDATION OF THE METHOD The validation of the method was performed by measuring the deviation in the magnitude of the E-field obtained by linear interpolation on each axis (Ex , Ey , Ez ) using Orthogonal Dipole Probe (HI-6053) and then measuring with the Multiaxis Monopole Probe (HI-6105) and vice versa. Other EM probes were used to verify the measurements (Narda ERM-300/SRM-3000). Nevertheless, those results are not provided here. Tables 1, 2, 3 and 4 show the E-field measured by each probe and the deviation (7) at 2, 4, 9, 20 V/m in the frequency range 80–1000 MHz. For 20 V/m, the band 80–200 MHz was not included because of the high power requirements.
Electric field strength (V/m)
Progress In Electromagnetics Research B, Vol. 39, 2012
365
20
9
4 2 0
100
200
300
400
500
600
700
800
900
1000
Frequency ( MHz)
Figure 6. Frequency response of the EM probes. Note: blue line corresponds to HI-6105 and the red line corresponds to HI-6053. Table 1. Deviation in 2 V/m from 80 MHz–1 GHz. Frequency (MHz)
HI-6105 (V/m)
HI-6053 (V/m)
Dev HI-6105 (dB)
Dev HI-6053 (dB)
80
2.156
2.313
0.652
1.263
100
2.133
2.286
0.559
1.160
200
2.117
2.215
0.494
0.887
300
2.038
1.920
0.163
0.355
400
2.195
2.157
0.808
0.656
500
2.039
2.303
0.168
1.225
600
2.009
2.092
0.038
0.391
700
2.170
1.979
0.709
0.091
800
2.125
2.135
0.527
0.567
900
2.002
1.923
0.008
0.341
1000
2.029
2.131
0.125
0.551
Figure 6 shows the frequency response of the EM probes used. As expected, both EM probes measure E-field intensities close to the interpolated E-field, used as a reference in the calibration process. The frequency response of the probe HI-6053 shows larger deviations when performing measurements at 20 V/m because of the loss of linearity of the E-field probe HI-6053 at several frequencies. This affirmation was verified in the calibration certificate of the HI-6053, since the CF at 20 V/m shows larger deviations from the primary pattern mainly at 400 MHz and 700 MHz. Nevertheless, the relative deviations of the measurements taken with the HI-6053 and with HI-6105 remain below 1 dB and 0.6 dB, respectively, at 4, 9 and 20 V/m.
366
Tremola et al.
Table 2. Deviation in 4 V/m from 80 MHz–1 GHz. Frequency (MHz)
HI-6105 (V/m)
HI-6053 (V/m)
Dev HI-6105 (dB)
Dev HI-6053 (dB)
80
4.089
4.158
0.191
0.336
100
4.037
4.181
0.080
0.384
200
4.040
4.136
0.086
0.290
300
4.034
4.246
0.074
0.518
400
4.095
4.123
0.204
0.220
500
4.032
4.348
0.070
0.725
600
4.249
4.324
0.525
0.677
700
4.104
3.638
0.223
0.824
800
4.066
3.718
0.142
0.635
900
4.155
3.674
0.330
0.738
1000
4.019
3.986
0.041
0.030
Table 3. Deviation in 9 V/m from 80 MHz–1 GHz. Frequency (MHz)
HI-6105 (V/m)
HI-6053 (V/m)
Dev HI-6105 (dB)
Dev HI-6053 (dB)
80
9.053
9.627
0.117
0.585
100
9.017
9.511
0.016
0.480
200
9.167
9.424
0.160
0.400
300
9.621
9.103
0.580
0.099
400
9.120
9.486
0.115
0.457
500
9.096
8.934
0.090
0.064
600
9.032
8.960
0.031
0.039
700
9.024
8.776
0.023
0.219
800
9.363
8.723
0.343
0.272
900
9.315
8.158
0.299
0.852
1000
9.194
8.454
0.185
0.544
When the E-field is interpolated with the HI-6053, the HI-6105 measurements show smaller deviations in average (0.2 dB) than the results obtained when the E-field interpolated with the HI-6105 and measurements taken with the HI-6053 (0.53 dB). The behavior of the deviations calculated coincides with the information supplied in the calibration certificates of both probes. The largest average deviation was experienced in the 2 V/m level,
Progress In Electromagnetics Research B, Vol. 39, 2012
367
Table 4. Deviation in 20 V/m from 300 MHz–1 GHz. Frequency (MHz)
HI-6105 (V/m)
HI-6053 (V/m)
Dev HI-6105 (dB)
Dev HI-6053 (dB)
300
20.255
19.900
0.110
0.044
400
20.375
22.420
0.161
0.992
500
20.139
20.170
0.060
0.074
600
20.148
19.190
0.064
0.359
700
20.022
18.020
0.010
0.906
800
20.044
18.360
0.019
0.743
900
20.121
20.440
0.052
0.189
1000
20.159
18.820
0.070
0.528
reaching 0.39 dB for the HI-6105 and 0.79 dB for the HI-6053, because the measurements are close to the sensitivity threshold of both EM probes (0.5 V/m for the HI-6105 and 2.0 V/m for the HI-6053). 5. CONCLUSIONS The linear interpolation method, using correction factors to calculate the reference E-field generated, has been used as an alternative calibration method for EM probes inside SAC, given the limitations and the inaccuracies of the traditional and simplified mathematical model used to predict electrical field strength within a semi-anechoic chamber, based on the theoretical Friss transmission equation (direct ray formulation). In that sense, the effects of all the controlled and uncontrolled factors related in the E-field generation are modeled through a linear relationship between the corrected E-field strength measurements and the transmitting antenna input power applied, which is valid only in the proximity of the E-field generated as reference in the calibration process. It is important to notice that the aforementioned linear approximation is used only to improve the accuracy of results (reduce the deviations in measurement results) and does not pretend to formally establish a propagation model of the electromagnetic fields inside a SAC. The results showed that the deviation values obtained wre lower than 1 dB in most of the frequencies between 80–1000 MHz when the measurements were performed using two calibrated EM probes. The proposed method is reliable and the results repeatable. In addition, the method complies with the accuracy referenced by the IEEE [3]. In order to improve the repeatability and reproducibility of the
368
Tremola et al.
proposed method, it is recommended to perform the mounting and alignment of the reference probe based on the knowledge of mounting and alignment setup used by the manufacturer during calibration. Both the reference EM probe and the probe to be calibrated shall be mounted strictly in the same way in order to reduce the effect of the poor E-field uniformity obtained in SAC. Calibrating each axis independently results in less deviation than using E-field module, since the reference EM probe is calibrated based on the maximum interception alignment. Power amplifiers were found to have an important influence on the E-field generation. When the amplifiers temperature rises, the amplifier’s gain slightly decays; therefore the power transmitted to antenna is reduced. After performing a statistical analysis of the measures, a maximum sampling time was obtained in order to prevent the effect of amplifier gain on the samples. The proposed calibration method allows the use of different types of antennas, in the case that standard gain horns antennas are not available, due to the comparative principle of the transfer standard method that refers to the measured value obtained from a reference EM probe. It is recommended to use antennas recently calibrated. Factors such as the E-field uniformity, gain of the power amplifiers, reproducibility of the mounting and alignment of the probes, uncertainty of the antenna calibration (Biconilog, Log periodic) are considered as uncertainty contributions associated with this method. It is mandatory to estimate the uncertainty in the results. ACKNOWLEDGMENT The authors would like to give special recognition to the Venezuela’s National Telecommunications Commission (CONATEL) for the support provided with the EM probes. REFERENCES 1. ICNIRP Guidelines, “Guidelines for limiting exposure to timevarying electric, magnetic, and electromagnetic fields (up to 300 GHz). International commission on non-ionizing radiation protection,” Health Physics, Vol. 74, No. 4, 494–522, 1998. 2. IEC 61000-4-3, “Testing and measurement techniques radiated, radio-frequency, electromagnetic field immunity test — Electromagnetic compatibility (EMC), Part 4-3,” International Electrotechnical Commission (IEC), Edition 3.2, Apr. 2010.
Progress In Electromagnetics Research B, Vol. 39, 2012
369
3. IEEE 1309, “IEEE standard for calibration of electromagnetic field sensors and probes, excluding antennas, from 9 kHz to 40 GHz,” IEEE Electromagnetic Compatibility Society, Jun. 1996. 4. Nahma, N. S, M. Kanda, E. Larsen, and M. Crawford, “Methodology for standard electromagnetic field measurements,” IEEE Transactions on Instrumentation and Measurement, Vol. 34, No. 4, 490–503, 1985. 5. Kanda, M., E. Larsen, M. Borsero, P. G. Galliano, I. Yokoshima, and N. Nahman, “Standard for electromagnetic field measurement,” Proceedings of the IEEE, Vol. 74, No. 1, 120–128, 1986. 6. De Vreede, J. P. M., G. M. Teunisse, K. Munter, H. Hoitink, K. Holland, M. O’Dwyer, L. Bergsten, and L. Puranen, “Calibration of RF field strength meters,” IEEE Transactions on Instrumentation and Measurement, Vol. 44, No. 2, 351–355, 1995. 7. Ishigami, S. and H. Masayuki, “A new calibration method for an electric-field probe using TEM waveguides,” Proceedings of 20th Int. Zurich Symposium on EMC, 425–428, 2009. 8. NG, K. T., T. E. Batchman, S. Pavlica, and D. L. Veasey, “Amplification and calibration for miniature E-field probes,” IEEE Transactions on Instrumentation and Measurement, Vol. 37, No. 3, 434–438, 1988. 9. Gao, Y., A. Lauer, Q. Ren, and I. Wolff, “Calibration of electric coaxial near-field probes and applications,” IEEE Transactions on Microwave Theory and Techniques, Vol. 46, No. 11, 1694–1702, 1998. 10. Kang, N.-W., J.-S. Kang, D.-C. Kim, J.-H. Kim, and J.-G. Lee, “Characterization method of electric field probe by using transfer standard in GTEM cell,” IEEE Transactions on Instrumentation and Measurement, Vol. 58, No. 4, 1109–1113, 2009. 11. Munter, K., “Portable E-field strength meter and its traceable calibration up to 1 GHz using a G-TEM cells,” IEEE Transactions on Instrumentation and Measurement, Vol. 46, No. 2, 549–550, 1997. 12. ANSI 63.4, “American national standard for methods of measurement of radio-noise emissions from low-voltage electrical and electronic equipment in the range of 9 kHz to 40 GHz,” American National Standards Institute (ANSI), Jan. 2004. 13. CISPR 16-1-4, “Specification for radio disturbance and immunity measuring apparatus and methods — Part 1–4: Radio disturbance and immunity measuring apparatus — Antennas and test sites for radiated disturbance measurements,” International Electrotechnical Commission (IEC), 3rd edition, 2010.
370
Tremola et al.
14. Betta, G., D. Capriglione, C. F. M. Carobbi, and M. D. Migliore, “Calibration of antenna for EMI measurements in compact semianechoic rooms,” 16th IMEKO TC4 Symposium, 2008. 15. Valdman, C., M. H. Dias, and J. C. A. Santos, “Design and calibration of electric field probe to the frequency range of 2 to 3 GHz,” IEEE Latin America Transactions, Vol. 6, No. 7, 557–563, 2008. 16. Komakine, T., T. Kurosawa, and H. Inoue, “A novel method of electric field estimation by using spherical dielectric scatterer,” IEEJ Transactions on Fundamentals and Materials, Vol. 130, No. 5, 462–466, 2010. 17. Guide NPL, A Guide to Power Flux Density and Field Strength Measurement, 1st edition, The Institute of Measurement and Control, National Physical Laboratory (NPL), 2004. 18. P´aez, E., C. Tremola, and M. Azp´ urua, “A proposed method for quantifying uncertainty in RF inmunity testing due to EUT presence,” Progress In Electromagnetics Research B, Vol. 29, 175– 190, 2011. 19. Ifong, W., S. Ishigami, K. Gotoh, and Y. Matsumoto, “Probe calibration by using a different type of probe as a reference in GTEM cell above 1 GHz,” IEICE Electronic Express, Vol. 7, No. 6, 460–466, 2010. 20. Chen, S. and J-S. Yuan, “Adaptive gate bias for power amplifier temperature compensation,” IEEE on Device and Materials Reliability, Vol. 11, No. 3, 442–449, 2011. 21. G´omez, D., M. Sroka, and J. Jim´enez, “Process and temperature compensation for RF low noise amplifiers and mixers,” IEEE Transactions on Circuits and Systems I: Regular Papers, 1204– 1211, 2010. 22. Mann, M., B. Gutheil, J. Zastrau, and P. Weiss, “Electromagnetic field measurements — Means of verification,” Proceeding of the 5th WSEAS/IASME, 591–595, 2005. 23. Mann, M., H. Bruggemeyer, and P. Weiss, “Verification of electromagnetic field measurements via inter-laboratory comparison measurements,” Advances in Radio Science, No. 3, 83–89, 2005. 24. Stratakis, D., A. Miaoudakis, C. Katsidis, V. Zacharopoulos, and T. Xenos, “On the uncertainty estimation of electromagnetic field measurements using field sensors: A general approach,” Radiation Protection Dosimetry, 1–8, 2009.
Progress In Electromagnetics Research B, Vol. 39, 2012
371
25. Alexander, M. J., M. J. Salter, D. G. Gentle, D. A. Knight, B. G. Loader, and K. P. Holland, “Measurement good practice guide N 73: Calibration and use of antennas, focusing on EMC applications,” National Physical Laboratory (NPL), 2004. 26. Chen, Z., “Practical considerations for radiated immunities measurement using ETS-lindgren EMC probes,” ETSLindgren White Paper, 2011, Available at: http://www.etslindgren.com/page/?i=WhitePaper-ETSL0511.