PIKAIA: A genetic algorithm for numerical optimization ..... 1 -f(x y) : (4) example if
the trial move does not lead to an increase in f, the move might be repeated ...
i NCAR/TN-450+IA NCAR TECHNICAL NOTE March 2002
AN INTRODUCTION TO GENETIC ALGORITHMS FOR NUMERICAL OPTIMIZATION
Paul Charbonneau
HIGH ALTITUDE OBSERVATORY NATIONAL CENTER FOR ATMOSPHERIC RESEARCH BOULDER, COLORADO
ii
iii
TABLE OF CONTENTS
List of Figures . . . . . . . . . . . . . . . . . . . . . . . . . . . . . . . . . . . . . . . . . . . . . . . . . . . . . . . .v List of Tables . . . . . . . . . . . . . . . . . . . . . . . . . . . . . . . . . . . . . . . . . . . . . . . . . . . . . . . . vii Preface . . . . . . . . . . . . . . . . . . . . . . . . . . . . . . . . . . . . . . . . . . . . . . . . . . . . . . . . . . . . ix 1. Introduction: Optimization 1.1 Optimization and hill climbing . . . . . . . . . . . . . . . . . . . . . . . . . . . . . . . . . .1 1.2 The simplex method . . . . . . . . . . . . . . . . . . . . . . . . . . . . . . . . . . . . . . . . . .6 1.3 Iterated simplex . . . . . . . . . . . . . . . . . . . . . . . . . . . . . . . . . . . . . . . . . . . . . .7 1.4 A set of test problems . . . . . . . . . . . . . . . . . . . . . . . . . . . . . . . . . . . . . . . . . .9 1.5 Performance of the simplex and iterated simplex methods . . . . . . . . 13 2. Evolution, optimization, and genetic algorithms 2.1 Biological evolution . . . . . . . . . . . . . . . . . . . . . . . . . . . . . . . . . . . . . . . . . . 17 2.2 The power of cumulative selection . . . . . . . . . . . . . . . . . . . . . . . . . . . . . . 18 2.3 A basic genetic algorithm . . . . . . . . . . . . . . . . . . . . . . . . . . . . . . . . . . . . 22 2.4 Information transfer in genetic algorithms . . . . . . . . . . . . . . . . . . . . . . 25 3. PIKAIA: A genetic algorithm for numerical optimization 3.1 Overview and problem de�nition . . . . . . . . . . . . . . . . . . . . . . . . . . . . . . 27 3.2 Minimal algorithmic components . . . . . . . . . . . . . . . . . . . . . . . . . . . . . . 28 3.3 Additional components . . . . . . . . . . . . . . . . . . . . . . . . . . . . . . . . . . . . . . 29 3.4 A case study: GA2 on P1 . . . . . . . . . . . . . . . . . . . . . . . . . . . . . . . . . . . . 30 3.5 Hamming walls and creep mutation . . . . . . . . . . . . . . . . . . . . . . . . . . . . 34 3.6 Performance on test problems . . . . . . . . . . . . . . . . . . . . . . . . . . . . . . . . 35 4. A real application: orbital elements of binary stars 4.1 Binary stars . . . . . . . . . . . . . . . . . . . . . . . . . . . . . . . . . . . . . . . . . . . . . . . . 41 4.2 Radial velocities and Keplerian orbits . . . . . . . . . . . . . . . . . . . . . . . . . . 42 4.3 A genetic algorithm solution using PIKAIA . . . . . . . . . . . . . . . . . . . . 45 5. Final thoughts and further readings 5.1 To cross over or not to cross over? . . . . . . . . . . . . . . . . . . . . . . . . . . . . 55 5.2 Hybrid methods . . . . . . . . . . . . . . . . . . . . . . . . . . . . . . . . . . . . . . . . . . . . 56
iv 5.3 When should you use genetic algorithms? . . . . . . . . . . . . . . . . . . . . . . 56 5.4 Further readings . . . . . . . . . . . . . . . . . . . . . . . . . . . . . . . . . . . . . . . . . . . . 58 Bibliography . . . . . . . . . . . . . . . . . . . . . . . . . . . . . . . . . . . . . . . . . . . . . . . . . . . . . . . . 61
v
LIST OF FIGURES
1 Operation of a generic hill climbing method . . . . . . . . . . . . . . . . . . . . . . . . . .3 2 A hard maximization problem . . . . . . . . . . . . . . . . . . . . . . . . . . . . . . . . . . . . . .4 3 An iterated hill climbing scheme . . . . . . . . . . . . . . . . . . . . . . . . . . . . . . . . . . . .5 4 Absolute performance of the simplex method . . . . . . . . . . . . . . . . . . . . . . . . . .8 5 Test problem P2 . . . . . . . . . . . . . . . . . . . . . . . . . . . . . . . . . . . . . . . . . . . . . . . . 11 6 Test problem P4 . . . . . . . . . . . . . . . . . . . . . . . . . . . . . . . . . . . . . . . . . . . . . . . . 12 7 Accelerated Norsk learning by means of cumulative selection . . . . . . . . . . 20 8 Convergence curves for the sentence learning search problem . . . . . . . . . . 21 9 Breeding in genetic algorithms . . . . . . . . . . . . . . . . . . . . . . . . . . . . . . . . . . . . 24 10 Convergence curves for GA2 on P1 . . . . . . . . . . . . . . . . . . . . . . . . . . . . . . . . 32 11 Evolution of the population in parameter space . . . . . . . . . . . . . . . . . . . . . . 33 12 Global convergence probability . . . . . . . . . . . . . . . . . . . . . . . . . . . . . . . . . . . . 37 13 Radial velocity variations in Bootis . . . . . . . . . . . . . . . . . . . . . . . . . . . . . . 42 14 Evolution of a typical solution to the binary orbit �tting problem . . . . . . 49 15 �2 isocontours in four hyperplanes of parameter space
. . . . . . . . . . . . . . 51
vi
vii
LIST OF TABLES
I Simplex performance measures on test problems . . . . . . . . . . . . . . . . . . . . 13 II Performance on test problems:
PIKAIA
vs iterated simplex . . . . . . . . . . . . 39
viii
ix
PREFACE
In 1998 I was invited to present a lecture on genetic algorithms at a MiniWorkshop on Numerical Methods in Astrophysics, held June 3{5 at the Institute for Theoretical Astrophysics, in Oslo, Norway. I subsequently prepared a written version of the lecture in the form of a tutorial introduction to genetic algorithms for numerical optimization. However, for reasons beyond the organizers' control, the planned Proceedings of the Workshop were never published. Because the written version, available through the PIKAIA Web Page since september 1998, continues to prove popular with users of the PIKAIA software, I decided to \publish" the paper in the form of the present NCAR Technical Note. The paper is organized as follows. Section 1 establishes the distinction between local and global optimization and the meaning of performance measures in the context of global optimization. Section 2 introduces the general idea of a genetic algorithm, as inspired from the biological process of evolution by means of natural selection. Section 3 provides a detailed comparison of the performance of three genetic algorithm-based optimization schemes against iterated hill climbing using the simplex method. Section 4 describes in full detail the use of a genetic algorithm to solve a real data modeling problem, namely the determination of orbital elements of a binary star system from observed radial velocities. The paper closes in section 5 with re�ections on matters of a somewhat more philosophical nature, and includes a list of suggested further readings. I ended up making very few modi�cations to the text originally prepared in 1998, even though if I were to rewrite it now some things undoubtedly would turn out di�erent. The suite of test functions I now use to test modi�cations to PIKAIA has evolved signi�cantly from that presented in x2 herein. Version 1.2 of PIKAIA, publicly released in April 2002, would compare even more favorably to the iterated simplex method against which PIKAIA 1.0 is pitted in x3 herein. I updated and expanded the list of further reading (x5.5) to better re�ect current topic and trends in the genetic algorithm literature. In addition to some minor rewording here and there throughout the text, I also restored a Figure to x1, and a �nal subsection to x2, both originally eliminated to �t within the 50-page limit of the above-mentioned ill-fated Workshop Proceedings. Back in 1998, I chose to give this paper the �avor of a tutorial. Each section ends with a summary of important points to remember from that section. You are
x of course encouraged to remember more than whatever is listed there. You will also �nd at the end of each section a series of Exercises. Some are easy, others less so, and some require programming on your part. These are designed to be done using PIKAIA, a public domain self-contained genetic algorithm-based optimization subroutine. The source code for PIKAIA |as well as answers to most exercises| are available on the tutorial Web Page, from which you can also access the PIKAIA Web Page: http://www.hao.ucar.edu/public/research/si/pikaia/tutorial.html
The Tutorial Page also includes various animations for some of the solutions discussed in the text. The PIKAIA Web Page contains links to the HAO ftp archive, from which you can obtain, in addition to the source code for PIKAIA, a User's Guide, as well as source codes for the various examples discussed therein. The idea behind all this is that by the time you are done reading through this paper and doing the Exercises, you should be in good shape to solve global numerical optimization problems you might encounter in your own research. The writing of this preface o�ers a �ne opportunity to thank my friends and colleagues Viggo Hansteen and Mats Carlsson for their invitation and �nancial support to attend their 1998 Mini-Workshop on Numerical Methods in Astrophysics, as well as for their kind hospitality during my extended stay in Norway. The � CrB data and some source codes for the orbital element �tting problem of x4 were provided by Tim Brown, who was also generous with his time in explaining to me some of the subtleties of orbital element determinations. Thorough readings of the 1998 draft of this paper by Sandy and Gene Arnn, Tim Brown, Sarah Gibson, Barry Knapp and Hardi Peter are also gratefully acknowledged. Throughout my twelve years working at NCAR's High Altitude Observatory, it has been my privilege to interact with a large number of bright and enthusiastic students and postdocs. My forays into genetic algorithms have particularly bene�ted from such collaborators. Since 1995, I have had to keep up in turn with Ted Kennelly, Sarah Gibson, Hardi Peter, Scott McIntosh, and Travis Metcalfe. I thank them all for keeping me on my toes all this time.
Paul Charbonneau March 2002, Boulder
1. INTRODUCTION: OPTIMIZATION
1.1 Optimization and hill climbing Optimization is something that most readers of this tutorial will have �rst faced a long time ago in their �rst calculus class� one is given an analytic function f (x), and presented with the task of �nding the value of x at which the function reaches its maximum value. The procedure taught toward this end is (1) di�erentiate the function with respect to x� (2) set the resulting expression to zero� (3) solve for x, call the result xmax, and there you have it1. Even though most of us would no longer think twice about it, this is actually a pretty neat trick! For the reader trained in physics the limitation of this analytical method was encountered perhaps �rst in optics, when studying the di�raction pattern of a single vertical slit (e.g., Jenkins & White 1976, chap. 15). You might recall that the intensity of the di�raction pattern varies as (sin x=x)2, where x is directly proportional to the distance along the direction perpendicular to the slit on the screen on which the di�raction pattern is projected. The location of the intensity minima are readily found to be xmin = n�, with n = 1� 2� ::: (n = 0 is trickier). However, calculating the locations of the intensity maxima by the analytical procedure described above leads to a nasty nonlinear transcendental equation which cannot be solved algebraically for x. One has to turn to iterative or graphical means (in the course of which the trickier n = 0 case of the minima is also resolved). This di�culty with the di�raction problem is symptomatic of the fact that it is usually harder (very often much harder) to �nd the zeros of functions than their extrema, the more so the higher the dimensionality of the said functions (see Press et al. 1992, x9.6, for a concise yet lucid discussion of this matter). The inescapable conclusion is that once one moves beyond high school calculus min/max problems, optimization is best carried out numerically. Upon opening a typical introductory textbook on numerical analysis, one is almost guaranteed to �nd therein a few optimization methods described in some 1
In fact, you also have to di�erentiate the result of step (2) once again, and verify that the resulting expression is negative when evaluated at xmax� but this subtlety might have been elaborated upon only in the next lecture...
2 detail. In nearly all cases, those methods will fall under the broad category of hill climbing schemes. The operation of a generic hill climbing scheme is illustrated on Figure 1, in the context of maximizing a function of two variables, i.e., �nding the maximum \altitude" in a 2-D \landscape". Hill climbing begins by choosing a starting location in parameter space (panels A]{ B]). One then determines the local steepest uphill direction, moves a certain distance in that direction (panel C]), re-evaluates the local uphill direction, and so on until a location in parameter space is arrived at where all surrounding directions are downhill. This marks the successful completion of the maximization task (panel D]). Most textbook optimization methods basically operate in this way, and simply di�er in how they go about determining the steepest uphill direction, choosing how a big a step is to be taken in that direction, and whether or not in doing so use is made of gradient information accumulated in the course of previous steps. Hill climbing methods work great if faced with unimodal landscapes such as the one towards which the rabid paratrooper of Fig. 1(A) is about to deposit his lower backside. Unfortunately, life is not always that simple. Consider instead the 2-D landscape shown on Figure 2� the maximum is the narrow central spike indicated by the arrow, and is surrounded by concentric rings of secondary maxima. The only way that hill climbing can �nd the true maximum in this case is if our paratrooper happens to land somewhere on the slopes of the central maximum� hill climbing from any other landing site will lead to one of the rings. The central peak covers a fractional surface area of about 1% of the full parameter space (0 � x� y � 1). Unlike on the landscape of Fig. 1(A), here the starting point is critical if hill climbing is to work. Hill climbing is a local optimization strategy. Figure 2 o�ers a global optimization problem. Of course, if the speci�c optimization problem you are working on happens to be such that you can always come up with a good enough starting guess, then all you need is local hill-climbing, and you can proceed merrily ever after. But what if you are in the situation most people �nd themselves in when dealing with a hard global optimization problem, namely not being in a position to pull a good starting guess out of your hat? I know what you're thinking. If the central peak covers about 1% of parameter space, it means that you have about one chance in a hundred for a random drop to land close enough for hill climbing to work. So the question you have to ask yourself is: do I feel lucky?2 Your answer to this question is embodied in the First 2
Well, do you, punk?
3
Figure 1: Operation of a generic hill climbing method (allegory). From a ran-
domly chosen starting point (panel A]), the direction of maximum slope is followed (panel C]) until one reaches a point where all surrounding directions are downhill (panel D]). Landing (panel B]) is not problematic from the computational point of view.
4
Figure 2: Two dimensional surface f (x� y), with x� y 2 0� 1], de�ning a hard
maximization problem. The global maximum is f (x� y) = 1 at (x� y) = (0:5� 0:5), and is indicated by the arrow. Rule of Global Optimization, also known as THE DIRTY HARRY RULE: \You should never feel lucky"
Faced with the landscape of Figure 2 the most straightforward solution lies with a technique called iterated hill climbing. This is a fancy name for something very simple, as illustrated on Figure 3. You just run your favorite local hill climbing method repeatedly, each time from a di�erent randomly chosen starting point. While doing so you keep track of the various maxima so located, and once you are satis�ed that all maxima have been found you pick the tallest one and you are done with your global optimization problem. As you might imagine, deciding when to stop is the crux of this otherwise straightforward procedure.
5
Figure 3: An iterated hill-climbing scheme. After landing, each trial proceeds as on Fig. 1.
6 With a fractional coverage of 1% for the central peak of Figure 2, you might expect to have to run, on average, something of the order of 102 iterated hill climbing trials before �nding the central peak. As one is faced with optimization problems of increasing parameter space dimensionality, and/or situations where the global maximum spans only a tiny fraction of parameter space, iterated hill climbing can add up to a lot of work. This leads us naturally to the Second Rule of Global Optimization, also known as THE NO FREE LUNCH RULE: \If you really want the global optimum, you will have to work for it" These considerations also lead us to distinguish between three distinct aspects of performance, when dealing with a global optimization problem3: (1) Absolute performance: How numerically accurate is the solution returned by my adopted method? (2) Global performance: How certain can I be that the solution returned by my method is the true global maximum in parameter space? (3) Relative performance: How much computational work is required by my method to return a solution? Most fancy optimization methods you might read about in textbooks are designed to do as well as possible on (1) and (3) simultaneously. Such methods will do well on (2) only if provided with a suitable starting guess. If such a guess is consistently available for the problems you are working on, you need not read any further. But rest assured that Dirty Harry will catch up with you one of these days.
1.2 The simplex method The distinction between local and global optimization, as well as the related performance issues, are perhaps best appreciated by looking in some detail at the behavior of a local hill climbing method on a global optimization problem. Toward this end we retain the 2-D landscape of Figure 2 as a test bed, and attempt to maximize it using the Simplex Method. 3
A di�erent terminology may well be used in optimization textbooks, but you can be assured that they do discuss something equivalent.
7 The Simplex Method of Nelder & Mead (1965) is actually a very robust hill climbing scheme. A brief yet clear introduction to the method can be found in Press et al. (1992, x10.4). A simplex is a geometrical �gure with n +1 vertices, that lives in a parameter space of dimension n. In 2-D space a simplex is a triangle, in 3-D space a tetrahedron, and so on. Given the function value (here the \altitude" f (x� y)) at each of the simplex's vertices (here an (x� y) point), the worst vertex is displaced by having the simplex undergo one of three possible types of \moves", namely contraction, expansion, or re�ection (see Fig. 10.4.1 in Press et al.). The move is executed in a manner such that the function value of the displaced vertex is increased by the move (in the context of a maximization problem). The simplex undergoes successive such moves until no move can be found that leads to further improvement beyond some preset tolerance. Watching the simplex contract and expand and squirt around the landscape of Fig. 2 is good visual fun4 , and justi�es well the name given by Press et al. to their simplex subroutine: amoeba. This is the implementation used here. By the standards of local optimization methods, the simplex passes for a \slow" method. The absolute accuracy of the solution increases approximately linearly with the number of simplex moves. However, the simplex can pull itself out of situations that would defeat or seriously impede faster, \smarter" gradient-based local methods� it can e�ciently crawl up long �at valleys, and squeeze through saddle points. In this sense, it can be said to exhibit pseudo-global capabilities. Evidently the simplex method requires that one provide initial coordinates (x� y) for the simplex's three vertices. Despite the simplex method's pseudo-global abilities, on a multimodal, global problem the choice of initial location for the simplex often determines whether the global maximum is ultimately found. Figure 4 shows a series of convergence curves for the test problem of Figure 2. Each curve corresponds to a di�erent, random initial simplex con�guration. When the simplex �nds the central peak, it does so rather quickly, requiring about 25 moves for 10;5 accuracy. The problem, of course, is that the simplex often does not converge to the central peak. Repeated trials reveal that the method achieves global convergence for only 2% or so of trials.
1.3 Iterated Simplex The prospects of the simplex method for global performance are greatly enhanced if one of the starting vertices lies high enough on the slopes of central peak. This suggests that iterated hill climbing using the simplex method (hereafter iterated simplex) should achieve global performance within a few hundred 4 An animation of the simplex at work on the 2-D landscape of Figure 2 can be viewed on the tutorial Web Page. Check it out!
8
Figure 4: Absolute performance of the simplex method on the test problem of
Figure 2. Each curve corresponds to a di�erent starting simplex. Failure of the simplex to locate the central peak leads to the convergence curves leveling o� at relatively high values of 1;f (x� y). With 2 converged runs out of 10 trials, this plot is not representative of the simplex method's global performance on this problem, which is in fact signi�cantly poorer, namely about 2%.
iterations. And indeed it does� repeatedly running the simplex (500 times) on the test problem of Figure 2 leads to the central peak being located in 99.5% of trials5 . The price to pay of course, is in the number of function evaluations required to achieve this level of global performance: nearly 104 function evaluations per iterated simplex run, on average6 . Welcome back to the No Free Lunch Rule... 5
It is recommended practice when using the simplex in single-run mode to carry out a random restart once the simplex has converged� this entails reinitializing randomly all but one of the converged simplex's vertices, and letting the simplex reconverge again. What is described here as iterated simplex consists in reinitializing all vertices randomly, so as to make each successive trial fully independent from all others. 6 A single simplex move may entail more than one function evaluation. For
9
1.4 A set of test problems One should rightfully suspect that the simplex method's performance on the test problem of Figure 2 might not be representative of its performance on other problems. This very legitimate concern will evidently carry over to the various genetic algorithm-based optimization schemes discussed further below. It will therefore prove useful to have available not just one, but a set of test problems. The four test problems described below are all very hard global optimization problems, on which most conventional local optimization algorithms would fail miserably. Also keep in mind that it is always possible to design a test problem that will defeat any global optimization method7. 1.4.1 P1: maximizing a function of two variables �2 parameters] Our �rst test problem (hereafter labeled \P1") is our now familiar 2-D landscape of Figure 2. Mathematically, it is de�ned as
f (x� y) = cos2 (n�r) exp(;r2 =�2) �
(1a)
r2 = (x ; 0:5)2 + (y ; 0:5)2� x� y 2 0� 1] � (1b) where n = 9 and �2 = 0:15 are constants. The global maximum is located at (x� y) = (0:5� 0:5), with f (x� y) = 1:0. This global maximum is surrounded by concentric rings of secondary maxima, centered on the global maximum at radial distances rmax = f0:110192� 0:220385� 0:330582� 0:440782� 0:550986g :
(2)
Between these are located another series of concentric rings corresponding to minima: rmin = m ;n1=2 � m = 1� :::� 6 (3)
The error " associated with a given solution (x� y) can be de�ned as
" = 1 ; f (x� y) :
(4)
example if the trial move does not lead to an increase in f , the move might be repeated with a halved or doubled displacement length (or a di�erent type of move might be attempted, depending on implementation). On the maximization problem of Figure 2, one simplex move requires 1.8 function evaluations, on average. 7 The high-n, high-D version of the fractal function discussed in x3.5 of B#ack (1996) is a pretty good candidate for the ultimate killer test problem.
10 Note that the \peak" corresponding to the global maximum covers a surface area �=(4n2) in parameter space. If a hill climbing scheme were used, the probability of a randomly chosen starting point landing close enough to this peak for the method to locate the true global maximum is only 1% for n = 9. 1.4.2 P2: maximizing a function of two variables again �2 parameters] Test function P2, shown on Figure 5, is again a 2-D landscape to be maximized. It is de�ned by f (x� y) = 0:8 exp(;r12 =(0:3)2) + 0:879008 exp(;r22=(0:03)2) � (5a) (5b) r12 = (x ; 0:5)2 + (y ; 0:5)2 � r22 = (x ; 0:6)2 + (y ; 0:1)2 : (5c) The maximum f (x� y) = 1 is at (x� y) = (0:6� 0:1), and corresponds to the peak of the second, narrower Gaussian. P2 is about as hard a global optimization problem as P1 (the simplex succeeds 141 times out of 104 trials), but for a di�erent reason. There are now only two local maxima, with the global maximum again covering about 1% of parameter space. Unlike P1, where moving toward successively higher secondary extrema actually brings one closer to the true maximum, with P2 moving to the secondary maximum pulls solutions away from the global maximum. Problems exhibiting this characteristics are sometimes called \deceptive" in the optimization literature. 1.4.3 P3: maximizing a function of four variables �4 parameters] Test problem P3 is a direct generalization of P1 to four independent variables (w� x� y� z): f (w� x� y� z) = cos2 (n�r) exp(;r2=�2) � (6a) r2 = (w ; 0:5)2 + (x ; 0:5)2 + (y ; 0:5)2 + (z ; 0:5)2 � w� x� y� z 2 0� 1] � (6b) again with n = 9 and �2 = 0:15. Comparing performance on P1 and P3 will provide a measure of scalability of the method under consideration, namely how performance degrades as parameter space dimensionality is increased, everything else being equal. P3 is a very hard global optimization problem� the simplex method manages to �nd the global maximum only 6 times out of 105 trials. 1.4.4 P4: Minimizing a least squares residual �6 parameters] Our fourth and �nal test problem is de�ned as a \real" nonlinear least squares �tting problem. Consider a function of one variable (x) de�ned as the sum of two Gaussians: ! 2 2 X ( x ; x ) : (7) y(x) = Aj exp ; �2 j j =1
j
11
Figure 5: Test problem P2. The problem consist in maximizing a function of
two variables, de�ned by two Gaussians (see eqs. 5]). The global maximum is f (x� y) = 1 at (x� y) = (0:6� 0:1), and is indicated by the arrow.
De�ne now a \dataset" by evaluating this function for a set of K equidistant values of xk in the interval 0� 1], i.e., yk� � y(xk ), xk+1 ; xk = $x, for some set values of A1 � x1� etc. Given that dataset and the functional form used to generate it (i.e., eq. 7]), the optimization problem is then to recover the parameter values for A1 � x1� etc originally used to produce the dataset. This is done by minimizing the square residual
R(A1� x1� �1� A2� x2� �2) =
K X k=1
y� ; y(xk � A1� x1� �1� A2� x2� �2)]2 �
(8)
with respect to the 6 parameters de�ning the two Gaussians. If one is told a priori that two Gaussians are to be �t to the data, then this residual minimization problem is obviously equivalent to a 6-D function maximization problem for 1=R (say), which simply de�nes a function in 6-D space. Figure 6 shows the dataset generated using the parameter set A1� x1� �1� A2� x2� �2] = 0:9� 0:3� 0:1� 0:3� 0:8� 0:025] (9)
12
Figure 6: Test problem P4. This is a 6-parameter problem which consists in �tting two Gaussians to a \dataset" of 51 points. Note how the second Gaussian is poorly sampled by the discretization in x. The thin solid line is the underlying 2-Gaussian function de�ned by eq. (7).
and K = 51 discretization points in x. Once again the resulting minimization problem is not an easy one� given the discretization in x, the minimization is largely dominated by the need to accurately �t the broader, high amplitude �rst Gaussian� the second Gaussian is not only of much lower amplitude, it is also poorly sampled in x. Fitting only the �rst Gaussian leads to a reasonably low residual (R ' 0:25)� global accuracy requires the second Gaussian to be also \detected" and �t, in which case only does R ! 0. The simplex succeeds in properly �tting both Gaussians 123 out of 103 trials. What are the \secondary minima" on which the simplex remains stuck? They can be divided into two broad classes: (1) one of the model Gaussians �ts the broad, higher amplitude component, and the other is driven to zero, either by having A ! 0 or � ! 0� (2) the method returns a two Gaussians solution, where x1 = x2 = 0:3, �1 = �2 = 0:1, and A1 + A2 = 0:9. The 6-D parameter space contains long, �at \valleys" and \plains" of low but suboptimal residual values in which the simplex grinds to a halt.
13
Table I
Simplex performance measures on test problems Test Problem
Performance
Simplex
Iterated simplex
P1
h1 ; f i
0.633
0.00793
37 1 0.194
3872 100 0.0619
44 1 0.413
4412 100 0.07713
70 1 0.332
35252 500 0.0069
753 1
37638 20
P2
P3
P4
pG hNf i Nt h1 ; f i pG hNf i Nt h1 ; f i pG hNf i Nt hR i pG hNf i Nt
0.0213
0.0263
0.00006
0.123
0.898
0.931
0.016
0.941
1.5 Performance of the simplex and iterated simplex methods Table I summarizes the performance of the simplex and iterated simplex methods on the four test problems. Each entry represents an average over at least 1000 independent runs (up to 105 for P3), and so should be fairly representative of the methods' behavior on each test problem. For each problem the Table gives the absolute performance, de�ned here as the average over all runs of either 1 ; f (x), for P1, P2 and P3, or the residual R (cf. eq. 8]) for P4. The global performance is de�ned in terms of a probability measure (pG ) as the fraction of all runs for which the true, global extremum has been located (f � 0:95 for P1, P2 and P3) or the second, smaller Gaussian has been properly �t (R � 0:1 for P4). As a measure of relative performance the table simply lists the average number of function/model evaluations hNf i required by each method. The last entry for each problem is the number of trials Nt executed by iterated simplex (this number is 1 by de�nition for the basic simplex method without restart).
14 At this stage only a few comments need be made on the basis of Table I. The �rst is that, as advertised, all four test problems are hard global optimization problems, as can be judged from the poor global performance of the basic simplex method on each. Turning to iterated simplex leads to spectacular improvement in global performance in all cases, but of course the number of required function evaluations goes up by a few orders of magnitude. In fact the global performance of iterated simplex can be predicted on the basis of the single-run simplex. The global performance on the later can be viewed as a probability (p) of locating the global maximum� the (complementary) probability of a given run not to do so is 1 ; p� the probability of all iterated simplex runs not �nding the global maximum is then (1 ; p)N , so that the probability of any one of Nt iterations locating the global maximum is t
pG = 1 ; (1 ; p)N : t
Iterated hill climbing]
(10)
On the basis of eq. (10) one would predict global performances (0.884, 0.930, 0.029, 0.927) on P1 through P4, given the number of hill climbing iterations listed in the rightmost column of Table 1, which compares quite well with the actual measured global performance. One can also rewrite eq. (10) as
; pG ) � Nt = log(1 log(1 ; p)
Iterated hill climbing]
(11)
to predict the expected number of hill climbing iterations required to achieve a global performance level pG � with p ' 6 � 10;5 for P3, requiring pG = 0:95 would demand (on average) Nt ' 50000 hill climbing trials, adding up to a grand total of about 3:5 � 106 function evaluations since a single simplex run on P3 carries out on average 70 function evaluations (cf. Table 1). Iterated hill climbing certainly works, but there really is no such thing as a free lunch... It is easy to predict the expected global performance of iterated simplex because each trial proceeds completely independently. The improvement in global performance simply re�ects the better initial sampling of parameter space associated with the initial distribution of simplex vertices. Everything else being equal, as problem dimensionality (n) increases the number of trials Nt required can be expected to scale as Nt / an , where a is some number characterizing in this case the fraction of parameter space covered by the global maximum. Iterated simplex is not only demanding in terms of function evaluations, but in addition it does not scale well at all on a given problem as dimensionality is increased. This, in fact, is the central problem facing iterated hill climbing in general, not just its simplex-based incarnation.
15 The poor scalability of iterated hill climbing stems from the fact that each trial proceeds independently. The challenge in developing global methods that are to outperform iterated hill climbing consists in introducing a transfer of information between trial solutions, in a manner that continuously \broadcasts" to each paratrooper in the squadron the topographical information garnered by each individual paratrooper in the course of his/her local hill climb. The challenge, of course is to achieve this without overly biasing the ensemble of trials. A relatively well-known method that often achieves this reliably is simulated annealing (Metropolis et al. 1953� see also Press et al. 1992, x10.9). Simulated annealing is inspired by the global transfer of energy/information achieved by colliding constituent particles of a cooling liquid metal, which allows the substance to achieve the crystalline/metallic con�guration that minimizes the total energy of the whole system. The algorithmic implementation of the technique for numerical optimization requires the speci�cation of a cooling schedule, which is far from trivial: fast cooling is computationally e�cient (low hNf i) but can lead to convergence on a secondary extremum (low pG ), while slow cooling improves global convergence (high pG ), but at the expense of a high hNf i. No Free Lunch, remember... Genetic Algorithms achieve the same goal, but are inspired by the exchange of genetic information occurring in a breeding population subjected to natural selection. They can be used to form the core of very robust, global numerical optimization methods, as detailed in Section 3 below. The following Section provides a brief introduction to genetic algorithms in a more general sense.
The least you should remember from Section 1:
Global optimization is a totally di�erent game from local optimization.
You should never feel lucky.
There is no such thing as a free lunch.
You can always design a problem that will defeat any global optimization method.
Exercises for Section 1:
(1) Look back at Figure 4. Whenever the simplex fails to achieve global convergence (i.e., 1 ; f ! 0) it seems to remain stuck at a discrete set of 1 ; f values. What do these values correspond to? (2) Consider again the use of iterated simplex on the test problem of Figure 2� calculate the fractional surface area of the part of the central peak that lies higher that the innermost ring of secondary maxima. On this basis what
16 would you predict the required number of simplex trials to be, on average, for iterated simplex to locate the central peak. (3) Repeat the same analysis as for Exercise (2) above, but in the context of the P3 test problem. Are your results in basic agreement with Table 1? How can you explain the di�erences (if any)?
17
2. EVOLUTION, OPTIMIZATION, AND GENETIC ALGORITHMS
2.1 Biological evolution The general ideas of evolution and adaptation predate Charles Darwin's On the Origin of Species by Means of Natural Selection (1859), but it is Darwin (and more or less simultaneously Alfred Russell Wallace) who �rst identi�ed what is still considered to be the primary driving mechanism of evolution: natural selection. Nature is very much oversubscribed. At almost any time in any ecosystem, far more individuals are born than can possibly survive given the ecosystem's available resources. This implies that many members of a given species will die from attrition or predation before they have a chance to reproduce. The principle of natural selection states that individuals better adapted to their environment, i.e., for whatever reason better at obtaining lunch, avoiding becoming lunch, and �nding/attracting/competing for mates, will, on average, leave behind more o�spring than their less apt colleagues. For natural selection to lead to evolution, two more essential ingredients are required: (1) inheritance: o�spring must retain at least some of the features that made their parents �tter than average, otherwise evolution is e�ectively reset at every generation� (2) variability: at any given time individuals of varying �tnesses must coexist in the population, otherwise natural selection has nothing to operate on. Both these additional requirements were plainly obvious to Darwin and his contemporaries, but their underlying mechanisms remained unexplained in their lifetime. However, this situation changed rapidly in the early decades of the twentieth century, and the primary processes through which heredity is mediated and variation maintained are now basically understood. In a nutshell, the information determining the growth and development of individuals is encoded as linear sequences of genes that can each assume a �nite set of \values". In sexual species, when two individuals breed, complementary portions of their genetic material are passed on to their o�spring and combined to de�ne that o�spring's full genetic makeup. That's the inheritance part. In the course of \preprocessing" the genetic material to be later passed on to o�spring, copy mistakes and truly random alteration of some gene values also occur occasionally. These mutation events, coupled
18 to the fact that an o�spring receives complementary genes from two parents (which is true of most animals), provides the needed source of variability. The individual that moves, feeds and mates in real space can be looked at as an outer manifestation of its de�ning genes8 . Think then of an individual's �tness as a function of the values assumed by its genes. What evolution does is to drive a gradual increase in average �tness values over the course of many generations. This is what Darwin called adaptation. Now that's beginning to sound like hill climbing, doesn't it? In fact evolution does not optimize, at least not in the mathematical sense of the word. Evolution is blind. Evolution does not give a damn about globally maximal �tness (n'en d%eplaise &a Teilhard de Chardin). Even if it did, evolution must accommodate physical constraints associated with development and growth, so that not all paths are possible in genetic \parameter space". All evolution does is produce individuals of above-average �tness. Nonetheless, the basic ideas of natural selection and inheritance with variation can be used to construct very robust algorithms for global numerical optimization.
2.2 The power of cumulative selection The idea that natural selection can lead to a form of hill climbing in �tness space may become intuitively obvious... after thinking about it for a while! What remains less obvious is the degree to which cumulative selection, i.e., selection operating on successive generations, can accelerate what would in its absence be a random search of genetic parameter space. The following example, popularized in Richard Dawkins' The Blind Watchmaker (1986� a book well worth reading, incidentally), makes for such a nice demonstration of this very point that it has by now found its way into at least one textbook on evolutionary genetics (Maynard Smith 1989� an excellent introduction to the topic). Consider the following sentence9 : JEG SNAKKER BARE LITT NORSK
This sentence is 27 characters long including blank spaces, and is made up of an alphabet of 30 letters if a blank character is included (please note that I am taking into account the famous Scandinavian letters ' A, (, and )). Consider now 8
This is said without at all denying that a large part of what makes us who we are arises from learning and other interactions with the environment in the course of development and growth� what genes encode is some sort of basic behavioral Bauplan from which these higher level processes take o�. 9 The original sentence used by Dawkins is METHINK IT IS LIKE A WEASEL, which, of course, is taken from Shakespeare's Hamlet.
19 the process of producing 27-character-long sentences by randomly selecting letters from the 30 available characters of the alphabet. Here's an example: GE YT� AUMNBGH JH�A QMWCXNES�
Doesn't look much like the original sentence... although careful comparison will show that two letters actually coincide. The total number of distinct 27-characterlong sentences that can be made out of a 30-character alphabet is 3027 = 7:63 � 1039. This is a very large number, even by astronomical standards. The corresponding probability of generating our �rst, target sentence by this random process on the �rst trial is then (30);27 ' 10;40. This is such a small number that invoking the Dirty Harry Rule at this point would be moot. Instead consider the following procedure: (1) Generate 10 sentences of 27 randomly chosen characters� (2) Select the sentence that has the most correct letters� (3) Duplicate this best sentence ten times� (4) For each such duplicate, randomly replace a few letters10 � (5) Repeat steps (2) through (4) until the target sentence has been matched. This search algorithm incorporates the three ingredients mentioned previously as essential to the evolutionary process. Step (2) is natural selection, in fact in a deterministic and rather extreme form since the best and only the best acts as progenitor to the next \generation". Step (3) is inheritance, again of a rather extreme form as o�spring start o� as exact replicas of the (single) progenitor. Step (4) is a stochastic process which provides the required variability. Note also that the algorithm operates with minimal \�tness" information� all it has available is how many correct letters a sentence contains, but not which letters are correct or incorrect. What is still missing is exchange of information between trial solutions, but be patient, this will come in due time. Figure 7 illustrates the \evolution" of the best-of-10 sentence, starting from an initial ten random sentences, as described above. The mutation rate was set at p = 0:01, meaning that any given letter has a probability 0.01 of being subjected to random replacement. Iteration count is listed in the leftmost column, and error in the rightmost column. Error is de�ned here simply as the number of incorrect letters in the best sentence generated in the course of the current iteration. Note how the error decreases rather rapidly at �rst, but much more slowly later on� it takes about as many iterations to get the �rst 20 letters right as it takes to get the last one. The target sentence is found after only 918 iterations, in the course More precisely, de�ne a mutation rate as the probability p (2 0� 1]) that a given constituent letter be randomly replaced. 10
20
Figure 7: Accelerated Norsk learning by means of cumulative selection. Iteration
count is listed in the left column, and the error, de�ned as the number of incorrect letters, in the rightmost column. The target sentence is found after 918 iterations. of which 9180 trial sentences were generated and \evaluated" against the target. This is almost in�nitely less than the � 1040 of enumerative or purely random search. Figure 8 shows convergence curves for three runs starting with the same initial random sentence, but evolving under di�erent mutation rates. The solid line is the solution of Figure 7. Note how the solution with the highest mutation rate converges more rapidly at �rst, but eventually levels o� at a �nite, nonzero error level. What is happening here is that mutations are producing the needed correct letters as fast as they are destroying currently correct letters. Given an alphabet size and sentence length, there will always exist a critical mutation rate above which this will happen11 . There are two important things to remember at this point. First, mutation 11
This is in fact a notion central to our understanding of the emergence of life. Among a variety of self-replicating molecules of di�erent lengths \competing" for chemical constituents in limited supply in the primaeval soup, those lying closest to the critical mutation rate can adapt the fastest to an evolving chemical
21
Figure 8: Convergence curves for the sentence search problem, for three di�erent
mutation rates. The curves show the error associated with the best sentence produced at each iteration. The solid line corresponds to the solution shown on Figure 7.
is a mixed blessing. It is clearly needed as a source of variability, but too much of it is de�nitely deleterious. Second, the general shape of the convergence curves in Figure 8 is worth noting. Convergence is rather swift at �rst, but then levels o�. This is a behavior we will meet again and again in what follows. Time now to move on, �nally, to genetic algorithms.
environment without self-destructing, and so rapidly take over the soup (see, Eigen 1971 for a comprehensive though somewhat dated review). This is conjectured to be the explanation behind the universality of the genetic code among very nearly all living organisms.
22
2.3 A basic genetic algorithm Fundamentally, genetic algorithms are a class of search techniques that use simpli�ed forms of the biological processes of selection/inheritance/variation. Strictly speaking they are not optimization methods per se, but can be used to form the core of a class of robust and �exible methods known as genetic algorithm-based optimizers. Let's go back to a generic optimization problem. One is given a \model" that depends on a set of parameters u, and a functional relation f (u) that returns a measure of quality, or �tness, associated with the corresponding model (this could be a �2 -type goodness of �t measure if the model is compared to data, for example). The optimization task usually consists in �nding the \point" u� in parameter space corresponding to the model that maximizes the �tness function f (u). De�ne now a population as a set of Np realizations of the parameters u. A top-level view of a basic genetic algorithm is then as follows: (1) Randomly initialize population and evaluate �tness of its members� (2) Breed selected members of current population to produce o�spring population (selection based on �tness)� (3) Replace current population by o�spring population� (4) Evaluate �tness of new population members� (5) Repeat steps (2) through (4) until the �ttest member of the current population is deemed �t enough. Were it not that what it being cycled through the iteration is a population of solutions rather than a single trial solution, this would very much smell of iterated hill climbing. It should also give you that uncanny feeling of d�ej�a vu, unless your memory is really shot or, shame on you, you have skipped over the preceding section. The crucial novelty lies with step 2: Breeding. It is in the course of breeding that information is passed and exchanged across population members. How this information transfer takes place is rather peculiar, and merits discussion in some detail, and not only because this is where genetic algorithms justify the \genetic" in their name. Figure 9 illustrates the breeding process in the context of a simple 2-D maximization problem, such as the P1 or P2 test problems. In this case an individual is a (x� y) point, and so is \de�ned" by two �oating point numbers. The �rst step is to encode the two �oating point numbers de�ning each individual selected for breeding. Here this is done simply by dropping the decimal point and concatenating the resulting set of simple decimal integers into a \chromosome"-like string (lines 01|06 on Figure 9). Breeding proper is a two step process. The �rst step
23 is crossover. The two strings generated by the encoding process are laid side by side, and a cutting point is randomly selected along the length of the de�ning strings. The string fragments located right of the cutting point are then interchanged, and spliced onto the fragments originally located left of the cutting point (lines 07|12, for a cutting point located between the third and fourth decimal digit). The second breeding step is mutation. For each string produced by the crossover process, a few randomly selected digits (or \genes") are replaced by a new, randomly selected digit value (lines 13|16, for a mutation hitting the tenth digit of the second o�spring string). The resulting fragments are then decoded into two (x� y) pairs, whose �tness is then evaluated, here simply by computing the function value f (x� y). Some additional comments are in order. First, note that o�spring incorporate intact \chunks" of genetic material coming from both parents� that's the needed inheritance, as well as the promised exchange of information between trial solutions. However, both the crossover and mutation operations also involve purely stochastic components, such as the choice of cutting point, site of mutation, and new value of mutated digit. This is where we get the variability needed to sustain the evolutionary process, as discussed earlier. Second, the encoding/decoding process illustrated on Figure 9 is just one of many possible such schemes. Traditionally, genetic algorithms have made use of binary encoding, but this is often not particularly advantageous for numerical optimization. The use of a decimal genetic \alphabet" is no more arti�cial than a binary representation, even more so given that very nearly all known living organisms encode their genetic information in a base-4 alphabet. In fact, in terms of encoding �oating-point numbers, both binary and decimal alphabets su�er from signi�cant shortcomings that can a�ect the performance of the resulting optimization algorithms. Third, the crossover and mutation operators, operating in conjunction with the encoding/decoding processes as illustrated on Figure 9, preserve the total range in parameter space. That is, if the �oating-point parameters de�ning parent solutions are restricted to the range 0:0� 1:0], then the o�spring solution parameters will also be restricted to 0:0� 1:0]. This is a very important property, through which one can e�ortlessly hardwire constraints such as positivity. Fourth, having the mutation operator act on the encoded form of the parent solution has the interesting consequence that o�spring can di�er very much or very little from their parents, depending on whether the digits a�ected by mutation decode into one of the leading or trailing digits of the corresponding �oating-point number. This means that from the point of view of parameter space exploration, a genetic algorithm can carry out both wide exploration and �ne tuning in parallel. Fifth, it takes two parents to produce (simultaneously) two o�spring. One can of course devise orgiastic breeding schemes that involve more than two parents and yield any number of o�spring.
24
Figure 9: Breeding in genetic algorithms. Here the process is illustrated in the context of a 2-D maximization problem (such as P1 or P2 of x1.4). An individual is
an (x� y) point, and two such parent individuals are needed for breeding (denoted P(P1) and P(P2) here). The one-point crossover and one-point mutation operators act on string representations of the parents (S(P1) and S(P2)) to produce o�spring strings S(O1) and S(O2), which are �nally decoded into two o�spring (x� y) points P(O1) and P(O2). Experience shows that this rarely improves the performance of the resulting algorithms. Sixth, f (u) must obviously be computable for all u, but not necessarily
25 di�erentiable since derivatives of the �tness function with respect to its input parameters are not required for the algorithm to operate. From a practical point of view, this can be a great advantage.
2.4 Information transfer in genetic algorithms Time to step back and revisit the issue of information processing. Genetic algorithms achieve transfer of information through the breeding of trial solutions selected on the basis of their �tness, which is why the crossover operator is usually deemed to be the de�ning feature of genetic algorithms, as compared to other classes of evolutionary algorithms (see, e.g., B#ack 1996). The joint action of crossover and �tness-based selection on a population of strings encoding trial solutions is to increase the occurrence frequency of substrings that convey their decoded trial solution above-average �tness, at a rate proportional to di�erence between the average �tness of all trial solutions including that substring in their \genotype" (i.e., the string-encoded version of their de�ning parameter set), and the average �tness of the whole population. The mathematical expression of the preceding mouthful, adequately expanded to take into account the possibility of substring disruption by crossover or mutation, is known as the Schema Theorem, and is originally due to Holland (1975� see also Goldberg 1989). As the population evolves in response to breeding and �tnessbased selection, advantageous substrings are continuously sorted and combined by crossover into single individuals, leading to an inexorable �tness increase in the population as a whole. Because this involves the concurrent processing of a great many distinct substrings, Holland dubbed this property intrinsic parallelism, and argues that therein fundamentally lies the exploratory power of genetic algorithms.
The least you should remember from Section 2:
Natural selection alone cannot lead to evolution� inheritance and variation are
also needed.
Cumulative selection can accelerate an otherwise random search process by a factor that is astronomically enormous.
Genetic Algorithms are search techniques that make use of simpli�ed forms of the biological selection/inheritance/variation triad.
Exercises for Section 2:
All exercises for this part of the tutorial aim at letting you explore quantitatively the probabilistic aspects of the sentence search example of x2.2.
26 (1) First some basic probability calculations, to warm up. (a) what is the probability of getting all of the letters wrong on an initial random trial? (b) getting at least one letter (any letter) right? (c) getting exactly one letter (any letter) right? (2) In the run of Figure 7, it took 671 iterations to get to the point of having 26 correct letters out of 27. What is now the probability of obtaining a fully correct sentence in one of the ten mutated copies after the subsequent iteration? What is the probability of all mutated copies having regressed to only 25 correct letters? (3) Given the sentence length S = 27, alphabet size A = 30, and a mutation rate p, obtain an estimate (i.e., not a formal calculation) for the number of iterations required, on average, to reach zero error. How does your estimate compare to Figure 7? Do you think that Figure 7 is a typical solution? (4) Given again a sentence length S , an alphabet size A, and a mutation rate p, calculate the error level at which the sentence search algorithm will saturate (like the dotted line on Figure 9). Use this result to estimate an optimal mutation rate as a function of S and A that will, on average, lead to convergence in the smallest possible number of iterations. (5) In terms of an analogy for biological evolution, what do you think are the most signi�cant failings of the sentence search example?
27
3. PIKAIA: A GENETIC ALGORITHM FOR NUMERICAL OPTIMIZATION
3.1 Overview and problem de nition In this section we will be primarily concerned with the comparison of genetic algorithm-based optimizers with other global optimization schemes, speci�cally iterated hill climbing using the simplex method (x1.2). To do so we �rst need to settle on a speci�c implementation of a genetic algorithm. PIKAIA is a public domain, general purpose genetic algorithm-based optimization subroutine. It is written in FORTRAN-77, is completely self-contained, and is designed to be as easy to use as the optimization subroutines found in Press et al.'s Numerical Recipes (for example their simplex routine amoeba). It comes with limited I/O capabilities and no fancy graphics. The software is described in great detail in the User's Guide to PIKAIA 1.0 (Charbonneau & Knapp 1995� hereafter PUG), to which numerous references are made in what follows. The software and User's Guide can both be obtained from the PIKAIA Web Page: http://www.hao.ucar.edu/public/research/si/pikaia/tutorial.html
This section opens with a brief overview of the operators and techniques included in PIKAIA. Internally, PIKAIA seeks to maximize a user-de�ned function f (x) in a bounded n-dimensional space, i.e.,
x � (x1 � x2� :::xn) �
xk 2 0:0� 1:0] 8k :
(12)
The restriction of parameter values in the range 0:0� 1:0] allows greater �exibility and portability across problem domains. This, however, implies that the user must adequately normalize the input parameters of the function to be maximized with respect to those bounds. The maximization is carried out on a population made up of Np individuals (trial solutions). This population size remains �xed throughout the evolution. Rather than evolving the population until some tolerance criterion is satis�ed, PIKAIA carries the evolution over a user-de�ned, preset number of generations Ng .
28 PIKAIA o�ers the user the �exibility to specify a number of other input parameters that control the behavior of the underlying genetic algorithm. The subroutine does include built-in default settings that have proven robust across problem domains. All such input parameters are passed to PIKAIA in the 12-dimensional control vector ctrl. See Section 4 of the PUG for the allowed and default values of those control parameters. The top-level structure of PIKAIA is the same as the sequence of algorithmic steps listed in x2.3: an outer loop controlling the generational iteration, and an inner loop controlling breeding. Since breeding involves the production of two o�spring, the inner loop executes Np =2 times per generational iteration, where Np is the population size (Np = 100 is the default value). All parameter values de�ning the individual members of the initial population are assigned a random number in the range 0:0� 1:0], extracted from a uniform distribution of random deviates (see x3.3 of the PUG). This ensures that no initial bias whatsoever is introduced by the initialization.
3.2 Minimal algorithmic components 3.2.1 Selection �PUG, x3.4] PIKAIA uses a stochastic selection process to assign to each individual in the population a probability of being selected for breeding. Speci�cally, that probability is made linearly proportional to the �tness-based rank of each individual within the current population. This is carried out using a scheme known as the Roulette Wheel Algorithm, as detailed in x3.4 of the PUG (see also Davis 1991, chap. 1). Note that in general it is not a good idea to make selection probability directly proportional to �tness value, as this often leads to a loss of selection pressure late in the evolutionary run, once most population members have \found" the global optimum. In some cases it can also lead, early on, to a \superindividual" being selected so frequently that the population becomes degenerate through the computational equivalent of inbreeding. The proportionality constant between �tness-based rank and selection probability is speci�ed as an input parameter to PIKAIA. The default value is 1.0. 3.2.2 Breeding �PUG, xx3.5, 3.6 and 3.7] Once two individuals have been selected, breeding proceeds exactly as in Figure 9. The encoding process requires one to specify the number of digits to be retained in the encoding process� this is a user-speci�ed quantity, which is set to 5 in all calculations reported upon here (this is also the default value in PIKAIA). Two additional quantities need to be speci�ed: (1) the crossover rate, which sets the
29 probability that the crossover operation actually takes place (default is 0.85)� (2) the mutation rate, which sets the probability, for each digit making up the de�ning string of an o�spring, that a mutation takes place at that digit location (default is 0.005). 3.2.3 Population replacement �PUG, x3.8] Under PIKAIA's default settings the o�spring population is accumulated into temporary storage, and once the number of such o�spring equals that of the current breeding population the latter is deleted and replaced by the o�spring population. This is the default strategy used by PIKAIA, although it is possible for the user to specify other population replacement techniques (see PUG, xx3.8.2, 3.8.3).
3.3 Additional components The components listed above de�ne a minimal genetic algorithm. Such an algorithm can be used for numerical optimization, but as we will soon see, turns out to be far from optimal. In what follows we refer to this algorithm as GA112. The following two simple additions to GA1 lead to an algorithm (to be referred to as GA2) that achieves far better performance on numerical optimization problems. So much better in fact that the use of these two additional components is the default choice in PIKAIA13 . 3.3.1 Elitism �PUG, x3.9] This simply consists in storing away the parameters de�ning the �ttest member of the current population, and later copying it intact in the o�spring population. This represents a safeguard against the possibility that crossover and/or mutation destroy the current best solution, which would have a good chance of unnecessarily slowing down the optimization process. Elitism in fact becomes essential upon introducing our second, vital improvement to GA1. 3.3.2 Variable mutation rate �PUG, x3.7.2] This one is perhaps the single most important improvement that can (and should!) be made to GA1. As discussed in x2.3, mutation is very much a mixed blessing� 12
For those of you who might want to run PIKAIA to reproduce the results below, GA1 is produced by explicitly setting the following elements of PIKAIA's control vector ctrl: ctrl(5)=1., ctrl(11)=0., and all other elements of ctrl to negative values to activate default options. 13 This means initializing all elements of the control vector ctrl to negative values. Note that this sets a population size equal to 100 (via ctrl(1)), and a number of generations equal to 500 (via ctrl(2)).
30 it provides the much needed source of variability through which novel parameter values are injected into the population. However, it also leads to the destruction of good solutions. This was precisely the point of Figure 8 (dotted line). Finding the exact value for the mutation rate that achieves optimal balance between those two e�ects to maximize the former while minimizing the latter is of course possible14 . However, in doing so one �nds that the optimal parameter settings often end up being highly problem dependent15 . One powerful solution to this problem is to dynamically adjust the mutation rate. The key to this strategy lies with recognizing that as long as the population is broadly distributed in parameter space, the crossover operator leads to a pretty e�cient \search" as it recombines fragments of existing solutions. However, once the population has converged |whether on a secondary or absolute optimum| crossover no longer achieves much, as it leads to the exchange of fragments that are nearly identical since all parents have nearly identical parameter values. This, obviously, is where a high mutation rate is needed to reinject variability into the population. Consider then the following procedure. At any given time, keep track of the �tness value of the �ttest population member, and of the median ranked member. The �tness di�erence $f between those two individuals is clearly a measure of population convergence� if $f is large the population is presumably distributed more broadly in parameter space than if $f is very small. Therefore, if $f becomes too small, increase the mutation rate� if it becomes too large, decrease the mutation rate again. This is how PIKAIA dynamically adjusts its mutation rate during run-time. This strategy represents a simple form of self-adaptation of a parameter controlling the behavior of the underlying genetic algorithm. Further details and implementation issues are discussed in x3.7.2 of the PUG.
3.4 A case study: GA2 on P1 It will prove useful to �rst take a detailed look at the behavior of the genetic algorithm in the context of a simple problem. Figure 10(A) shows ten convergence curves for GA2 working on P1 with Np = 50. What is plotted is one minus the 14
In fact this is often done by letting the mutation rate (and other controlling parameters of the algorithm) evolve under the control of a second, higher level genetic algorithm, with �tness being then de�ned as the performance of the genetic algorithm de�ned by those parameters on the problem under consideration. Pretty cute but, as you might imagine, rather time consuming. 15 Just as the optimal mutation rate you (hopefully) worked out in Problem 4 of x2 is rather sensitively dependent on the sentence length and alphabet size.
31 �tness value of the �ttest individual versus generation count, for 10 separate runs of GA2. Figure 10(A) should be compared to Figure 4, showing the convergence of the simplex on the same problem. Early on, the curves have qualitatively similar shapes16 � either convergence occurs relatively quickly (much more quickly for simplex, when it does converge), or solutions remain \stuck" on one of the rings of secondary extrema (cf. Fig. 2), which leads to the error leveling o� at a �xed value. Unlike simplex, however, GA2 is able to pull itself o the secondary extrema rings. It does so primarily through mutation, although crossover between two parents properly positioned in parameter space can achieve the same e�ect. Mutation being a fundamentally stochastic process, it is then not surprising to see di�erent GA2 runs requiring di�erent generation counts before the needed favorable mutation takes place. Clearly mutation plays a critical role here. Figure 10(B) shows the �tnesses of the best (solid line) and median-ranked (dashed line) individuals in the population as a function of generational count, for the GA2 run plotted with a thicker line on panel (A). The dotted line shows the variation of the mutation rate. Figure 11 shows the distribution of the population in 2-D parameter space17 , at the epochs indicated by solid dots on Fig. 10(B). To start with, note on Fig. 11(A) that no individual in the initial random population has landed anywhere close enough to the central peak for hill climbing to work. The �rst few generational iterations see the population cluster itself closer and closer to center (Fig. 11 B]), but the �tness di�erence between best and median is still quite large. The mutation decreases slightly from its initial (low) value, but then remains constant. By the 15th generation (Fig. 11 C]) most of the population has converged somewhere on the inner ring of secondary extrema (f = 0:9216), so that the �tnesses of the best and median are now comparable. This leads to a sharp increase of the mutation rate (between the 12thand 20th generations). The high mutation rate results in o�spring being knocked all over parameter space in the course of breeding (Fig. 11 D]). While some mutant individuals do land regularly on the slope of the central peak, it is only by the 55th generation that one such mutant is catapulted high enough to become the �ttest of the current population (Fig. 11 E]). Further breeding during subsequent generations brings more and more individuals to the central peak and further increases in �tness of 16
You might notice that GA2 already starts o� doing signi�cantly better than the simplex method� this merely results from the initial random population of GA2 having \sampled" 50 points in parameter space, compared to only 3 for the simplex. 17 An animation of the evolving population for this solution can be viewed on the Tutorial Web Page.
32
Figure 10: Panel (A) shows convergence curves for 10 distinct runs of GA2 on P1. As before the error is de�ned as 1 ; f (x� y). Panel (B) shows, for the single run plotted with a thicker line on panel (A), the variations with generation count of the best individual of the population (solid line), median-ranked individual (dashed line), and mutation rate (dotted line).
33
Figure 11: Evolution of the population of trial solutions in parameter space, for
the GA2 run shown as a thicker line on Fig. 10. The concentric circles indicate the rings of secondary maxima, and the larger, solid black dot is the �ttest solution of the current generation.
34 the current best via both crossover and mutation (Fig. 11 F]). Note how elitism is essential here, otherwise the \mutant" having landed on the slopes of the central peak would have a low likelihood of replicating itself intact into the subsequent generation, in view of the high mutation rate. GA1 basically behaves in exactly the same way, with the important exception that many more generations are needed for the favorable mutation to show up� this is because GA1 operates with a �xed, low mutation rate, while GA2 lets this rate vary depending on the degree of convergence of the population (cf. x3.3.2).
3.5 Hamming walls and creep mutation We are doing pretty well with GA2, but we still need to correct a fundamental shortcoming of the one-point mutation operator arising from the decimal encoding scheme of Fig. 9. Consider a problem where the sought-after optimal solution requires the following substring to be produced by the evolutionary process: ..........21000..........� decoding into the �oating point number 2.1000� now, early in the evolutionary run an individual having, say, ..........19123..........
will likely be �tter than average, and so this genetic material will spread throughout the population. After a while, following favorable mutations or crossover recombinations, the substring might look like, say ..........19994..........
which is admittedly quite close to 21000. However, two very well coordinated mutations are needed to push this towards the target 21000: the \1" must mutate to a \2" and the �rst \9" to a \0". Note that either mutation occurring in isolation, and/or mutating to a di�erent digit value, takes us farther from the target �oating point number. Mutation being a slow process, the probability of the needed pair of mutations occurring simultaneously will in general be quite small, meaning that the evolution would have to be pushed over many generations for it to happen. The population is getting \piled up" at internal boundaries of the encoding system. These boundaries are called Hamming walls. They can be bypassed by choosing an encoding scheme such that successive single mutations can always lead to a continuous variation in the decoded parameter. This is why the so-called Gray binary coding (e.g., Press et al. 1992, x20.2) is now used almost universally in genetic algorithms based on binary encoding. Another possibility is to devise mutation operators that can jump over Hamming walls.
35 Creep mutation does precisely this. Once a digit on the encoding string has been targeted for mutation, instead of simply replacing the existing digit by a randomly chosen one, just add either +1 or ;1 (with equal probability), and if the resulting digit is < 0 (because a \0" has been hit with \;1") or > 9 (because a \9" has been hit with \+1"), carry the one over to the next digit on the left. Just like in grade school. So, for example, creep mutation hitting the middle \9" with +1 in the last substring above would lead to ..........20094..........
which achieves the desired e�ect of \jumping" the wall. The one thing creep mutation does not allow is to take large jumps in parameter space. As argued before, jumping is actually a needed capability� consequently, in practice for each o�spring individual a probability test will decide whether onepoint or creep mutation is to be used (with equal probabilities). Creep mutation is not included in the original release of PIKAIA (now known as PIKAIA 1.0, although it is in version 1.2, which has been released in April 2002 (see the PIKAIA Web Page and the Release Notes for PIKAIA 1.2, NCAR Technical Note 451-STR). The results described in what follows were obtained using a modi�ed version of PIKAIA 1.0, GA3, which includes creep mutation but is otherwise identical to GA2.
3.6 Performance on test problems Time now to turn loose our algorithms on the suite of test problems of x1.4. We have three versions of genetic algorithm-based optimizers : GA1, which represents a minimal algorithm, and GA2, which is identical to GA1 but includes in addition elitism and dynamic adjustment of the mutation rate� and GA3, including creep mutation but otherwise identical to GA2. As a comparison algorithm we retain iterated hill climbing using the simplex method, as described in x1.3. As will soon become evident, GA1 is actually not a very good optimizer, so that the more interesting comparison will be among GA2, GA3, and iterated simplex. Before getting too carried away let's pause and re�ect on what we are trying to achieve here. Ideally, one wants a method that achieves convergence to the global optimum with high probability (pG > � 0:95, say), while requiring the smallest possible number of model (or function) evaluations in doing so. This latter point can become a dominant constraint when dealing with a real application, where evaluating the \�tness" of a given trial solution is computationally intensive18 . 18
Consider the helioseismic inversions described in Charbonneau et al. (1998) using a genetic algorithm� given a set of parameters de�ning a trial solution, �tness
36 Such considerations are easily quanti�ed. Let Np and Ng be the population size and generation length of a run� the required number of function evaluations, Nf , is obviously Nf = Np � Ng � GA1� GA2� GA3] (13a) while for iterated simplex Nf is the number of hill climbing trials (Nt) times the average number of function evaluations required by a single simplex run (Ns � this quantity is run- and problem-dependent):
Nf = Nt � Ns :
Iterated simplex]
(13b)
So we play the following game: we run iterated simplex and GA2 for increasing numbers of generations/iterations, and check whether global convergence is achieved� to get statistically meaningful results we do this 1000 times for each method and each generation/iteration count. This allows us to empirically establish the probability of global convergence (pG, 2 0� 1]) as a function of generation/iteration count. In doing so, to decide whether or not a given run has globally converged we use again the criteria f � 0:95 for P1, P2 and P3, and R � 0:1 for P4. The results of this procedure, applied to each test problem, is shown in Figure 12. It should be easy to convince yourself of the following: (1) on P1 and P2, both iterated simplex and GA2 perform equally well on all aspects of performance when pushed long enough to have pG > � 0:9� (2) P3 is a hard problem, and neither technique performs satisfactorily on it. Still, GA2 largely outperforms iterated simplex on global performance. (4) On P4, GA2 and iterated simplex do equally well up to pG � 0:5, but then GA2's performance starts to lag behind as the solutions are pushed to pG > � 0:95. An obvious conclusion to be drawn at this juncture is that iterated hill climbing using the simplex method makes for a pretty decent global optimization scheme. Not quite what you were expecting as a sales pitch for genetic algorithm-based optimization, right? This is in part a consequence of the relatively low dimensionality of our test problems. Recall from x1.5 that iterated simplex leads to improved performance (with respect to single run simplex) primarily as a consequence of the better sampling of parameter space associated with the initial (random) distribution of simplex vertices� given enough trials, one is almost guaranteed to have one initial simplex vertex landing close enough to the evaluation involves (1) the construction of a 2-D rotation curve, (2) a large matrixvector multiplication, (3) the calculation of a �2 against some 600 data points. This adds up to about half a CPU-second on a Cray J90. All test problems of x1.4 require very little computation in comparison.
37
Figure 12: Global convergence probability as a function of the number of function
evaluations Nf required by iterated simplex (diamonds) and GA2 (solid dots) on the four test problem (P1: dotted line� P2: dashed line� P3: solid line� P4: dashdotted line). The probabilities were estimated from 1000 distinct trials and, in the case of iterated simplex, Nf is an average over the 1000 trials. global maximum to ensure subsequent global convergence. In low dimensional search spaces, iterated simplex thus ends up being quite competitive. Figure 12 already indicates that this \edge" does not carry over to higher dimensionality (compare results for P1 and P3). GA2's performance on P2 is actually a delicate matter. Take another look at Figure 5 and consider what happens once the population has converged to the broad, secondary maximum (as it does early in the run for nearly every single trial)� for mutation to propel a solution from (x� y) ' (0:5� 0:5) to the narrow peak (x� y) = (0:6� 0:1), two very well coordinated mutations must take place simultaneously, otherwise mutant solutions end up in regions of rather low elevations and do not contribute much to the next generation. This is a low probability occurrence even at relatively high mutation rates19 , so the process takes time. GA2's global performance on P2 then results from an interplay between one-point 19
Notice on Figure 11(D)|(F) how few solutions show up in the corners of the
38 mutation and the rather direct relationship that exists here between a solution's de�ning parameters and its string representation, on which mutation and crossover operate. If the narrow Gaussian is centered on (x� y) = (0:5� 0:9), then a single mutation can propel a solution from the broad, central Gaussian to the narrow one. Not surprisingly, on this modi�ed problem GA2 outperforms iterated simplex to a signi�cant degree: pG = 0:987 with only Nf = 2500, i.e., faster than iterated simplex by a factor of 5. Encoding is a tricky business, with potentially far-reaching consequences on performance. Iterated simplex's superior performance on P4 is certainly noteworthy, yet re�ects in part the peculiar structure of parameter space de�ned by the Gaussian �tting problem, which is relatively well accommodated by the simplex method's pseudo-global capabilities. Other local optimization methods do not fare nearly as well. For a detailed comparison of genetic algorithms and other methods on �tting Gaussian pro�les to real and synthetic data, see McIntosh et al. (1998). It is really only with very hard problems, such as P3, that GA2 starts showing its worth. By any standards, P3 is a very hard global optimization problem. While on its 2-D version GA2 and iterated simplex do about as well, as dimensionality is increased the global performance of iterated simplex degrades much more rapidly than GA2. This is in fact where the power of genetic algorithm-based optimizers lies, although for search spaces of high dimensionality (n > � 20, say) the one-point crossover and mutation operators described in x2.3 are usually suboptimal and must be improved upon20 . In some sense, a fairer comparison of the respective exploratory capabilities of GA2 and iterated simplex can be carried out by setting the number of trials in iterated simplex so that the original distribution of simplex vertices samples parameter space with the same density as GA2's initial random population� in other words, using the notation of eqs. (13), we set
Nt = Np =(n + 1) �
(14)
where n is the dimensionality of parameter space, and compare the results of the resulting iterated simplex runs to some \standard" GA2 and GA3 runs. Such a comparison is presented in Table II, in a format essentially identical to Table I. Performance measures are also listed for a set of GA1 runs extending over the domain. 20
, to be released in April 2002, includes a two-point crossover operator, which generally improves performance for problems involving many parameters. See, e.g., Section 3 of the Release Notes for PIKAIA 1.2 (Charbonneau 2002). PIKAIA 1.2
39
Table II
Performance on test problems (with eq. (14) enforced) Test ProblemPerformance Iter. Simplex GA1 P1
P2
P3
P4
h1 ; f i pG hNf i Nt or Ng h1 ; f i pG hNf i Nt or Ng h1 ; f i pG hNf i Nt or Ng hRi pG hNf i Nt or Ng
0.05471
0.302
671 17 0.11583
0.353
0.0753
0.119
5000 100 0.1961
0.018
0.0071
0.914
5000 100 0.0212
0.883
0.0024
0.971
5000 100 0.0289
0.840
25000 500 0.199
50000 1000 0.039
50000 1000 0.076
5593 7
50000 1000
50000 1000
50000 1000
0.001 0.149
5000 100 0.0634
GA3
745 17 0.15547


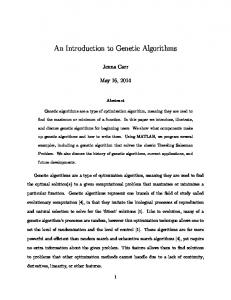


![[PDF] Download An Introduction to Genetic Algorithms ... - Google Sites](https://m.moam.info/img/260x300/pdf-download-an-introduction-to-genetic-algorithms_647788bf097c474b228c2e9e.jpg)


