Department of Computer Science, Indiana University, Bloomington Indiana, ..... The University of Virginia, The Global Bio Grid http://www.cs.virginia.edu/~gbg ...... Support for HTML processing: POST parameters can be passed from the ...
Chapter 1. An Introduction to Grids and Science Portals Dennis Gannon and Beth Plale Department of Computer Science, Indiana University, Bloomington Indiana, USA.
1. Introduction A Grid is a network of compute and data resources that has been supplemented with a layer of services that provide uniform and secure access to a set of applications of interest to a distributed community of users. The concept originated with an exploration of utility computing by Larry Smarr in 1996 [31] where he likened the concept of computing-on-demand to the electrical power grid. However, it was Ian Foster and Carl Kesselman in their seminal book [30] that laid the foundation for Grid computing as a significant branch of distributed computing. The most important examples of Grid systems have come from communities engaged in distributed scientific collaborations and many of these are described in this first section of the book. There is also now a very active industrial community that is defining Grid technology in terms of the requirements of data center management and application service provisioning. In the early days, Grid systems were built with ad hoc collections of software, but the emergence of Web Services has galvanized the community around Service Oriented Architectures (SOAs). Two organizations have emerged to help organize standard for these groups. The Enterprise Grid Alliance [3], let by Oracle is defining use cases for service frameworks for the data center. The Global Grid Forum (GGF) [4] is the older and larger organization that represents both the scientific and industrial community in defining the standards for Grid technology1. GGF is organized along a standards track and a community track. The focus of the standards track is the Open Grid Services Architecture (OGSA), which is being promoted by GGF as the future SOA for Grid systems. The community track is a forum of research groups that are looking at the role of new technologies in both the scientific and vertical market domains such as telecommunications, biotechnology and media. In this chapter we will provide a very brief, high level overview of OGSA and a discussion of the service architecture that is used by virtual organizations centered on scientific applications of Grid systems. Throughout this book we shall refer to these as Science Portal Frameworks or Science Gateway Architectures. The goal of a science portal is to provide a community of users access to scientific tools and applications that execute on the back-end Grid compute and data resources. The users should be able to use the applications as an extension of their desktop without ever knowing that there may be a massive Grid framework in the background supplying the computing power. Typically these gateways are organized around a web portal and a family of desktop tools. The portal server authenticates the user and establishes the user’s authorization to access data resources and applications. The applications often take the form of workflow templates that are instantiated and executed on the user’s behalf. As illustrated in Figure 1, the workflow engine must interact with application metadata and data services, application registries and data directories and Grid resource brokers. Notification services are used to log and monitor application progress and to create the provenance documentation needed to make computational experiments repeatable.
1
At the time of this writing, these two organizations are in the process of merging.
Fig. 1. Service Architecture for a Science Gateway Portal
2. The Science Portal Service Architecture The service architectures used in many of our science portals are based on a three layers. At the bottom we have the physical resources consisting of the computers, networks, databases and on-line instruments that make up the shared infrastructure of the Grid. The second layer consists of the core services that tie the grid together. They provide for the Grid-wide security and data and resource management necessary to viewing the physical resources as a single system. We refer to these as OGSA-like services because they correspond to components in the OGSA architecture and we provide a brief description of each in the next section. The science portals discussed in this book are based on another layer of services we call the gateway service layer. These services are designed to directly support the applications and data management tasks that the portal provides to the user community. In many cases the gateway services are built directly on top of an OGSA-like SOA, and in other cases the true Grid layer is very thin or even nonexistent. The details of the gateway service layer vary widely among the different portal implementations, but they share many common features. These include: User Authentication and Authorization. To access backend Grid resources a user must be authenticated and associated with an identity known to the Grid. There are typically two categories of users. The first group consists of those users who have their own identity that is already recognized by the Grid. These are the people who deploy and manage the applications that run on the back-end resources. They have the ability to directly authenticate with the Grid security service using a standard X.509 identity certificate which is mapped to a user account they own on each of the systems in the Grid. When they enter through the portal via a web login, the portal server can fetch a “proxy certificate” from a repository, such as the MyProxy service [myproxy] used in many grid deployments. The proxy certificate allows the portal server to carry out operations on the user’s behalf. The second class of users include people that use the portal to access and run applications and analyze data. These users may not have an identity that is known to the backend Grid, but they have been authorized to use the applications
provided by the portal by the portal managers. However to access the services they do need some form of identity and the portal must provide some mechanism to do that. A standard approach is to have the user login to the portal, which has a database of known users and information about the services that each user is authorized to access. To access the back-end resources the portal can use a proxy associated with a “community account” certificate. The combination of the community account proxy, the user’s name and authorization information is sufficient to access all the required Grid services. We discuss this topic in much greater detail in a later chapter of the book. The Metadata and Data Catalogs. Most access to science portals involves computation analysis that produces data products. Most portals provide a way for a user to save information about these data products on the Grid in a way that it can be easily accessed, searched and visualized. This is often presented to the user as a hierarchal directory tree that the user can browse, or it may also have a query search facility. Because the information stored in the service is metadata it is easily searchable. Some systems organize the user’s data as “experiments” or “investigations”, which contain data collections that are the data used in the experiment and all intermediate results. This might also include a complete log of the data provenance of the computation, so that redo the experiment or publish it as a verifiable scientific result. The metadata and data catalogs exploit an important feature of modern Grid architectures: the virtualization of data storage. The data products produced by a typical science portal experiment can be very large and require long-term storage on remote high performance storage systems. Virtualization allows us to refer to a data object by a unique identifier which, unlike a web URL, is not associated with any physical server. This name is stored in the metadata for the object. If we need to access the object a name resolver can pinpoint the objects current location and Grid data movement software can be invoked to bring it to any location where it is needed. A later chapter in the book will address these data and metadata catalog issues in greater detail. The Application and Data Registry. When an application is deployed on the Grid as a service, information about that service must locatable. An application registry provides a way for a user to search for and discover information about available application services. Such a registry can also provide a way to locate community data source services that can be used in computational experiment. The Workflow System. Most computational science portals provide a way for users to define sequences of data gathering, analysis and simulations steps that are required to conduct a scientific experiment. These sequences of actions are called a workflow, which is a high-level form of a program. When a workflow executes it may access data services that front-end on-line instruments or large data repositories to gather inputs, which are moved to the compute resources that use them with the analysis and simulation packages. The output data product of one simulation or analysis step may be needed for one or more other analysis steps. A workflow engine has the job of orchestrating the entire sequence of activities (some of which may be running concurrently on different remote resources. There are several dozen different workflow systems in use in scientific applications. Increasingly these workflow systems are based on orchestrating web services that execute applications on the user’s behalf. Typically these systems use a web portal and desktop tools such as a workflow composer and visualization tools. For example, the Taverna [23] system, which is widely used in biomedical applications, does not rely on an underlying Grid. Rather it directly orchestrates web service and other services available on the Internet. Another powerful tool to help scientists orchestrate web services and other applications is Kepler [24]. While Kepler can be used as a desktop tool to orchestrate simple services, it can also be used in a large grid-based gateway, such as the Biomedical Informatics Research Network BIRN [25]. Finally, Triana [26] is a workflow composition tool that can be used by scientists either as a desktop application, or as a component to a larger science portal framework, such as used with
the GridLab project [27]. services.
Two other chapters of this book deal with workflow and the associated web
Resource Monitoring and Brokering. When we need to execute an application on the Grid, the workflow system must answer three questions: what resources are available that have installed version of that application? What is the load on that system? How can we broker access to that resource to run the service? While Brokering and Monitoring of resources is a topic that is largely beyond the scope of this book, we note that it is an essential activity. It is also an activity that few portal users need to be concerned with. In fact, this is another illustration of the principle of virtualization. If a scientific workflow needs a component application, it is not the job of the workflow to locate the best instance of a host service to execute the program. It is the job of the brokering service to find the best resource and, on-demand, hand the network endpoint of the appropriate application service instance to the workflow. The Notification Service. In all distributed systems there must be a way for one part of the system to know what the other parts are doing. When the parts of the system are running remotely, as is the case for applications in a science portal workflow, this is extremely important. For example, when do we know that an application has terminated? When has an error occurred that may require terminating the workflow? How do we find out if new data is available from an on-line repository? The way that this is done is by means of an event notification system. The most common architecture is based on a publishsubscribe system that allows any process running on the Grid to notify the world that something interesting has happened. It does this by encapsulating the message as a small XML document and sending it to a notification broker web service. There are currently two standards for such a service: the WS-Eventing web service model and the WS-Notification standard. In both cases it is possible for the publisher of the event to tag it with a “topic” which can be used by event listeners to filter out items they are interested in. Event listeners contact the broker and subscribe to the event stream by providing a list of topics that interest them. When a new event message comes in, the broker looks at topic and send a copy to every listener that has that topic on their subscription list. The notifications from the service components of a workflow are an essential part of the coordination and synchronization of the workflow. From the perspective of the portal, the messages from the workflow components can be of great interest to the users who like to monitor progress of their experiments. Consequently one subscriber to the notification stream is usually the data catalog service, which can store the notifications as part of the metadata for the experiment. If the notifications form a complete record of the history of the computation, they are also an essential part of the provenance of the data.
3. The Open Grid Service Architecture In the preceding section we describe the key service components that the portal gateway architecture uses to allow users to do science on the Grid. In most Grid deployments, these services reside on top of the core services provided by the Grid. The Open Grid Service Architecture (OGSA) is a product of the Global Grid Forum OGSA-WG led by Hiro Kishimoto. The first specification of OGSA [6] can be viewed as a profile for the organization of a standard Grid. OGSA contains six families of services which, when properly integrated, deliver a functioning Grid system. It must be noted that, at the time of this writing, there are no official implementations of OGSA, because the details of a basic service profile is still being developed. However, understanding the six core components can be a useful way to understand how Grid systems differ from other SOAs. We describe each of these service classes below.
3.1 Execution Management Services Most Grid systems must manage the execution of computing tasks on the resources that comprise the Grid. OGSA models execution management in terms of three classes of services: Resources, Job
Management and Monitoring, and Resource selection. The Resource services describe service containers and persistent state handlers. The Job Manager handles the full lifecycle of the execution of a set of jobs. It interacts with task queues on each computation resource as well as the other services involved in resource brokering and resource monitoring. The resource selection services consist of execution planning, which build schedules of jobs and resources, candidate set generation services, which produce the likely resources for running a particular job or set of jobs, and reservation services which interact with accounting and authorization systems. One interesting outcome of this work has been the Job Submission Description Language that is a schema for describing jobs. JSDL [7] is being used by a variety of Grid projects including the large Japanese Grid project NARAGI [9] and GridSAM [8] from the London eScience Centre and the Open Middleware Infrastructure Institute [10].
3.2 Data Services OGSA data services are intended to address the movement and management of a number of different data resources. These include the standards such as flat files, data streams and relational, object and XML databases. But they are also concerned with derivations, i.e. data that is derived by queries or transformations on other data, and Data services such as sensors. The types of activities that must be supported by the data services include remote access, staging, replication, federation, derivation and metadata generation and management. In addition, these capabilities are to be presented to the user in the form of virtualized services that hide the different implementations that are required to support different media and low-level data types. Virtualized services are a way to realize in practice the distributed systems notion of “access transparency”. The OGSA working groups involved with defining the specific data services are still hard at work. However, there are important pieces that are currently in use. One important component is OGSA Data Access and Integration [11], which establishes the definition and development of generic Grid data services providing access to and integration of data held in relational database management systems, as well as semi-structured data held in XML repositories. Another important contribution is the replica location service provided by the Globus toolkit GT4.
3.3 Resource Management Services There are three categories of resource management that are of concern to OGSA. First there are the actual physical resources: computers, networks, storage systems and instruments. At the lowest level this management is done through standard protocols and frameworks like CIM and SNMP. But OGSA stipulates that there is another intermediate level where a common interface and approach is needed. This is where the Web Service Resource Framework (WSRF), a proposed standard, is most appropriate because it gives a standard way to discover and interrogate services that interact with the management interface of each resource. WSDM, Web Services Distributed Management, is an additional tool that OGSA envisions using for this activity. The second class of resource management involves resources of a Grid such as resource reservation and monitoring. The third class is the management of the OGSA infrastructure itself. There are two type of interfaces to these management services: functional interfaces, which accomplish tasks such as creating or destroying a job, and manageability interfaces, which provide the mechanisms to manage a capability, such as monitoring a job manager. In general, these services provide resource reservation, monitoring and control of resources, virtual organization management, problem determination and fault management, metering and policy management.
3.4 Security Services The OGSA security services are designed to make it possible to enforce the security policies of a particular Grid and its member organizations. OGSA postulates the existence of six services: a credential validation service, a trust service, an authorization service, an attribute service, an audit service and a
bridge translation service. Though OGSA does not yet precisely defined these services they stipulate that the services must support the following capabilities: • Authentication. The credential validation and trust service should be able to verify an identity assertion. • Identity Mapping. The trust, attribute and bridge translation service should enable the translation of an identity that is valid in one domain within the Grid into an identity that is valid in another domain within the same Grid. Authorization should be provided by the authorization service. The audit service tracks security-relevant events and is policy driven.
3.5 Self-Management Services An important concept in OGSA is that interactions between users and services are largely based on Service Level Agreement (SLA), which are documents that govern the way transactions are carried out. For example, when submitting a job, a user negotiates the jobs priority, a guaranteed completion time and required resources with a service level manager to arrive at a working SLA. Self-management services automate the tasks of configuration, healing and optimization needed to keep the Grid operating correctly and meeting its SLAs. The service level management services operate by monitoring load and utilization of resources and the running state of the other services. Based on the monitoring data, the management services must do an analysis to make sure that all the SLAs can be satisfied. If not, the management services must adjust priorities or provision additional resources.
3.6 Information Services Information services provide the mechanisms for the other Grid services to learn about dynamic events used for status monitoring and directory information that is used to discover services and logged data. The information services are typically based on a web service publish-subscribe event notification system such as WS-Eventing or WS-Notification. But dynamic directory and query services also play a critical role. A closely related and important concept is that of naming. OGSA assumes a three level naming systems in which the top-level is a human readable name. The middle level is a persistent abstract unique identifier. The lowest level is the actual address (or addresses) of the object being named. For example, a Grid notification may state that a new resource exists identified by its abstract unique name. A user or another service can use a name resolver service or directory to obtain an address for this object. A human user can use the directory services to discover entities that correspond to a particular human readable name.
4. Actual Grid Systems OGSA is still a work in progress, so there are no certified implementations. However there are a number of software stacks that are available that are used in different Grid deployments and many of these contain many of the features of OGSA. Several of these are available as open source systems and are used extensively in the scientific community. The Globus Toolkit GT4 [12] is the most frequently used. It contains elements of all of the OGSA core service areas except for self-management. It will be used as the core service layer for the National Science Foundation TeraGrid project [5]. It is also used in the bioinformatics Grid GeneGrid [13], and GridCast [14], a Grid to support the delivery of multi-media for the BBC. The Laser Interferometer Gravitational Wave Observatory (LIGO) [15] uses GT3, the previous version of Globus. GT3 is also used in the Network for Earthquake Engineering [1] and Cancer Biomedical Informatics Grid caGrid [16]. On a closely related topic, the Earth Systems Grid [29] provides an excellent portal that provides access to tools for climate research. Unlike some of the others, it is based on a substantial Globus-based Grid foundation.
Another SOA for Grids, gLite [17], developed by CERN, supports research in high-energy physics. gLite is used in the “Enabling Grids for E-SciencE” EGEE project [18] and the LHC Computing Grid [19]. Another large Physics project is the Open Science Grid OSG [20], which uses elements of GT4 and gLite. The Legion system, which is one of the oldest software platforms for Grid computing is being redeveloped as a web SOA by the University of Virginia and is being used in the Global Bio Grid [21]. Another early OGSA-like Grid is Discovery Net [22]. In addition to these OGSA-like SOAs used in large science Grids, there are several commercial products that are available and in use in the enterprise computing sector. We expect that many of these will evolve into close compliance with OGSA.
5. The Science Portals Examples. The remainder of this section of the book is devoted to short chapters that describe some of the most significant science portal projects that have been deployed in the last five years. The first of these is the NEESGrid portal. NEESGrid is the Network for Earthquake Engineering and Simulation Grid and the portal that sat in front of it was the first major science portal designed to enable a specific scientific community to access a set of important shared physical resources. In this case the community was earthquake engineers and the shared resources consisted of their advanced instruments used to test the response of various structural designs to severe shocks and vibrations. The NEESGrid portal included tools to allow users to directly manage and view and review physical experiments on one of the experimental systems. The portal had tools to manage the vast amounts of data that that these experiments generated and it had components to interact with and visualize results from remote simulations. The LEAD project is devoted to advancing atmospheric science in the area of meso-scale storm prediction. The lead portal is based on a direct instantiation of the architectural services described in section 2 of this chapter. The LEAD portal users are able to create in-silico experiments by selecting a geographical region of interest, associated on-line data sources such as radar or other ground or airborne sensors, then design a workflow and execute it with the results automatically stored and metadata generated and saved in the users private metadata catalog. The portal itself is an instance of the technology described in greater detail in the rest of this book. Chapter 4 describes the Telescience Portal project. The origins of this project are in building a tool for the remote control of bio-imaging instruments such electron microscopes. However, that effort evolved into a grander design that mirrors the architecture described here. The portal itself is based on the GridSphere platform described in this book and the workflow system is based on the Pegasus-Condor framework [petasus] used in many Grid applications. The telescience portal framework has evolved into an architecture that is also very similar to what has been described here. The GEON portal is described in chapter 5. The Geon portal is the front end to the GEOsciences Network, which is a Grid of 16 different institutions. The Geon infrastructure is based on the same basic service architecture described above, but like the others, it provides a specific set of core services that provide added value to its client base. For example, GEON has an Ontology portlet, a Resrouce Registration portlet, a Search portlet for resource discovery, a Workbench and Map Integration portlet for spatial data mapping and visualization and event/station/waveform extraction tools. The GEON portal allow users to register and discover data for the geosciences through the GEON meta-catalog server with distributed data storages, organize their work into the workbench place, and do the map integration with available data.
Chapter 6 describes the Bioportal, which is a tool to access biological and biomedical data and tools. Built on the standard portal technology and grid infrastructure described in this book, the Bioportal provides access to over 140 applications codes used in education and research. In addition they provide access to about a half a terabyte of biomedical data. An important feature of the Bioportal is the ease with which new applications may be integrated. A simple xml description of the application is sufficient to allow the automatic generation of a user interface that is plugged directly into the portal. The QuakeSim and SERVOGrid portal is the subject of chapter 7. The Solid Earth Virtual Observatory (SERVO) is devoted to earthquake science. The portal integrates the simulation and analysis codes with the data mining tools needed for analyzing data produced by sensors equipped with global positioning capabilities. The core architecture of the Grid and portal is very similar to the framework presented here. However, as with the other portals, SERVOGrid has several unique features. For example, to manage workflow the portal make extensive use of the Apache Ant task management facilities. Another unieque feather is SERVOGrid is the first to introduce AJAX technology into the science portal world. AJAX is a technology that greatly enhances the way humans can interact with web applications and we describe how this is done in a later chapter of this book. Finally, the Cactus portal, described in Chapter 8, has been designed for a community of theoretical/computational physicists who use massive computing resources to test the predictions of the theory of Relativity. The portal is a front-end to a set of Grid gateway services that are similar to many discussed here, but the core of the Cactus system is the Cactus application framework, provides researchers with a modular architecture for constructing their scientific applications that allows them to easily plug-in modules built by other research groups and contribute their developments to the wider community. While it was built for experiments such as black hole simulation, the framework is very general and it is being used by other application groups. There are a number of other important science portals not described here and more are appearing every day. The portals described here are all very similar in architecture; both at the user-level portal server and the back end gateway services. In fact, they are close enough that the entire gateway architecture and its component services could be standardized and supported by the community or the private sector. Throughout the rest of this book we describe both of these software layers in substantial depth. While the concept of the science portal has had a great impact on the use of Grids in science, it is also very applicable to any enterprise that needs to simplify access to resources and applications for a community of users.
References 1. Network for Earthquake Engineering http://it.nees.org/ 2. The Particle Physics Data Grid. http://ppdg.net 3. The Enterprise Grid Alliance. http://www.gridalliance.org/en/index.asp 4. The Global Grid Forum. http://www.ggf.org 5. NSF Teragrid Project, http://www.teragrid.org/ 6. Foster, I., Berry, D., Djaoui, A., Grimshaw, A., Horn, B., Kishimoto, H., Maciel, F., Savva, A., Seibenlist, F., Subramaniam, R., Treadwell, J., Von Reich, J.: The Open Grid Service Architecture, V. 1.0, www.ggf.org/ggf_docs_final.htm, GFD.30. July 2004. 7. Global Grid Forum, Job Submission Description Language. Draft specification available at http://forge.gridforum.org/projects/jsdl-wg 8. GridSAM – Grid Job Submission and Monitoring Web Service, http://www.lesc.ic.ac.uk/gridsam/
9. Matsuoka, S., Shimojo, S, Aoyagi, M., Sekiguchi, S., Usami, H., Mura, K., Japanese Computational Grid Project: NAREGI. Proc. IEEE vol. 93, no. 510, 2005. 10. Open Middleware Infrastructure Institute, http://www.omii.ac.uk 11. Antonioletti, M., Atkinson, M., Baxter, R., Borley, A., Chue Hong, N., Collins, B., Hardman, N., Hume, A., Knox, A., Jackson, M., Krause, A., Laws, S., Magowan, J., Paton, N., Pearson, D., Sugden, T., Watson, P., and Westhead, M.: Design and implementation of Grid database services in OGSA-DAI, Concurrency and Computation: Practice and Experience, Vol. 17, No. 2-4, Feb-Apr 2005, pp. 357-376. 12. The Globus Project: GT4. http://www.globus.org/toolkit/. 13. Jithesh, P., Kelly, N., Donachy, P., Harmer, T., Perrott, R., McCurley, M., Townsley, M., Johnston, J., McKee, S.: GeneGrid: Grid Based Solution for Bioinformatics Application Integration and Experiment Execution. CBMS 2005: 523-528 14. Belfast e-Science Center, http://www.qub.ac.uk/escience/projects/gridcast. 15. Laser Interferometer Gravitational Wave Observatory, http://www.ligo.caltech.edu 16. William Sanchez, Brian Gilman, Manav Kher, Steven Lagou, Peter Covitz, caGRID White Paper, https://cabig.nci.nih.gov/guidelines_documentation/caGRIDWhitepaper.pdf 17. Light Weight Middleware for Grid Computing, http://glite.web.cern.ch/glite/ 18. Enabling Grids for E-SciencE, http://public.eu-egee.org 19. LHC Computing Grid, http://lcg.web.cern.ch/lcg/ 20. Open Science Grid, http://www.opensciencegrid.org/gt4 21. The University of Virginia, The Global Bio Grid http://www.cs.virginia.edu/~gbg 22. Al Sairafi, S., Emmanouil, S., Ghanem, M., Giannadakis, N., Guo, Y., Kalaitzopolous, D., Osmond, M., Rowe, A., Syed I., and Wendel P.: The Design of Discovery Net: Towards Open Grid Services for Knowledge Discovery. IInternational Journal of High Performance Computing Applications. Vol 17 Issue 3. 2003. 23. Oinn, T., Greenwood, M., Addis, M., Ferris, J., Glover, K., Goble C., Hull, D., Marvin, D., Li,, P., Lord, P., Pocock, M., Senger, M., Wipat, A. and Wroe, C.: Taverna: Lessons in creating a workflow environment for the life sciences. Concurrency and Computation: Practice & Experience, Special Issue on Scientific Workflows, to appear 2005. 24. Ludaescher, B., Altintas, I., Berkley, C., Higgins, D., Jaeger-Frank, E., Jones, M., Lee, E., Tao, Zhao, J.: Scientific Workflow Management and the Kepler System. CC:P&E, Special Issue on Scientific Workflows, to be published 2005. 25. Grethe JS, Baru C, Gupta A, James M, Ludaescher B, Martone ME, Papadopoulos PM, Peltier ST, Rajasekar A, Santini S, Zaslavsky IN, Ellisman MH. : Biomedical informatics research network: building a national collaboratory to hasten the derivation of new understanding and treatment of disease. Stud Health Technol Inform. 2005;112:100-9. 26. Churches, D., Gombas, G., Harrison, A., Maassen, J., Robinson, C., Shields, M., Taylor, I., Wang, I.: Programming Scientific and Distributed Workflow with Triana Services. CC:P&E, Special Issue on Scientific Workflows, to appear 2005. 27. The GridLab Project. http://www.gridlab.org/ 28. Aktas, M., Aydin, G., Donnellan, A., Fox, G., Granat, R., Lyzenga, G., McLeod, D., Pallickara, S., Parker, J., Pierce, M., Rundle, J., and Sayar, A.: Implementing Geographical Information System Grid Services to Support Computational Geophysics in a Service-Oriented Environment. NASA Earth-Sun System Technology Conf., June 2005 29. Bernholdt, D., Bharathi, S., Brown, D., Chanchio, K., Chen, M., Chervenak, A., Cinquini, L., Drach, B., Foster, I., Fox, P., Garcia, J., Kesselman, C., Middleton, M. VNefedova, V., Pouchard, L., Shoshani, A., Sim, A., Strand, G., and Williams, D.: The Earth System Grid: Supporting the Next Generation of Climate Modeling Research. Proc. IEEE, vol. 93, no. 485, 2005 30. Plale, B., Gannon, D., Huang, Y., Kandaswamy, G., Lee Pallickara, S., Slominski, A.: Cooperating Services for Data-Driven Computational Experimentation, Computing in Science & Engineering, IEEE Computing in Science and Engineering, vol 7, no. 5, pp. 24-33, 2005.
31. I. Foster, and C. Kesselman, The Grid: Blueprint for a New Computing Infrastructure, Morgan Kaufmann, San Francisco, 1999. 32. L. Smarr, “The Coming of the Grid.” Presentation, 1997. http://www.jacobsschool. ucsd.edu/~lsmarr/talks/Grid/index.htm
Chapter 2. NEES - Network for Earthquake Engineering and Simulation Charles Severance and Tomasz Haupt Experimental facilities and simulations are a critical resource in the advancement of the science of preparing buildings, roads, and other infrastructure to withstand earthquakes, tsunamis, and other natural disasters. Early engineering analysis work was done with models and simple simulations that can easily be done on spreadsheets. In order to improve the fidelity of the research results, it has been necessary to evolve to testing full-scale specimens and simulations using first-principles analysis that require supercomputers to execute. Also, to test massive structures for which no experimental facility can be constructed, the field of pseudo dynamic analysis has developed where powerful multi-axis actuators manipulate a full-scale portion of a structure while the remaining structure is simulated in a supercomputer. This pseudo-dynamic approach requires distributed control techniques with the simulation literally "in the loop" of the physical experiment. The George E. Brown Network for Earthquake Engineering and Simulation (NEES) was funded to install a diverse set of the most advanced experimental facilities at fifteen of the leading universities with the express condition that the facilities were to be shared by the entire field. This way, researchers at all universities could benefit from these state of the art facilities as well as having the ability to produce collaborative research efforts that could use resources from multiple facilities. The NEES project awarded fifteen experimental facilities that covered the earthquake engineering and tsunami research areas. These facilities included shaking tables to simulate earthquakes, centrifuges to allow model-scale soil behavior experiments to be run, field-test equipment, pseudo dynamic facilities to allow the full-scale testing of structural components, and wave tanks to test tsunami experiments. These facilities were awarded to leading structural engineering research programs in the US including: Oregon State University, Rensselaer Polytechnic Institute, University of Buffalo, University of Colorado at Boulder, University of Minnesota, University of Nevada at Reno, University of Texas at Austin, and the University of California campuses at Berkeley, Davis, San Diego and Los Angeles.
2.0 NEESgrid - The NEES Software Infrastructure A critical element of the NEES project was to develop the software that would connect the experimental facilities, researchers, and data so as to integrate the distributed NEES facilities into a single unified resource to enable structural engineering to make significant progress. The project to produce this IT infrastructure was called NEESgrid and lead by the National Center for Supercomputing Applications (NCSA). The NEESgrid project included a team from: Argonne National Laboratory, Information Sciences Institute (ISI), and University of Michigan. As the project progressed, the Stanford University, University of California Berkeley, Pacific Northwest National Laboratory (PNNL) and Mississippi State University were added as collaborators. The NEESgrid software was designed to meet a number of important use cases. •
The need for a distributed control system with high security and high performance allowing experiments to be performed using multiple facilities and to allow physical facilities to be connected with simulations running "in the loop" to effect pseudo dynamic experiments.
•
The need for a distributed telepresense and telecontrol system, allowing researchers to monitor, control, and participate in experiments regardless of location. This telepresense system needed to be able to handle simultaneous video and data channels and provide the ability to analyze these channels in a single interface. The telepresense system effectively needed to be a large Tivo-like system capable of synchronized display of numerous control, data and video channels.
•
The need to retain experiment and important simulation data for very long periods of time with complete representation of the metadata that surrounds the data. It is quite common for an experiment to cost hundreds of thousands of dollars to setup and perform. Since many experiments ultimately destroy the specimens, it is important that all possible data be retained and fully described for possible re-analysis in the future as new models or new approaches are discovered. The re-analysis of data can lead to new discoveries or can be used to validate whole new models and approaches going forward.
•
The need to provide a collaborative framework to allow researchers to work together to collaborative design experiments, operate experiments, and collaboratively analyze and publish the results. A critical aspect of the collaborative environment was to be able to record and capture the collaborative activity with appropriate metadata so it could be kept as part of the longterm archival of the experimental data. Having access to the human interactions related to each experiment allows future researchers to gain a far richer picture of the context in which the data was produced than simply looking at the data itself.
•
Rich integration of simulation into the experimental process. This fell into two areas - one area was the use of simulation software as part of a pseudo dynamic experiment. A second major area was to enable users to run simulations on data stored in the repository. These simulations may use experimental data, results of other simulations, or sensor data such waveforms recorded from actual historical seismic incidents.
•
The need for the ability to publish results to both the researchers in the field as well as the general public as part of an education and outreach thrust.
These use cases were used to design the NEESgrid architecture and implement the NEESgrid software according to the NEESgrid Architecture.
3.0 NEESgrid Architecture and Software This section covers the major elements of the NEESgrid architecture and the software that was used to implement the architecture. In nearly all cases, NEESgrid adapted and integrated technology that already existed to satisfy the needs of the NEESgrid architecture.
3.1 Basic Architecture The overall architecture consisted of placing a local server at each of the NEES installations. This server was called the NEESPOP (Point of Presence). The NEESPOP insured that a consisted of software and services were available at each NEES site. The NEESPOP systems were designed to communicate with each other as well as the central NEES data repository. Each NEESPOP also included a local collaborative portal allowing researchers to work together, sharing documents for each experiment or project. In addition to the distributed NEESPOP servers, NEESgrid had several central functions. Since NEESgrid used the Glo0bus Toolkit for its security, a central certificate authority was used to issue accounts to NEES researchers providing the researchers a unique identity that worked across all of the NEESgrid systems regardless of which facility the researcher was from. Each NEESPOP included support for the Network Weather Service and there was a central facility to monitor the health of the network and the health of each of the software elements on the NEESPOPs at each site.
3.2 Data Architecture Much of the effort around NEESgrid went into its data handling. There was a need to handle large volumes of real time data from sensors (data, video camera, still camera, and microphones) and allow that data to be viewed in real time both locally and remotely. In addition there was a need for a Tivo-like capability to allow the replay of recent data in slow motion or completely stopped to analyze recent data and make decisions as to how to steer the experiment going forward. Since many experiments test their specimens to destruction, it is important to steer long-running experiments to get the most useful data before the specimen is destroyed. A freely available commercial product called Data Turbine from Creare, Inc provided the real-time and replay capability.
To store the data after the experiment was done, the data and metadata are moved from the Turbine to the local data repository in the NEESPOP. As appropriate, this data could also be moved to the NEES Central for long term archival. This data was then available for simulation activities or other analysis. The results of simulation analysis could also be returned to either the local or central repository. To support the migration of the data and associated metadata with versioning and support for dynamic model changes over time, a specialized repository was developed which supported two grid based services were developed to provide access to the local and central repository: NEES File Management Services (NFMS) and NEES Metadata Service (NMDS). These services used the distributed Globus authentication and provided fine-grained access controls to the data stored in the local and central repositories. By using Globus protocols, NFMS and NMDS allowed access to the data from any Globusenabled system as long as the proper user credentials were available.
3.3 Data Modeling Part of the goal of the data architecture was to retain data for many years to allow re-analysis of data that is far too expensive to re-create. As such, it was very important to record sufficient metadata associated with the data so as to best understand the meaning of the data in any future re-analysis. The goal was to initially produce a data model that could be used for a wide range of NEES experiments, and then allow the data model to evolve over time as additional data elements are needed. A critical feature of the NEES repository software was to allow the data model to change over time and insure that the data and metadata would always remain relevant to the most up-to-date model. A semantic approach was used to develop the NEES data model. The data model team used Protégé to produce an RDF/OWL data model that covered a wide range of experiment types. This model was placed into the NEES repository and metadata tools were developed to allow users to create and/or edit metadata using the NEESgrid portal.
3.3 Distributed Control and Telecontrol The two requirements are to allow remote users to participate in the operation of experiments, placement of sensors, or the manipulation of specimens and to enable simulation code to be integrated into a physical experiment in near-real time (pseudo-dynamic experiment). The NEESgrid team developed a set of Globus services called NEES Teleoperation Control Protocol (NTCP). Because NTCP was designed to perform control operations on powerful and expensive hydraulic equipment it was important that NTCP be carefully designed. NTCP has a significant number of features aimed at security, reliability, safety, robustness, and the ability to cope with failure cases. NTCP supported a plug-in architecture that allowed each of the NEES sites to develop the necessary code to plug their local control systems into NTCP. A series of plugins were developed as part of NEESgrid to allow the OPENSEES simulation environment to be integrated directly into NTCP. This allowed OPENSEES simulation code to operate as part of a distributed pseudo-dynamic experiment.
3.4 Collaborative Environment An important part of the NEESgrid architecture was software to allow the users to collaborate as they worked together in preparing proposals, preparing experiments, performing experiments, or analyzing results. The CHEF software (based on Apache's Jetspeed portal technology) was used to provide this collaborative environment as well as to act as a portal running at each of the NEESPOP systems and the central NEES repository. CHEF provided a basic collaborative tool kit including schedule, document sharing, threaded discussion, chat, and other tools. The CHEF environment was enhanced by the addition of a laboratory notebook developed as part of the Collaborative Multi Scale Chemistry (CMCS) project. The collaborative environment allowed the full export of all of the collaborative activity into a rich XML format. When an experiment was complete, this collaborative data could be archived right along with the actual experimental data allowing future researchers to have access to collaborative data as well as the experimental data.
3.5 Simulation Portlet The NEES Simulation Portlet provides an easy-to-use interface allowing users to use the Open System for Earthquake Engineering Simulation (OpenSees) [7]. OpenSees is a software framework for simulating the seismic response of structural and geotechnical systems.
3.6 NEES Simulation Portlet To use the simulation portlet, the builds their simulation using one or more OpenSees scripts and input data sets. The scripts can be downloaded from the NEESgrid script repository, uploaded from the user's
desktop, or just typed in the built-in OpenSees script editor. The next step is the customization of the scripts, either by setting the scripts’ parameters through the porlet, or by the manual editing of the scripts. The built-in OpenSees script parser verifies the correctness of the script syntax as the script is typed. In addition, if the commands pertaining to the modeled structure are added or modified the changes in the structure design are visualized in real time. If the user selects a particular element of the structure by clicking on it, the line of the script that defines it is highlighted (see the Figure). The portlet also provides tools for selecting and uploading input data sets either from the NEES repository or the user’s desktop. Once the scripts are customized and the data is prepared, the simulation is ready for submission. The portlet stages the scripts and data sets to the OpenSees computational server and the scripts are executed. The simulations run asynchronously so there is no need for the user to wait until the simulation completes. The user may submit any number of simulations to be run concurrently. The portlet does support active monitoring of the simulation progress if the user prefers to monitor the simulation. Once the simulation is complete, the user may preview the results including animations of the results and download them for a detailed analysis. Since all information needed to submit a simulation (“the simulation provenance”) is stored in the user space, the subsequent simulations can be created by incremental modifications of the previous ones, without the need of re-create the scripts or input data sets. By default, all user scripts and data are private (that is, not accessible for other users). However, at the user discretion, they can be shared by uploading them to the NEESgrid repository.
4. Education and Outreach In order to serve both as a test-bed and demonstrator for NEESgrid capabilities a one-sixth scale version of a six-axis hydraulic actuator was developed and integrated into the NEESgrid software environment. This was a complete functioning small-scale NEES Experimental site including hardware, software, and experimental equipment. The equipment was demonstrated at the 13th World Congress on Earthquake Engineering as well as at the NEES grand opening at NSF headquarters.
NEESgrid Data Analysis Portlet viewing data from the 13WCEE Demonstration The NEESgrid project worked closely with NIED project from Japan to help align efforts between the NEES experimental facilities and the Miki shake table in Kobe Japan as well as other earthquake
engineering research efforts in Japan. This work was done in several meetings (one in Japan and one in Washington DC). The NEESPOP distribution included a series of web pages and Java Applets that allowed simple earthquake simulations to be performed. Guests coming to a NEESPOP could use these simulations without requiring any account. The grid-enabled portal that was produced for NEESgrid was generalized and adapted to form the basis for the Open Grid Computing Environment (OCGE) portal toolkit Release 1.0 which was one of the National Middleware Initiative (NMI) projects.
Chapter 3. Atmospheric Sciences and a Portal for Predicting Tornadoes: the LEAD Project Portal Marcus Christie, Indiana University, Bloomington, Indiana. Extreme weather conditions wreak havoc on individual human lives and the global economy. Recent times have provided several high profile reminders of the devastating effects of mesoscale weather. The 2005 Atlantic hurricane season broke several records, including having the most named storms and hurricanes. The most prominent of these storms for the United States was Hurricane Katrina, which caused more than $100 billion in damages and caused the loss of well over 1000 lives [USAToday20051129]. On a smaller scale of destruction, a tornado tore through the Ohio River Valley along the Kentucky-Indiana border on November 6, 2005, killing 22 people [USAToday20051106]. Unlike Katrina which developed and was tracked over several days, this tornado developed over a much shorter time scale. Tornado warning sirens went off about 15 minutes prior to the tornado actually striking. One of the expected outcomes of the Linked Environments for Atmospheric Discovery (LEAD) project is to harness the power of the national cyberinfrastructure in a dynamically adaptive manner that would allow forecasters more timely and more accurate forecast of tornadoes and other massively destructive storms [Kelvin2005]. Current forecasting system operate in static configurations that aren’t able to adapt to geographical areas where severe weather systems are developing. Traditional forecasting systems are also not capable of taking advantage of additional resources as needed. To take the November 6 tornado case above as an example, the LEAD Project will enable weather forecasters to create small domain, finegrained forecasts over the area in question, in this case, the Ohio River Valley. Grid resources needed for this forecast will be automatically discovered and appropriated; as necessary, this high priority computational task will preempt existing jobs running on selected compute clusters. In addition, workflows created to orchestrate the forecasts will be able to dynamically adapt to changes in the storm system as well as changes in the availability of grid resources. The two high level goals of the LEAD Project are first, to enable technologies and people to interact with the weather, and second, to democratize access to advanced weather forecast and analysis tools. The LEAD Portal is a web based portal designed to address both of these goals, by providing access to tools that allow users the ability to find, visualize, and analyze data and to construct, execute, and monitor workflows. In addition, the LEAD Portal will provide skill level appropriate user interfaces and education materials to empower a broader community of users with the opportunity to create and analyze weather forecasts.
1. Core Capabilities The LEAD Portal provides several key services to weather researchers for discovering and managing data, for creating and configuring grid workflows, and for managing security authorizations. In addition, the portal provides access to educational modules developed by the LEAD Education team, which integrate with these portal capabilities to provide an interactive, immersive learning environment for meteorology students (an example of an education module is one about how to identify weather fronts).
1.1 Data Management There are two main data management tools in the LEAD Portal. The first one, the Geo Reference GUI, is the main entry point for exploration. Once loaded, a map of the continental United States is presented.
The Geo Reference GUI is based on the Minnesota MapServer web mapping software, and so can present several layers of information on the displayed map, such as state boundaries, rivers, lakes, and even current meteorological conditions such as temperature. Different maps and layers can be selected, and there is the capability to zoom in and out. The purpose of the Geo Reference GUI is to create queries for meteorological data. A bounding box can be selected over a region of interest on the map user interface. In addition to this spatial constraint, a temporal range can be specified. Queries can be restricted to specific data products or data categories (making use of ontology services). Finally the query can be executed. Data products matching the query are listed, each with the option to download, visualize or import into that user’s personal workspace. The other main data management tool is the MyWorkspace portlet. This portlet provides a view of a user’s personal LEAD workspace, which is a private data space where data and workflows can be stored and organized. The MyWorkspace portlet interfaces with the MyLEAD service [Plale2005] which provides a personal metadata catalog for each user. The contents in a user’s workspace are displayed hierarchically in the portlet, employing a familiar file browser like UI paradigm. Displayed here will be a user’s data that has been imported from the Geo Reference GUI, as well as data that has been produced by the user’s workflows. This workspace also stores workflow scripts and configurations used, as well as a log of each workflow’s execution. The MyWorkspace portlet also provides an interface that allows the user to publish and share data and workflows with all or certain sets of users.
1.2 Execution Management There are two main execution management tools provided, the Experiment Builder Portlet and the Workflow Composer application. In LEAD parlance, “experiments” are essentially workflows that have been configured and executed on the grid. The purpose of the Experiment Builder Portlet is to provide an interface for creating and configuring experiments. When creating a new experiment, the user will specify a name, description and a workflow to be executed. This portlet then reads in the selected workflow and figures out what is required for this workflow to be configured and instanced. Interfaces for configuring these workflow parameters are presented to the user. Once configured, the workflow can be launched on the grid. The Workflow Composer is a Java WebStart application that can be invoked from within the portal. The Workflow Composer begins by getting a list of application components from registry services. These application components, which are web services, can be dragged and dropped onto a palette, and their inputs and outputs can be wired together to produce a workflow describing the data flow between application components. Workflows created by the Workflow Composer can be saved to the user’s workspace as BPEL scripts and then used by the Experiment Builder Portlet for configuring an instanced workflow.
1.3 Security Management Before the user can launch a workflow on the grid, he or she must first obtain security credentials and authorizations required by the workflow for invoking each application component. To this end, the LEAD Portal provides users with two different security tools. The Credential Management Portlet provides users with the capability to request an identifying certificate. Once this is granted, the user will have an X509 certificate that can be used to authenticate the user to services in the LEAD system. The Capability Manager portlet provides an interface by which users can request capabilities to use specific application components, or additionally and more commonly, they can request to be added to one or more authorization groups.
2. Portal Architecture 2.1 Framework The LEAD Portal is built on top of using the GridSphere [GridSphere2005] framework, an open source, Java based web portal that provides a Java Portlet Specification [JSR168] compliant portlet container in which the LEAD portlets run. Additionally, we make use of the OGCE framework [OGCE2005] for easing grid portal development. The Java portlets are implemented as web service clients (using the XSUL toolkit [XSUL2005]) to LEAD web services, and where they need to interact with grid services, they use the Java CoG API [Laszewski2003]. Figure 1 illustrates this and also shows that the LEAD Portal provides some functionality to the user through Java WebStart clients that execute on the user’s workstation.
Figure 1. LEAD Portal Architecture
2.2 Security Model LEAD Portal users have or are assigned a grid certificate. Certificates are stored in a MyProxy server [Novotny2001], freeing users from the chore of certificate management. Users log into the LEAD Portal using their MyProxy username and password; authentication to the portal is thus delegated to the MyProxy server. Once authenticated with MyProxy, a proxy certificate is retrieved and loaded into the portal session for the user. In most cases, we expect this process to be completely transparent; that is, from the user’s perspective, he or she only has a username and password and user may not even be aware that he or she has a grid certificate. The LEAD Portal uses XPOLA [Fang2005], a capability-based, fine-grained authorization framework, for securely granting access to application services. As stated above, users must obtain capabilities to each application component in a workflow before being able to execute a workflow. These capabilities are in
the form of digitally signed XML documents and are called capability tokens. They contain a set of SAML [SAML1.1] assertions about what the user is allowed to do with a particular service. The provider of the service has granted the capability token to the user and signed it with his or her own certificate’s cryptographic keypair. The portal keeps track of a user’s capability tokens and submits them to services or the workflow engine as needed.
2.3 Interaction with the Grid Generally, the LEAD Portal does not interact with grid resources directly. Instead, the LEAD Portal interacts with web services in the LEAD system. These web services run under a special grid identity, called a community account, which is authorized to interact with grid resources on the portal user’s behalf.
3. User Scenario: Hurricane Katrina In this user scenario, the LEAD Portal will be used to create a forecast of the Hurricane Katrina landfall that occurred on August 29, 2005. For this forecast, we will be using ARPS, the Advanced Regional Prediction System [Xue2003], which is a regional to storm-scale atmospheric prediction system. The input to this forecast will be a preselected set of canned data. The output of the forecast will be viewed using radar animations visualized using the ARPS plotting software. The ARPS forecast code is a typical scientific computing code, written in Fortran. In the LEAD Project, it has been lightly wrapped with a web service interface, providing a more convenient mechanism for invoking it within a web services based workflow framework. Together will other application code components similarly wrapped, a workflow can be created that orchestrates how data will flow between these components. For this user scenario, we assume that the workflow has already been created. The first step is to create a new experiment in the Experiment Builder portlet. The ARPS_Katrina workflow should be selected, and a name and description for this experiment should be provided (see Figure 2). The Experiment Builder portlet then provides input forms for providing configuration parameters needed by the workflow. Once the experiment has been completely configured, the experiment can be launched. Prior to launching, a workflow monitor (the Workflow Composer application in monitoring mode, actually) can be invoked to listen for and display notification messages sent by components in this workflow and hence update its display of the progress of this particular experiment, showing currently running components in green, completed components in grey, etc (see Figure 3). These notification messages are the means by which the workflow components commicate their status to the workflow engine; in addition, they provide information related to performance characteristics and data provenance. Notifications are stored also in the user’s myLEAD workspace, and the user can retrieve a complete log of notifications there. For this experiment, some of the notifications will contain links to visualization output, in this case, they are animated GIFs (see Figure 4). Data products created by the workflow, as well as the workflow script used and its configurations, are also stored in the user’s myLEAD workspace, providing a complete record of the executed workflow.
Figure 2. Experiment Builder Portlet, selecting a workflow
Figure 3. Workflow Monitoring
4. Future Plans 4.1 More Advanced Workflow Development and Interaction Current workflow development is limited to creating simple workflow graphs that are capable of parallelism but that aren’t capable of any dynamism at runtime. The LEAD project is currently developing a workflow specification system based on BPEL [Andrews2003] (with extensions to better work with grids [Slominski2005]) that will address our need for dynamically adaptive workflows. This implementation will support conditional branching, loops and exception handling in workflows. The Workflow Composer is being updated to provided visual programming of these new constructs. The
Figure 4. Katrina Forecast Visualization.
BPEL based workflow engine will also be able to accept workflow reconfigurations at runtime. Thus, work is needed to develop an interface in the portal of a representation of the current state of a running workflow which provides users with the ability to modify that workflow as it is running. This requires greater portal level integration of the monitoring work that is ongoing in the LEAD project.
4.2 Address the needs of Educational Users The LEAD Portal is used as an educational tool. To better support this end, educators will be able to create educational materials on the LEAD Portal and have them integrated with various resources in the portal. Educators will be able to publish these materials and grant specific students rights to view these
materials. Another enhancement of the portal to support educational users is to make the user interface in the LEAD Portal responsive to the level of sophistication of the user. For example, if the user is defined to be in the role of “novice user”, the Experiment Builder Portlet would only display to the user workflow configuration parameters that are appropriate to that user’s level of expertise. A user in the role of “advanced user” might be shown all possible parameters that can be tweaked.
4.3 Integrate with TeraGrid The LEAD Project is currently working on integrating with the TeraGrid [TeraGrid2005]. The goal is to provide a broader community of users the opportunity to access these sophisticated research tools coupled together with the substantial computational and data storage resources of the TeraGrid. The current most substantial challenge is in the area of accounting and auditing. Because we intend for grid resources to be consumed under a community user account, mapping individual workflow requests at the portal level to actual resource usage on back end resources and being able to account for this activity is very important. Another problem to solve is that when resources are being used under the community user account on behalf of several portal users, system administrators see only the community user account as owning these tasks. System administrators thus require that they be able to distinguish which community user is doing what on their resources at any given time, along with additional information such as contact information for the portal user in question, should they need to take corrective action in the case of malicious behavior.
Bibliography [USAToday20051129] “’06 Forecase: More Stormy Weather”, USA Today, 11/29, 2005. http://www.usatoday.com/weather/news/2005-11-29-hurricane-season-ends_x.htm [USAToday20051106] “Rescuers search through rubble left by F3 tornado”, USA Today, 11/6, 2005. http://www.usatoday.com/news/nation/2005-11-06-tornado-in-ky_x.htm [Kelvin2005] K. Droegemeier et al. Service-Oriented Environments for Dynamically Interacting with Mesoscale Weather. Computing in Science & Engineering, Volume 7, Issue 6, pp. 12-29, November 2005 [Plale2005] Beth Plale, Dennis Gannon, Jay Alameda, Bob Wilhelmson, Shawn Hampton, Al Rossi, and Kelvin Droegemeier. Active Management of Scientific Data. IEEE Internet Computing special issue on Internet Access to Scientific Data, 9(1):27–34, January 2005. [Novotny2001] Jason Novotny, Steve Tuecke, and Von Welch. An Online Credential Repository for the Grid: MyProxy. In Proceedings of the Tenth International Symposium on High Performance Distributed Computing, pages 104–111. IEEE Press, August 2001. [Fang2005] Liang Fang, Dennis Gannon, and Frank Siebenlist. XPOLA: An Extensible Capability-based Authorization Infrastructure for Grids. In 4th Annual PKI R&D Workshop, April 2005. [Xue2003] M. Xue, D.-H. Wang, J.-D. Gao, K. Brewster, and K. K. Droegemeier. The Advanced Regional Prediction System (ARPS): Storm-scale numerical weather prediction and data assimilation. Meteor. and Atmos. Physics, 82:139–170, 2003.
[TeraGrid2005] TeraGrid web site. http://www.teragrid.org. [Laszewski2003] G. von Laszewski, J. Gawor, S. Krishnan, and K. Jackson. Grid Computing: Making the Global Infrastructure a Reality, chapter 25, Commodity Grid Kits - Middleware for Building Grid Computing Environments. Wiley, 2003. [GridSphere2005] GridSphere web site. http://www.gridsphere.org. [JSR168] Alejandro Abdelnur and Stefan Hepper. JSR 168 portlet specification (final release), 7 October 2003. http://www.jcp.org/aboutJava/communityprocess/final/jsr168. [OGCE2005] Open Grid Computing Environment. http://www.ogce.org. [XSUL2005] WS/XSUL: Web services/xml services utility library. http://www.extreme.indiana.edu/xgws/xsul/. [SAML11] OASIS, Assertions and Protocol for the OASIS Security Assertion Markup Language (SAML) V1.1 http://www.oasis-open.org/committees/download.php/3406/oasis-sstc-saml-core-1.1.pdf [Andrews2003] Tony Andrews, et al. Business Process Execution Language for Web Services version 1.1. online, 5 May 2003. ftp://www6.software.ibm.com/software/developer/library/ws-bpel.pdf. [Slominski2005] A. Slominski. On Using BPEL Extensibility to Implement OGSI and WSRF. Grid Workflows, Concurrency and Computation: Practice & Experience, Special Issue on Scientific Workflows (to appear), 2005.
Chapter 4. The TelescienceTM Project Abel W. Lin, Steven T. Peltier, Mark H. Ellisman National Center for Microscopy and Imaging Research University of California, San Diego 9500 Gilman Dr, BSB 1000 La Jolla, CA 92093-0608 {awlin, peltier, mark}@ncmir.ucsd.edu
Abstract For over the last decade, researchers at the National Center for Microscopy and Imaging Research (NCMIR, http://ncmir.ucsd.edu) have been developing and implementing novel technologies to propel collaborative research. NCMIR has built flexible high throughput, cyberinfrastructure environments which connect researchers to advanced imaging instruments with data and computational grids. Through the integration of pioneering research in remote instrumentation research (via TelemicroscopyTM) and application enabling cyber-infrastructure tools (via the ATOMIC Tookit) this group demonstrated this vision in the context of The TelescienceTM Project (http://telescience.ucsd.edu). Telescience provides an end-to-end, single sign-on solution for biomedical image analysis and structure– function correlation that integrates users with resources and applications, unified security and minimal administrative complexity. Here we highlight the research and a use case that is enabled by the Telescience Project (in particular the Portal interface) which could not otherwise have been readily reached without a unified Grid infrastructure.
1. Introduction Over a decade has past since researchers at the National Center for Microscopy and Imaging Research (NCMIR) demonstrated the feasibility of remote control of bio-imaging instruments (SIGraph Conference 1992). The progression of that nascent software system was achieved under an NSF Grand Challenge Award for the Collaboratory for Microscopic Digital Anatomy (CMDA) that delivered the first production TelemicroscopyTM (Haddida-Hassan, 1999, Molina, 2005) software system, released in 1999. Known as VidCon2, this system allowed for effective web-based and collaborative remote control and data collection scenarios. From VidCon2 feedback, it was clear that collaborative remote control and data collection only addressed a single (and relatively small) part of the experimental process. For increase end to end efficacy and throughput, remote data acquisition had to be closely coupled to high performance computation for processing and analysis and data management. Furthermore, while the ergonomics of VidCon2 were limited to basic Java Swing components, another lesson learned from VidCon2 was that it is possible to create a simplified and usable point-and-click interface to a complicated process (the physical control system of an electron microscopy has been compared to the controls of a Boeing 747). The Telescience Portal for Advanced Tomography Applications (also known as Telescience v1.0, circa 1999-2004) was developed to address this issue (Peltier et al, 2003, Lee 2003). The Telescience Portal provided a Grid-based environment to combine the use of Telemicroscopy with tools for parallel distributed computation, distributed data management and archival, and interactive integrated visualization tools to provide an end-to-end web-based solution for high throughput microscopy.
Telescience v1.0, like other first generation Grid portals/projects, focused primarily on creating a vertical software stack where all the necessary software and Grid middleware components were not only modular and compatible, but shared a common authentication protocol. Various components, which were previously developed in isolation, were brought to bear on a single scientific process. That vertical integration drove the development of software features whose functionality was critical to achieving a complete end-to-end system. As a testament to the various developers involved, Telescience v1.0 was in everyday use by approximately 30 globally distributed neuroscience researchers for approximately 4 years before the recent transition to version 2.0. Version 2.0 of the Telescience Project (Lin et al, 2005) focuses on the maturation of this integrated system, moving away from increased vertical integration of tools towards a horizontal generalization of the individual layers to provide a uniform and truly modular programming environment for applications developers. While the Telescience 1.0 software stack motivated many worldwide grid efforts (including the Biomedical Informatics Research Network (BIRN) - www.nbirn.net, Geosciences Network (GEON) www.geongrid.org, and the NCHC EcoGrid - ecogrid.nchc.org.tw), its foundation was not designed to serve as a generalize-able and componentized software architecture for large scale distribution. The elements of cyberinfrastructure middleware utilized at the time were still in their early stages releases and lacked interoperability with many of the tools from the other layers of the architecture, forcing the development of many custom interaction elements (e.g., custom protocols, wrappers, etc.). Moreover, web services and associated standardizing protocols (i.e. SOAP, WSRF, JSR168) that would have provided a measure of interoperability were nascent or non-existent. These projects are now benefiting from advances made in version 2.0.
2. Motivation The benefits of moving scientific processes towards a grid infrastructure have been justified through scientific results. Over the past several years, parallel processing and early grid computing efforts, has already dramatically increased the rate and the amount of data that can be computed and analyzed. However, if we look at the entire process, computing is only one -- and often a small -- portion of the overall scientific process. Data grids, and more recently semantic Grids, have burst onto the scene, promising to revolutionize distributed data management and curation. Yet without direct application interaction with these grids, they serve little more function than being fancy data storage systems. In order for the end-toend process to benefit from the grid, these technologies must be equally applied to the major components of the overall scientific process. In other words, grid technologies must equally touch upon data acquisition, data computation, and data management. Moreover, in order for research to benefit from grid technologies, the different types of grids must be able to be unified for both the application developers and the user. This unified grid vision is the ultimate goal of the Telescience Project. In Telescience v1.0, emphasis was directed towards delivering grid-enabled parallel processing horsepower to elements of research workflows to increase the overall throughput of the end-to-end process in direct response to the exponential growth of data generated by scientific instrumentation (microscopes, synchrotrons, MRIs, etc.). Parallel applications were developed to accelerate processing bottlenecks and to capitalize on the growth of distributed resources to provide both computing cycles and distributed resources for managing the unwieldy amount of data. Influenced and modeled after early visions of Grid middleware infrastructure, Telescience v1.0 was heavily biased toward computation. Even today, whether in academia or industry, current grid projects tend to offer one -- or all -- of these three attributes: • Increasing access to computing systems via grid software
• Building simplified GUIs to launch grid-enabled applications • Pooling idle resources toward a common purpose (i.e. cycle scavenging and scheduling) These directions focus on computing more data at a faster rate. While the ability to process vast amounts of data quickly is a valuable asset to any process (and one of the goals of a grid system), a unified grid offers much more: It can intrinsically change the way the entire process is perceived. In other words, the unified grid provides for not just faster processing of more data but it can deliver the abilities of collecting better data from the start and refining the data-collection and processing methods. Imagine an environment where free computing cycles are dynamically gathered for real-time ondemand computing directly from the data-generating instruments themselves (instead of monolithic largescale, batch-orientated computation). In Telescience v2.0 vision of an on-demand world, data is automatically maintained and flows freely from instrument to computation to analysis, where the results of that analysis interface directly to the instrument, providing automated feedback that can constantly refine data-collection parameters and techniques. For Telescience, the grid provides more than just a means to faster results; it provides a foundation for collection of better raw data. This vision can only be accomplished when instruments, compute resources, and data are brought into parity. Specifically, this parity must be both reflected in the interface provided to the domain-specific application developers and the end-of-line user interfaces.
3. Telescience 2.0 System Architecture The Telescience Portal infrastructure is designed to accelerate the development of unified grids for all disciplines. It is composed of three modular and extensible software layers that connect the user to the physical resources. Figure 1 shows the overall Telescience architecture. The infrastructure is built upon descending layers of abstraction, allowing for modular extensibility and transparent operation of grid resources and services. User interaction occurs via a Web portal interface that ultimately traverses a series of layers to the required physical Figure 1: Telescience Architecture resources. Telescience has deployed a user portal based on the GridSphere Framework (any JSR168-compliant portlet system should also interact with the services described). Functions in the portal layer interact with the Application to Middleware Interaction Component (ATOMIC) service layer (Lin et al., 2005). This unifying service layer represents a novel mechanism by which application developers interact with core grid components. Unlike projects initiatives with as the NSF Middleware Initiative (NMI) which are focusing on the design, development, testing, and deployment of individual middleware components, ATOMIC is organizing all of the disparate middleware components into themes (security, data management, job launching) and provides apps Figure2: Multi-scale, multi-spatial Neuroscience developers a stable and uniform API to program against.
4. “The Visible Cell” The study of complex biological systems, such as the nervous system, requires integration of information across multiple spatial, temporal and conceptual scales. Data integration in biosciences is driven by the need not only to understand a given piece of data in context, but to synthesize diverse data into unified models of biological processes. These models are coined visible cells. The data integration problem spans many levels, from the development of architectures and technologies that allow remote access and interoperability of massive amounts of data, to the well-known semantic difficulties in comparing and aggregating data obtained by different individuals across time, space and field of study to the need to establish more effective means of enhancing collaborations among scientists working in these domains. Researchers (and collaborators) at NCMIR have focused on the ability to fill in component structure that composed the mesoscale, structures which sit between more gross anatomical scales and the level of individual protein and gene structure. It is generally defined as the dimensional range of nm’s to 100’s of µm’s, a range which encompasses cellular networks, cellular and subcellular microdomains along with their macromolecular constituents. This spatial scale remains one of the greatest challenges in modern biology, yet is a necessity for situating systems biology in a cellular context. Such information includes not only structural information about subcellular components such as organelles and synaptic complexes, but also the 3D distribution of their protein constituents in situ. Unlike the relatively uniform sequence and structural information at the gene and protein level, the types of data generated at this scale of resolution are more diverse and complex, ranging from 2D and 3D images to physiological data. The Telescience Project is building a user environment (and the required underlying software architecture and infrastructure) that unifies and provides the necessary end-to-end tools required to bridge the gaps in understanding of biological complexity across scales by enabling collaborative data acquisition and analysis.
5. The Telescience Portal The hallmark of Telescience Portal remains the researcher managed microscopy workflow, where the sequence acquiring, process, visualizing, and extracting useful information from the data is presented to the user in an intuitive, single-sign on web environment. Beyond facilitating the execution of these steps, however, the Telescience system audits progress through the workflow and interfaces each component within the workflow to federated databases to collect and manage all of the meta-data generated across the entire process. As with all first generation Portals, a major accomplishment for Telescience v1.0 was to create simple web accessible interfaces to a heterogeneous set of middleware via a single user name and password. Through Telescience v1.0, for example, users could browse the data grid via a custom interface or launch jobs via web wrapped middleware commands. These interfaces, however, were designed in autonomy for singular interactions whose capabilities were developed by mirroring a command line interface to the particular middleware tools. Due to limitations in the infrastructure, first generation portals moved from the original purpose of monitoring the process to also being responsible for the execution of the processes.
Figure 3: Telescience Portal The Telescience Portal is a rich user environment, where generalized session information and persistence logic allows actions in the scientific process driven workflow management portlets to be reflected in other portlets (i.e. data management portlets). The session information and logic can also be preserved and further delegated to downstream workflow controllers and external applications while retaining notifications for all components.
The Telescience v2.0 infrastructure is designed to transcend interfaces with singular actions and transforms them into a rich user environment, one that is automated and dictated by the scientific process and not by the Grid middleware. By moving away from singular “Grid interfaces”, the Telescience Portal returns to its original purpose of session tracking and process management. This capability is enabled by a scientific process controller portlet that manages and monitors the highest level scientific process. Like many scientific processes, the highest-level process remains relatively static to the end user (while the subordinate components are heterogeneous and can be relatively ethereal). The Telescience workflow portlet, however, is amenable to other types of processes (beyond multi-scale microscopy) because the persistence and intra-portlet logic is separate from the interface layer. Adapting the workflow portlet to other scientific disciplines is simply a matter of substituting appropriate process headings in the portlet. Figure 3 outlines a typical action that is initiated by the end-user and tracked and monitored by the Portal. From the main scientific process controller portlet, the user launches an external application (in this example a Telemicroscopy instrument control session). Session information (i.e. authentication and data management parameters) that is curated by the Portal upon login is passed to the application at runtime via ATOMIC tools and services. Using those parameters, the user is authenticated for instrument controls and can further initiate a scientific workflow process. In this example, a Pegasus planned workflow (generated by Telemicroscopy) is executed by a Condor DAGMAN on a pool of Telescience accessible computing resources (including TeraGrid and OptIPuter). Next generation ATOMIC web/grid service-based implementation (already in beta-testing) will further allow dynamic notifications of progress at both the level of the external application and the main portal workflow. An important aspect of this process is managed by the availability of databases to house both the end raw data products of the analysis software and relevant descriptive data, both for the purposes of data management and provenance, data mining, dissemination and future feedback based experimental processes. The Cell
Centered Database (CCDB) – http://ccdb.ucsd.edu - delivers a stable infrastructure for deposition of cellular and subcellular microscopy data so that it can be distributed to the biomedical community and its associated “Federation tools." The Telescience Portal coupled closely with the CCDB (sharing the same authentication and authorization roles) creates a dynamic and user transparent experimental process where not only raw and meta-data are tracked but also user activity during the experimental process. This creates an audit trail that not only offers replication of all experiment procedures for reproducibility but is also amenable to projects where that audit information is legally required (i.e. HIPAA requirements for projects dealing with human clinical data). All of this takes place in a seamless user environment where the typical overhead of transitioning between portals, applications and workflows are not transferred to the end-user.
6. Discussion First generation (or proof of concept) Grid systems have demonstrated success at bringing together globally distributed, disparate and heterogeneous systems towards a common goal. Ironically, the initial success in these first generation systems resulted in more advanced subsequent systems that brought a level of user overhead which resulted in systems that were prohibitively difficult to use, thereby negating gains brought about in the proof of concept systems. Next generation systems must contain the appropriate programming tools and user environment that allows researchers to manage these distributed resources without the overhead that is associated with Grid technologies or simply the need to manage all aspects “by hand”. These challenges are not singular to multi-scale neuroscience, but are also found in other data rich processes, such as geosciences and other Geographical Information Systems (GIS). It's no surprise that portals have emerged as the mechanism to bring Grid technologies to the enduser. Portals have long been touted as the dominant source of application and information delivery. Leading information technology analysts have championed the portal as a mechanism that provides access to and interaction with relevant information, applications, business processes, and human resources by select, targeted audiences in a highly personalized manner. Accordingly, the enterprise portal has become the most desired user interface in Global 2000 enterprises and is ranked as one of the top 10 areas of technology focus by CIOs.
7. Conclusion A hallmark of our current advances in IT infrastructure is the ability to capture and process large amounts of information and data. The ability to process and manage -- and make decisions from -- vast amounts of information was once reserved for those privileged few that access to large "big-iron" supercomputers. Now, the Grid has flattened the playing field, allowing everyone to have access to (or to create) large pools of computing power. However, the development and deployment of the underlying grid infrastructure is but one step toward extending access to the end user. To maximize use of the grid by any end-to-end process, it must be transparently embedded into the natural working process of the particular user. Telescience addreses that challenge by creating a system that goes beyond merely replacing command-line arguments with check-boxes and radio buttons.
Acknowledgments
This work was supported in part by grants from the National Institutes of Health (5P41RR04050, 5R01NS046068, 2P41RR08605, P41RR08605, and 1U24RR19701).
References Hadida-Hassan, M.., et al., (1999) "Web-based Telemicroscopy", J Struct Biol 125:2/3, April/May, pp. 235-245 Molina, T., Yang, G., Lin, A.W., Peltier, S.T., Ellisman, M.H., (2005) A Generalized Service-Oriented Architecture for Remote Control of Scientific Imaging Instruments. Proceedings of the 1st International Conference on e-Science and Grid Computing, Workshop on Instruments and Sensors on the Grid, pp 550-556. Lee D, Lin AW, Hutton T, Akiyama T, Shinji S, Lin FP, Peltier S, Ellisman MH (2003) Global Telescience Featuring IPv6 at iGrid2002. Future Generation of Computer Systems, 19(6): 1031–39. Lin, AW., et al., The Telescience Project: Applications to Middleware Interaction Components (2005) Proceedings of The 18th IEEE International Symposium on Computer-Based Medical Systems, p. 543 548. Lin, A.W., et al. (2005) The Telescience Tools: Version 2.0. Proceedings of the 1st International Conference on e-Science and Grid Computing, p. 56 – 63. Peltier ST, Lin AW, Lee D, Mock S, Lamont S, Molina T, Wong M, Martone ME, Ellisman MH (2003) The Telescience Portal for Advanced Tomography Applications. Journal of Parallel and Distributed Applications, Special Edition on Computational Grids 63(5): 539 – 550.
Chapter 5. GEON : Cyberinfrastructure for Geoscience Community Choonhan Youn, Chaitan Baru, Karan Bhatia, Sandeep Chandra, Kai Lin, Ashraf Memon, Ghulam Memon and Dogan Seber, San Diego Supercomputer Center, University of California at San Diego, La Jolla California. The GEON (GEOsciences Network) is a cyberinfrastructure project that is bringing together information technology and geoscience researchers from multiple institutions in a large-scale collaboration [GEONGrid2002]. The goal of GEON is to build data-sharing frameworks, identify best practices, and develop useful capabilities and tools to enable dramatic advances in how geoscience is done. The GEONGrid infrastructure is naturally distributed with users and resources spread across 16 different partner sites in the US. For utilizing the GEONGrid system [Sacerdoti2004] [Bhatia2005a], we provide user-friendly science environments for access to scientific tools and data, and vastly broaden the scope of scientific questions that can be answered through the portal system. Scientists or researchers are able to discover a variety of data, tools, and models and to analyze and simulate geoscience applications via our distributed portals which are using advanced, semantics-based search engines and query tools, in a uniform authentication environment that provides controlled access to a wide range of resources. Hence, the main challenge in GEON portal is to provide the partner sites with increased control and management of how their resources, tools, and data are accessed and integrated into the end-user’s environment while maintaining the properties of a virtual organization: interoperability, security, location independence, etc. In building a GEON portal, specifically we consider two topics. First, the service-oriented approach is very appropriate and applicable like other science grid projects [Foster2005] [Hey2005]. A diverse set of services as a “kit” of service components can be easily composed in various ways in different science applications. This is also the rationale for the “plug-and-play composable services” vision for Grid middleware in UK’s e-science program. Next, portal services that contain a different set of service interfaces include access to all metadata, the management of system deployments, and data information, which is provided by other GEON partner sites. Additionally, a portal service may aggregate a set of services and provide a domain specific view of the state of these services. We are also adopting a portletbased architecture which allows reusable portal services. This portlet approach enables the user and/or administrator to choose which content providers to display. That is controlled through the portlet container and allows each partner site to plug and play the portlet components for the GEON community.
1 The Core Capabilities of the Portal We provide two types of services, portlet components and Web services for the Geoscience community of users in the GEON portal. The main portlet components for the user interface are grouped into three areas: account management for the portal administrator, data management and science applications for the geoscience and utility services such as code repository and communications for the portal user. • The account management portlet is based on GAMA (Grid Account Management Architecture) developed specifically to support GEON [Mueller2005]. GAMA provides a central GSI certificate management system where “grid” users are approved, and credentials are created for them based on global policies. Grid users have a single login credential and password that can be used at any portal site that has that account enabled. The partner portals can query GAMA and synchronize the grid accounts either automatically or selectively. In addition to grid accounts, each partner portal can create purely local-user accounts with no GSI credentials. These accounts may be used by developers to build local services, or by users that wish to access the local resources, but who are not members of
GEON. The global GEON services and applications will generally not support local users, or it will provide reduced level of service for non-grid users. • GEON Ontology portlet [Ludäscher2005a] [Bowers2004] [Lin2003] facilities OWL (Web Ontology Language) ontologies registration and visualization. For the each OWL ontology uploaded into the GEON system, the system validates that all the imported ontologies are from the GEON system, and assigns a unique name space to the ontology, and then generates web based documents for browsing the ontology. • GEON Resource Registration portlet supports to register data resources into GEON. The resources registered to GEON can be classified as hosted and non-hosted resources. The hosted resources are physically sent and installed into the GEON repository and served from the GEON system. Shapefiles and GeoTIFF files are two example hosted resources. Non-hosted resources are the resources served from the machines outside GEON, and their information is saved in GEON, for instance, relational databases and web services are usually non-hosted resources. • GEON Search portlet provides a search engine to find resources registered to GEON. Users can search based on metadata, spatial coverage, temporal coverage, ontologies or any combination of these. • GEON Workbench (myGEON) portlet supports bookmaking and integrating many different type resources. For example, multiple shapefiles can be integrated through a map; multiple databases and shapefiles can be integrated as a virtual relational resource. It also provides tools to manage submitted data resources. • Map Integration portlet [Zaslavsky2004] [Lin2003] [Memon2005] drives spatial data mapping and visualization on the portal. It is composed of different components, which support on-the-fly visualization and analysis of geoscience datasets, stored in shapefile format. • SYNSEIS (SYNthetic SEISmogram generation tool) Portlet [Youn2005] provides the calculation and study of synthetic 3D regional seismic waveforms. Using interactive user interface, with mapping tools and event/station/waveform extraction tools, users are able to interactively set their study region on the US map, access seismic event and station locations, extract waveforms on the fly for any selected event-station pair, and compute a synthetic seismogram using built in tools. The main GEON service components in middleware layer have four categories: data management services [Lin2003] [Memon2005] [Youn2005], job management services [Youn2005], mapping management services [Memon2005], and certificate management services [Mueller2005]. All GEON of services are defined as WSDL and can be accessed concurrently by multiple users, which is essential in a grid environment. Note GEON services are being developed and changed continuously.
2 The Portal Architecture Implementation Framework We implement GEONGrid portal framework in the traditional three-tier architecture based on the service-oriented model. These tiers separate functionality and responsibility, allowing us to develop services independently as illustrated in Figure 1. Users are able to connect to the portal through a web browser and access Web services through their stand-alone client applications using the over-the-wire connection protocols at the front end. The middle tier consists of two basic sections: the user interface server running a portlet engine and a distributed Grid/Web Service-based middle tier. The web server runs a portlet engine which contains portlet components. These components may implement specific local service interfaces with integrating a variety of distributed services. The user interface server is responsible for aggregating and customizing the various components into the portal page of the user. And the portlet container defines how user interface components can be plugged in and managed by portal administrators and users. Gridsphere portal framework [Gridsphere2003] which we are using currently, for example, is open source portlet container system that provides this capability. Service components consists of a bunch
of Web/Grid Services that can provide access to remote back end services, such as HPC computers running PBS or other queuing system, data storage devices, mapping tools, and visualization toolkits.
Figure 2. GEONGrid portal is implemented in a multi-tiered architecture Security Model Security in a Grid environment is critical, since it often involves directly accessing a user’s resources on a particular computer through delegation to a middle tier proxy. Basically, Grids require an extension of the traditional transport level security systems using SSL. So, currently, we use simple, point-to-point transport level security mechanisms in GEONGrid infrastructure. In our distributed portal architecture, there are two levels at which the authentication are performed: the portal interaction level and the Web Services level. We use GSI-based security infrastructure, GAMA which provides a central GSI certificate management system in the portal [Bhatia2005b]. Through the login portlet which has the GSI authentication module, the user portal authentication is performed with connecting to GAMA server. Users thus take the proxy certificate on the portal session. In order to communicate secure messages between the portal server and the targeted remote services, we set up the transport level security using GSI-based certificates for the authentication over SSL. A simple authorization mechanism to restrict GEON Web Services access is performed through the gridmap file which contains the user distinguished name and the local user name. Upon the authenticated call that arrives at certain service, the identity of the caller is checked against the owner of the application. If two identities match, the authorization for the Web service access is granted.
Interaction with the back-end resources or Grid The main task of the GEON user interface is to allow users to register and discover data for the geosciences through the GEON meta-catalog server with distributed data storages, organize their work into the workbench place, and do the map integration with available data. For example, users can search the GEON data resources, e.g. shapefiles, databases, WMS (Web Map Server) service, and GeoTIFF, collect their data and integrate them into “myGEON” portlet from the “GEONSearch” portlet and then visualize the shapefile data using a mapping service embedded in the “myGEON” portlet.
The portlet component in the GEON user interface, which maintains several client stubs that provide local interfaces to various remote services, need GSI authentication and simple authorization mechanism for using the gridmap file. These remote services are invoked on various service-providing hosts on the GEON grid, which may in turn interact with local or remote databases, data repositories, or remote queuing and system environments via grid services.
3 A GEON user scenario The GEON portal provides many opportunities to a domain user. These range from easy access to a vast amount of data sets and tools to efficient utilization of high performance computing resources. The portal allows both registration and discovery of data sets. For example, if a user is looking for a geology map in a given region, through the built-in interactive, map-based resources the user can discover the data set of interest with ease and download it if needed. Since the portal could use an ontology based search mechanism, the goal is to help users locate data sets based on concepts not simply by matching keywords and/or controlled vocabularies. This has many benefits. It expands the user base of each data set. It will turn non users of certain data sets into users because through ontologies users will be able to recognize how certain data sets fit into a given concept. Since the portal also allows the integration of user specific data sets in the myGEON area, those users without major compute resources and software will be able to take full advantage of the system and access large amounts of information. Having the ability to set up a user’s own workbench area, and integrate and share the results with other users will also make the GEON portal an enabling platform for multidisciplinary research. The other benefit of the GEON portal is that it provides easy access to large computational infrastructures without the hassles usually encountered in accessing national scale large computational environments. Form example, through the SYNSEIS (synthetic seismogram calculation) portlet, users are able to access external data centers, extract seismic waveform data form arbitrary stations across the country, build 3D geologic models, and easily compute synthetic seismogram utilizing the grid resources. Once users log on to the portal, all resources needed for such advance computations are provided in an easy-to-use environment allowing both specialist and non-specialists to use such resources to solve complex earth science problems.
4 Future Plans To enable multi disciplinary research in the geosciences, science portals must provide more interactivity and dynamic user interfaces. The use of ontologies in registration, discovery, and analysis environments must also be improved. Part of the future work will include building dynamic portlets and extensive ontology aware discovery and computational environments to enable integrative science studies. In a secure environment, users require the GSI-enabled authentication for using a variety of Web/Grid services. With the portal interaction, users get CAS (Community Authorization Service)-enabled proxy certificate for the authorization. The CAS proxy certificate is a GSI restricted proxy credential with an embedded policy giving the user the right to perform a set of actions granted by the resource provider to the community. Resource providers grant coarse-grained access to blocks of resource using SAML (Security Assertion Markup Language) standard. Based on this assertion, GEON’s role-based authorization system for much more fine-grained resource control will be developed. To support the scientific workflow management system, GEON workflow services will be developed using Kepler [Ludäscher2005b] and the web-based workflow system will be developed for more the user interaction.
Acknowledgement This research was funded by NSF grants EAR-0353590 and EAR 0225673.
Bibliography [Bhatia2005a] Karan Bhatia, Sandeep Chandra: GEON Systems Report. SDSC, Tech Report, SDSC TR2005-6 [Bhatia2005b] Karan Bhatia, Sandeep Chandra, Kurt Mueller, Vladimir Veytser, Choonhan Youn: Engineering an End-to-End GSI-based Security Infrastructure. Jan 2005, San Diego Supercomputer Center, Tech Report, SDSC TR-2005-1 [Bowers2004] Shawn Bowers, Kai Lin, Bertram Ludäscher: On Integrating Scientific Resources through Semantic Registration. SSDBM 2004: 349-352 [Foster2005] Ian Foster: Service-Oriented Science. Science, Vol 308, 6 May 2005 [GEONGrid2002] Cyberinfrastructure for the Geosciences: http://www.geongrid.org. [Gridsphere2003] Gridsphere portal framework: http://www.gridsphere.org. [Hey2005] Tony Hey, Anne E. Trefethen: Cyberinfrastructure for e-Science. Science, Vol 308, 6 May 2005 [Lin2003] Kai Lin, Bertram Lud¨ascher: A System for Semantic Integration of Geologic Maps via Ontologies. In Semantic Web Technologies for Searching and Retrieving Scientific Data (SCISW), Sanibel Island, Florida, 2003 [Ludäscher2005a] Bertram Lud¨ascher, Kai Lin, Shawn Bowers, Efrat Jaeger-Frank, Boyan Brodaric, Chaitan Baru: Managing Scientific Data: From Data Integration to Scientific Workflows. GSA Today, Special Issue on Geoinformatics, to appear, 2005 [Ludäscher2005b] Bertram Ludäscher, Ilkay Altintas, Chad Berkley, Dan Higgins, Efrat Jaeger, Matthew Jones, Edward A. Lee, Jing Tao, Yang Zhao: Scientific Workflow Management and the Kepler System. Concurrency and Computation: Practice & Experience, Special Issue on Scientific Workflows, to appear, 2005 [Memon2005] Ghulam Memon, Ilya Zaslavsky, Ashraf Memon, Kai Lin, Chaitan Baru: Generating composite thematic maps from semantically-different collections of shapefiles and map services. In Proceedings of ESRI Users Conference, San Diego, CA, July 2005 [Mueller2005] Kurt Mueller, Karan Bhatia, Sandeep Chandra: GAMA: Grid Account Management Architecture. IEEE e-Science 2005, Melbourne, Australia, Dec 2005 [Sacerdoti2004] Federico Sacerdoti, Sandeep Chandra, Karan Bhatia: Grid Systems Deployment & Management using Rocks. IEEE Cluster 2004, San Diego, CA, Sept 2004 [Youn2005] Choonhan Youn, Tim Kaiser, Cindy Santini, Dogan Seber: Design and Implementation of Services for a Synthetic Seismogram Calculation Tool on the Grid. International Conference on Computational Science (1) 2005: 469-476 [Zaslavsky2004] Ilya Zaslavsky, Ashraf Memon: GEON: Assembling Maps on Demand From Heterogeneous Grid Sources. In ESRI User Conference, San Diego, California, 2004
Chapter 6. The Bioportal L. Ramakrishnan and D. Reed Renaissance Computing Institute, Chapel Hill, North Carolina. Biological and biomedical research in the recent years has been spearheaded by the increase of quantitative methods to analyze data and discovery of challenging problems across the traditional disciplinary boundaries. This has been complemented by the explosive growth of data and development of large-scale computational models and data mining tools and high-throughput instrumentation to capture large volumes of data. This growth is aided and accelerated by high performance computing, Grid infrastructure, data management technologies and collaborative tools. Today’s technologies provide the different software pieces required to enable a scientist to take advantage of distributed environments such as the Grid. However, deep understanding of the technologies and a significant time investment is still required to enable the integration of the software, site customization and building interfaces for specific science communities [15]. For the biological research community to leverage next generation computing and advanced IT resources, more robust software tools with easy-touse and intuitive interfaces to access distributed data resources, applications and collaborative workspaces for remote team collaboration are needed. Our answer to this need is the Bioportal; a shared, extensible infrastructure that operates atop standard Grid infrastructure and technologies providing access to tools and data specialized to the needs of biological educators and researchers. The Bioportal is based on the Grid architecture described by Foster, Kesselman and Tuecke[3]. Typically, each member of a disciplinary community has some dedicated infrastructure (e.g., cluster or data sets) and operates a local entry point that provides transparent access to resources, both as individuals and as members of larger, virtual organizations [4]. For example, a group of scientists at the University of North Carolina Chapel Hill working on a specific biology problem may have access to TeraGrid [14] resources at certain times in addition to their own resources to meet peak needs. This architecture allows the community to grow and add new partners to their virtual organizations and provides an easy way to incorporate additional resources and data as they become available. By hosting separate portal interfaces that have been customized for user groups, service providers are able to accommodate specific domain needs while reusing the back-end infrastructure. The Bioportal is guided by the following design principles: • Ease of use. The key goal of the Bioportal is to make the portal and associated infrastructure easy-touse by educators, students and researchers. The application interfaces hide the complexities of the underlying technologies and allows the user to focus on the details of the science. • Scalability. The explosive growth of biological data and the need for high end computing resources to support models and analysis tools necessitate use of a scalable, distributed architecture. • Extensibility. A default set of tools and data sets are included in the Bioportal. However, the goal is to allow users to add applications to the framework using simple XML descriptions. • Sharing. The next generation research problems in the biological community are on the boundaries of different disciplines. Thus, in addition to easy access to tools, scientists need the ability to share data with their collaborators. The Bioportal enables sharing of the resources and data by providing collaborative tools such as shared workspaces that allow for more integrated work across multiple communities.
6.1 The Core Capabilities of the Portal The Bioportal framework built on standard portal and grid technologies is modular and extensible allowing for site specific policies as well as the addition of new applications. Specifically, it provides: • Standard access to commonly used bioinformatics application: The Bioportal provides access to over 140 application codes useful for education and research. The application interface is automatically generated from the application description in XML allowing for a standard look and feel, reducing the learning curve for new tools. Some of the application suites included are EMBOSS (European Molecular Biology Open Software Suite)[11], HMMER (Hidden Markov Model program for profilebased sequence analysis)[12], NCBI (National Center for Biotechnology Information)[10], PHYLIP (PHYLogeny Inference Package for inferring phylogenies)[13]. • Access to backend databases and job files: The Bioportal provides federated access and analysis and search tools to distributed data. The backend (about 350 GB) currently supported include NCBI, PDB, Prints, RepBase, UniProt, PFam, ProSite, TransFac. Results from job runs are also accessible through an easy to use file transfer portlet. • Access to distributed cyberinfrastructure such as Grids and web services: To facilitate scalability, the applications and data are managed in a distributed Grid and web services environment. The Bioportal hides the complexities of a distributed environment through application specific interfaces while allowing the user to leverage the power of the distributed environment. • Easy integration of new applications and data into the framework: The Bioportal framework supports a PISE [7,8] based XML description for the applications. PISE enables easy and quick addition of new applications by writing a single XML description file. By plugging it in the PISE framework, the web interface is generated making the application easily accessible to a large number of users thus involving no development to integrate a new application. • A scalable open source software stack: A next generation global cyberinfrastructure can be established through large scale adoption of distributed software infrastructure. To facilitate this vision, the entire software of the Bioportal is packaged and documented such that it can be distributed to the bioscience community.
6.2 The Portal Architecture The Bioportal uses the Open Grid Computing Environment(OGCE)[9] framework, which itself builds on the CompreHensive collaborativE Framework (CHEF) [19] and Jetspeed. The application interfaces and processing are based in PISE, an XML tool that generates web interfaces for bimolecular applications. The Bioportal uses existing grid technologies and protocols to manage jobs and files. Our back-end software stack is based on Globus[5], an implementation of grid technology developed by the Globus Alliance.
Implementation Framework The Bioportal framework provides access to application and data and provides a collaborative framework. The OGCE framework provides a core set of portlets to access distributed resources while leveraging the CHEF and Jetspeed frameworks. CHEF is a flexible environment for supporting distance learning and collaborative work. We use the collaborative portlets such as shared workspace, calendar, etc from CHEF to support virtual communities. In turn, Jetspeed’s services for user interface customization, caching, persistence and user authentication are used for our basic portal framework. The application tooling of the Bioportal allows users to select, configure and launch bioinformatics, biological and biomedical applications through the portal while leveraging execution on local or remote Grid resources. Standard application interfaces are generated using PISE, an XML framework for biomolecular applications. The PISE distribution comes with XML descriptions of applications for
database searching, comparison programs, gene finding and modeling, RNA analysis, phylogeny, pattern discovery among others. In the PISE framework there is an XML description for each application that defines the interface and the logic to process application input. The PISE perl based framework generates application specific HTML forms. The HTML forms are transformed and imported as velocity templates into the Bioportal framework. Figure 1 shows portion of the XML file and the corresponding interface that is generated for BLAST application. The text in between the
Security Model The security needs for the Bioportal are multifold – 1) single sign-on to allow local and remote resources, 2) auditing and accounting tracks of resource and data usage 3) protection of users’ files and data, 4) accommodate resource provider setup such as community accounts for a group of users, password expiration. The security model needs to provide the required security goals while still not complicating the end-user interaction with the portal. Thus the end user security model for the Bioportal is based on a username and password combination. In today’s environment to access the portal and grid services, every user needs to have a portal account, a user certificate and an actual account on the physical machine. In the OGCE framework, the passwords for the first two need to be the same to enable user transparency in acquiring the user certificate during logon. Thus, traditionally an account request procedure for a portal and grid environment is a multi-step process including shell access to the machine to request the grid certificate. This user account request procedure is a nightmare for both administrators and end-users. Thus, we built a simple account management system that allows the user to select a username and password as part of account creation process. Users use a web based form to request accounts for the portal. The system hides the complexities of a certificate request procedure from the user by generating a public-private key pair for the user and storing it in the account database. The user is sent an email and asked to confirm the request. After the request is confirmed and if the user is eligible for an account by site policies, the administrator approves the account and creates a UNIX account for the user, loads the certificate in MyProxy[6] and populates the OGCE databases with both user account information and a customized set of portlets that the user can access based on his/her rights. In addition, the account management system allows the user to change his/her password at any time, a capability that can’t be done easily and transparently with the state-of-art of technologies today. We run the portal under a separate user account – “portal” to restrict damage that can be caused by malicious users or runaway processes. We use Grid Security Infrastructure (GSI)[18] for protecting access to grid resources. Globus uses public key cryptography to authenticate and map user identities to system level user accounts using GSI. Globus X509 certificates can be stored in MyProxy, a credential repository for grid environments that allows users to access their credentials from any resource. The OGCE portal user interface uses MyProxy to authenticate users and obtain proxy certificates to be used with Globus during the user’s session. Thus, the MyProxy server provides single sign-on capability from the portal. A log based auditing and accounting system and a job history database is used to track usage of the resources and; accounting and auditing of user’s actions. The account management is a modular component allowing for specific site policies to be integrated, for example – the UNC deployment of the
Bioportal requires a 90 day password expiration policy by campus security guidelines. Also, in case the resource provider where the job is submitted expects a community account, the account details configured at build time of the portal is used during resource access.
Interaction with the back-end resources or Grid The Bioportal framework is mean to interact with local and Grid resources using standards based technology such as Globus. The specific components of Globus used in the Bioportal are Grid Resource Allocation and Management (GRAM) [20,17] and GridFTP[16]. The Globus Gatekeeper provides a standard job submission interface. We assume that individual clusters will have schedulers such as Maui/Torque, LSF, Condor, etc, installed and available through the gatekeeper. The user and site policies and load balancing techniques are layered atop the standard Globus based resource management layer. This allows the end-user transparent access to distributed resources completely agnostic to specific schedulers and other infrastructure tied to a particular site. In turn, GridFTP provides the third party data transfer protocol for authenticated file movement and is used to manage user’s job input and output files. User access to the grid resources is restricted to be through the portal i.e. the user does not have shell access to the machines. The North Carolina Bioportal[1] was deployed for students and researchers (funded by the University of North Carolina's Office of the President.) The site policy for this deployment allows users to access their job files for 14 days after the run. While this policy seems restrictive, there are mechanisms provided in the portal to allow users to save their job files in their permanent file space for longer. These databases are updated periodically. Some of these updates are fairly large and may take a number of hours every single day. Sites may have different update policies based on disk space or bandwidth constraint. The variation in the output of user’s jobs can be significant based on the updates and often users like to rerun their jobs after a database has been updated. Maintaining global knowledge of the data location and using it to make resource decisions during scheduling is important when considering load balancing across clusters.
6.3 A Bioportal user scenario The Bioportal requirement analysis is based in multiple distinct but related biology and biomedical communities, e.g. molecular biology and genetics and genotype-phenotype analysis[2]. One effort targets researchers and educators in North Carolina and, via the NSF TeraGrid, the United States, who need access to standard databases and preliminary computational analysis tools. Another effort targets federation and correlation of data to understand the genetic basis of complex diseases such as cancer, addition, etc. The two communities have separate needs in details of tools and data, however the infrastructure needed is similar – easy, integrated, customized access to models, data and resources in virtual organizations formed by geographically distributed teams. Let us consider a typical research environment where the scientists belong to various institutions across the world that gets together as part of a research project. A scientist at the University of North Carolina has sequence data that he would like to analyze. He logs into the portal and uses the BLAST tool (Figure 3) to compare against known gene sequences available through NCBI. He submits the job through the portal and returns later in the day to access the results through the job history portlet. He then decides he would like to use ClustalW, another tool in the portal that is used for multiple sequence alignment for DNA or proteins. After looking at the results from ClustalW he realizes he would like to discuss the results with his colleague in Europe who is also online. He uses the ‘Shared Workspace’ in the portal to share data and results and uses the online chat feature to discuss it with his colleagues. He also decides to download the files to his local computer using the file transfer portlet to use with some of his locally developed visualization tools.
6.4 Future Plans The Bioportal framework is being expanded to accommodate additional applications as driven by specific user communities. The user interface leaves a number of interesting engineering issues with respect to management of user files, job quotas and managing application workflows that accesses resources and data distributed across organizational boundaries. Currently there is a production deployment at UNC infrastructure that is available for educators and researchers in the state. Additional deployments around the state and other national developments including the TeraGrid will help realize the vision for a distributed but integrated cyberinfrastructure.
Bibliography 1. 2. 3. 4.
5. 6.
7. 8. 9. 10. 11. 12. 13. 14.
15. 16.
17.
North Carolina Bioportal, (http://www.ncbioportal.org), 2005 The Carolina Center for Exploratory Genetic Analysis, (http://www.renci.org/nih), 2005 I. Foster, C. Kesselman and S. Tuecke, “The Anatomy of the Grid: Enabling Scalable Virtual Organizations,” International Journal of Supercomputer Applications, 15(3), 2001. D. Gannon, R. Bramley, G. Fox, S. Smallen, A. Rossi, R. Ananthakrishnan, F. Bertrand, K. Chiu, M. Farrellee, M. Govindaraju, S. Krishnan, L. Ramakrishnan, Y. Simmhan, A. Slominski, Y. Ma, C. Olariu and N. Rey-Cenvaz, “Programming the Grid: Distributed Software Components, P2P and Grid Web Services for Scientific Applications,” In Special Issue on Grid Computing, Journal of Cluster Computing, Vol. 5, No. 3, p. 325-336, 2002. I. Foster and C. Kesselman, “Globus: A Metacomputing Infrastructure Toolkit,” International Journal of Supercomputer Applications, 11(2):115-128, 1997. J. Novotny, S. Tuecke and V. Welch, “An Online Credential Repository for the Grid: MyProxy,” Proceedings of the Tenth International Symposium on High Performance Distributed Computing (HPDC-10), August 2001. Pasteur Institute Software Environnent (PISE), (http://www.pasteur.fr/recherche/unites/sis/Pise/), 2005 C. Letondal, “A Web Interface Generator for Molecular Biology Programs in Unix,” Bioinformatics, 17(1), pp 73-82, 2001 Open Grid Computing Environment (http://www.collab-ogce.org/nmi/index.jsp) National Center for Biotechnology Information (NCBI) http://emboss.sourceforge.net European Molecular Biology Open Software Suite (EMBOSS) http://emboss.sourceforge.net HMMER(Hidden Markov Models), http://hmmer.wustl.edu, 2005 Phylogeny Interface Package (PHYLIP), (http://evolution.genetics.washington.edu/phylip.html), 2005 C. Catlett, “The Philosophy of TeraGrid: Building an Open, Extensible, Distributed Terascale Facility,” Second IEEE/ACM International Symposium on Cluster Computing and the Grid (CGRID2002), p. 5, 2002 G. Fox, M. Pierce, D. Gannon and M. Thomas, “Overview of Grid Computing Environments,” Global Grid Forum, Document. GFD.9 W. Allcock, J. Bester, J. Bresnahan, A. L. Chervenak, I. Foster, C. Kesselman, S. Meder, V. Nefedova, D. Quesnal and S. Tuecke, “Data Management and Transfer in High Performance Computational Grid Environments,” Parallel Computing, 28 (5), pp. 749-771, May 2002 K. Czajkowski, I. Foster, N. Karonis, C. Kesselman, S. Martin, W. Smith and S. Tuecke, “A Resource Management Architecture for Metacomputing Systems,” IPPS/SPDP '98 Workshop on Job Scheduling Strategies for Parallel Processing, pg. 62-82, 1998.
18. 19. 20.
I. Foster, C. Kesselman, G. Tsudik and S. Tuecke, “A Security Architecture for Computational Grids,” Fifth ACM Conference on Computer and Communications Security, pp. 83-92, 1998. P.A. Knoop, J. Hardin, T.Killen and D. Middleton. “The CompreHensive collaborativE Framework (CHEF)}”, AGU Fall Meeting Abstracts 2002. K. Czajkowski, I. Foster, N. Karonis, C. Kesselman, S. Martin, W. Smith, S. Tuecke. “A Resource Management Architecture for Metacomputing Systems.” Proc. IPPS/SPDP '98 Workshop on Job Scheduling Strategies for Parallel Processing, pg. 62-82, 1998.
Chapter 7: Simulating Earthquakes: the QuakeSim/SERVOGrid Project Marlon Pierce with Mehmet Aktas, Galip Aydin, Geoffrey Fox, Harshawardhan Gadgil, and Ahmet Sayar Indiana University
Earth Science and Geophysical Research Challenges The danger posed by earthquakes has been demonstrated many time in the last several years. Earthquakes in Bam, Iran in December 2003, Sumatra in December 2004, and Kashmir in October 2005 all resulted in tens of thousands of deaths. The scale of these tragedies amply demonstrates the importance of understanding the immediate and long term causes and behaviors of interacting earthquake fault systems. Death tolls for recent large earthquakes in developed countries such as the United States and Japan have not been as catastrophic, but the economic cost of events such as the 1994 Northridge, California earthquake demonstrate the need for increased understanding. Geophysicists have developed a range of tools for investigating earthquake fault systems. Techniques include a) data mining techniques for analyzing time series data produced by sensors such as Global Positioning Systems; b) modeling codes that theoretically simulate the effects of the stresses associated with faults; c) data assimilation codes that attempt to find best-fit models to data records, which may then be used to forecast areas of increased hazard; and d) large scale simulations that can examine the behavior of extensive interacting fault systems such as the San Andreas fault system and its neighbors. Such codes are obviously excellent candidates for incorporating into an application Grid for geophysicists. Our project, the Solid Earth Virtual Observatory (SERVO) Grid, is developing the applications, the distributed computing infrastructure, the data management tools, and the Web portal user interfaces, for building such a Grid. SERVOGrid is lead by the NASA Jet Propulsion Laboratory, and includes collaborators at the University of California-Davis, the University of Southern California, the University of California-Irvine, and Indiana University. As with many other Grid projects, we began SERVO with a focus on the computational codes, but as the project evolved, we realized the providing programming interfaces to remote data sources (both real time and archival) through Web Services was at least as important as managing the execution of remote applications. We thus consider SERVO to be an example of a “Grid of Grids” [Fox2005] in which we must integrate “Data Grid” and “Execution Grid” services (which may themselves be independently useful) into a larger, cooperating system. Another important research area is the development of tools for managing these distributed services. An important subset of Grid management systems, known as Grid Workflow [Gannon2005], shepherds the execution of a composite application across several different, distributed services. Information management of Grids also falls in this category. We examine in this article the SERVO Grid efforts to develop all of these pieces.
Solid Earth Research Virtual Observatory: Requirements and Architecture To understand the SERVO architecture, we first consider some of its geophysical application components and their data requirements. These codes are typically initially developed on a UNIX workstation and then may be parallelized to run on clusters and supercomputers such as the Columbia supercomputer at the NASA Ames research center. • Disloc models multiple dipping dislocations (faults) in an elastic half-space. • Simplex is an inversion code based on Disloc. Using observational surface stress values and an initial geometric model for one or more causative faults, Simplex can determine optimum fault model parameters. • GeoFEST [Parker2005] is a three-dimensional viscoelastic finite element model for calculating nodal displacements and tractions. It allows for realistic fault geometry and characteristics, material properties, and body forces. GeoFEST relies upon fault models with geometric and material properties. GeoFEST input files are generated through • Virtual California (VC) [Rundle2002] is a program to simulate interactions between vertical strike-slip faults using an elastic layer over a viscoelastic half-space. VC relies upon fault and fault friction models. • Pattern Informatics (PI) [Tiampo2002] calculates regions of enhanced probability for future seismic activity based on the seismic record of the region PI uses seismic data archives • Regularized Deterministic Annealing Hidden Markov Model (RDAHMM) [Granat2004] is a time series analysis program based on Hidden Markov Modeling. Produces feature vectors and probabilities for transitioning from one class to another. RDAHMM is typically used to analyze GPS and seismic catalog archives, but can be adapted to detect state change events in real time.
Architecture SERVOGrid is implemented as a collection of Web Services for accessing data sources, execution codes, and other tools. User interfaces to these services are implemented as Java Server Pages, which are in turn aggregated into a central portal. Figure 1 depicts the basic system architecture. As we describe in more detail in subsequent sections, we decided to build a specific set of Web Services that can be adapted to manage the various applications and their data applications. Figure 1 indicates several sample interactions: the QuakeSim portal mediates the user’s interactions with remote servers, and remote services must also communicate with each other. Figure 1 also implies a workflow, but we do not bind this to the portal. As we describe below, we use Apache Ant-based Web Services for connecting various dependent local (to a specific host) and distributed tasks. We manage distributed state (such as is required to step through several tasks on different hosts) through the Context Manager Service (described below). This allows complicated tasks to run independently of the user’s portal session: users can receive updates of their project’s progress when they log back into the portal later. As is discussed in greater detail in other sections, we chose the portlet approach for building our Web portal. This had the primary advantage of allowing us to plug in other portlets into our system. Thus it is not difficult to combine a user interface that combines portlets to our Web Service Grid components as well as portlets to various Globus Toolkit services, collaboration tools, news and information services, and so forth.
Execution Grid Services SERVOGrid is based on the so-called “WS-I+” approach to building Web Service-based Grid systems [Atkinson2005]. We chose to implement all services using standard Web Service specifications for WSDL and SOAP.
Browser Interface HTTP(S)
User Interface Server Aggregating Portal
Portlet Portlet Portlet Portlet
WSDL QuakeTables and GIS Services
WSDL Job Sub/Mon And File Services
Visualization Services
JDBC
DB Host 1
Operating and Queuing Systems Host 2
GMT and WMS Host 3
Figure 1 The SERVOGrid Architecture consists of distributed Web Services accessed through the QuakeSim user portal.
Our initial focus in SERVOGrid was to support and develop application management tools for the codes listed in the previous section. These included the following: Application Web Services: Describing applications with a simple data model has been part of the design of many projects. Our approach is documented in [Youn2003]. In brief summary, our focus was on capturing the static metadata descriptions of applications in our Grid so that we could make them available to portal users through standard formats. Our primary concern was in constructing job descriptions for remotely executing the applications, not in developing a taxonomy or ontological description. We did make initial investigations in to the latter using Semantic Web and Case-Based Reasoning techniques [Aktas2004]. Execution Management Services: In our design of execution services, we realized the Apache Ant project offered many intriguing capabilities: it already implemented numerous task useful for interacting with the local file system (executing programs, creating, renaming, and deleting files, etc.). Ant also offers a simple extension mechanism that allows us to incorporate our own tasks, which are typically Web Service clients for File Transfer and Context Management (described below). This allows us to implement the basic backend-to-backend communications shown in Figure 1. Ant tasks also allow us to define simple workflows and job sequences, and (unlike basic GRAM services) give us some control of the user’s actions on the server side (i.e., the user only gets access to specific tasks and can’t run arbitrary commands on the server. This is enforced on the Web Service side as well as the user interface side). In
our implementation, we develop Ant build.xml file templates for specific applications (such as coupling GeoFEST with finite element mesh generating applications). File Transfer and Management Services: We implemented file transfer Web Services for moving data between various backend machines and between the user’s desktop and the backend host machines. Thus this service may work behind the scenes, coupled with the Ant execution service described above through modular extensions. When coupled with the Context Management service, we create virtual file spaces for the user: the Context Manager keeps track of the file location for a specific user project. This metadata can then be used to construct download requests, as well as visualization requests. We prefer this approach for building file management user interfaces over providing the user with direct view of files on specific file systems. Context Management Services: The QuakeSim portal and its codes allow users to execute geophysical applications on a Grid, but we must go beyond this to provide a useful user experience. In particular, we must provide a way of maintaining user information (selected codes, the input files used and output generated, and so forth), which are organized using a project/session structure. We manage this information using structured name-value pairs, which can be constructed as arbitrarily deep trees. We refer to this metadata as context [Pierce2002]. We have been more recently working to replace our custom Context Management service with an implementation of WS-Context, described below.
Data and Information Grid Services Quake Tables Fault Database
As the project evolved, we realized that designing data services to provide data access to the SERVOGrid codes was at least as important as managing applications. The QuakeTables Web Service and Web accessible database [Chen2003, Grant2005] was our initial data service. QuakeTables acts as a data repository for earthquake fault data, including location, geometric and material characteristics, and provenance information such as the source (author, journal information, etc) for a particular fault entry. QuakeTables, as a Web Service, provides both a human usable Web interface and a WSDL-based programming interface. Using the latter, we have integrated QuakeTables with GeoFEST, Disloc, and Simplex through the QuakeSim portal. Geographical Information System Services
In follow-on work, we realized that Geographical Information System (GIS) standards could be adapted to meet many our data and metadata requirements. The Open Geospatial Consortium [OGC] defines an extensible (and extensive) XML data model, the Geographic Markup Language (GML) [Cox2003], for describing geospatial and geo-temporal features. This common data model is then integrated with a number of services. The OGC defines standard service definitions and interoperability guidelines. We implemented the following “Information and Data Grid” Web Services: • Data Services: We implemented the Web Feature Service [Vrertanos2002] to store and retrieve seismic data archives, GPS data archives, and faults. An OGC feature is a GML description of a map object. The description may include both information on how to render the feature as well as other useful metadata, such as the name of the feature and other observation data associated with it. • Map Generation Services: We implemented the OGC’s Web Map Service specification [Beaujardierre2004] as a Web Service. The Web Map Service is used to generate vector and
•
raster maps in various formats (SVG, JPEG, GIF, etc). These maps typically include realizations of abstract feature data obtained from Web Feature Services. Our Web Map Service can also integrate maps from other Web Map Servers as an overlay. Information Services: One useful feature of the OGC service specifications is that they include a standard XML metadata description (“capabilities”) and query method. The OGC also defines information services (catalogs) for aggregating capability information. We decided, however, that these specifications were too GIS specific and could be substituted with more general, UDDI-based systems. We developed an extension of UDDI along these lines to support general metadata extensions and XPath queries, with specific realizations for the OGC capabilities file.
Real Time Data Grids One of the most exciting challenges within the SERVOGrid project is the development of real-time streaming data grid applications. Our current research involves providing the infrastructure for coupling real-time GPS data, available from the Southern California Integrated GPS Network, with RDAHMM for real-time event detection. As described briefly above, RDAHMM can be used to detect underlying mode changes in archived GPS signals. These modes, which require no fixed input parameters, can be associated with physical processes such as earthquakes and more subtle seismic events.
Figure 2 Live GPS data streams are processed using message filters that publish and subscribe to messaging topics.
We are in the process of designing real-time stream support by using topic based publish/subscribe software, NaradaBrokering [Pallickara2003]. The system works as a sequence of filters that transform binary GPS data streams. Each network source stream (which typically corresponds to 5-10 individual GPS stations) is initially published in binary RYO format. Each network is then received by an ASCII decoder, which republishes on a new subtopic. We add further filters, such as a de-multiplexing filter that can separate the 5-10 interleaved GPS station information into 5-10 different topics, so that applications can register for individual stations. We are in the process of developing an RDAHMM filter for each of the GPS stations.
User Interfaces Portlets QuakeSim is developed around the Jetspeed 1 portlet model, and has been integrated with CHEF 1.x for demonstration purposes. Our initial development concerns when moving to Jetspeed were to support legacy Java Server Pages interfaces trivially within the portal and to keep the portlets reasonably independent of the Jetspeed development model. To meet these requirements, we developed a general purpose WebFormPortlet as an extension of the Jetspeed 1 portlet base class. WebFormPortlet features include • Support for portlets running independently (on other web servers) of the portlet container. • Support for session state (through Tomcat’s JSESSIONID cookie). • Support for HTML processing: POST parameters can be passed from the aggregating portlet container to the remote portlet. • Portlet navigation: URL links and form actions are rewritten to allow navigated pages to appear within the portlet container rather. • Support for both HTTP and HTTPS connections. SERVOGrid follow-on projects include redesign of the production portal using JSR 168 compliant portlets.
Exploring AJAX Techniques Asynchronous JavaScript and XML (AJAX) makes use of the widely supported XMLHttpRequest object in JavaScript to decouple user requests from browser requests to remote services. This greatly increases the interactive capabilities of Web browser user interfaces. We have very actively pursued integration of our GIS Web Services (particularly our Web Feature Services and their GPS, seismic, and fault data) with Google Maps. We find this particularly useful for simulating “server push” in our real-time GPS data work.
Unit Testing and Maintenance One of the difficulties in managing portal deployments (as opposed to portal development) is to monitor the system for failures. We found the Apache Ant and HttpUnit projects to be especially useful for this task. HttpUnit provides “black-box” testing that simulates a user’s interactions with a portal: We use HttpUnit tests to log into the portal, navigate user pages, and launch applications. Unit tests verify that expected HTML responses are returned from the portal server, and that know error responses are not returned. HttpUnit can be usefully driven by Apache Ant’s JUnit task. We found it useful to combine this with Ant’s target to detect when Web Servers were inaccessible. We use built-in HTML dashboard reports and email features to provide comprehensive test reports.
Summary and Future Directions The SERVOGrid effort has explored a number of technologies, including portlet-based portals, Web Service grids, Geographical Information System services, distributed context and state management, and real-time streaming data applications. SERVOGrid’s future work will focus increasingly on the latter, as we see real-time data analysis and change detection as an area of much importance to the next generation of Grid applications.
References [Aktas2004] Mehmet S. Aktas, Marlon E. Pierce, Geoffrey Fox, David B. Leake: A Web based Conversational Case-Based Recommender System for Ontology aided Metadata Discovery. GRID 2004: 69-75. [Atkinson2005] Malcolm P. Atkinson, David De Roure, Alistair N. Dunlop, Geoffrey Fox, Peter Henderson, Anthony J. G. Hey, Norman W. Paton, Steven Newhouse, Savas Parastatidis, Anne E. Trefethen, Paul Watson, Jim Webber: Web Service Grids: an evolutionary approach. Concurrency Practice and Experience 17(2-4): 377-389 (2005). [Beaujardierre2004] de La Beaujardiere, Jeff, Web Map Service, OGC project document reference number OGC 04-024. [Chen2003] Chen, A., Donnellan, A., McLeod, D., Fox, G., Parker, J., Rundle, J., Grant, L., Pierce, M., Gould, M., Chung, S., and Gao, S., Interoperability and Semantics for Heterogeneous Earthquake Science Data, International Workshop on Semantic Web Technologies for Searching and Retrieving Scientific Data, Sanibel Island, FL, October 2003. [Cox2003] Cox, S., Daisey, P., Lake, R., Portele, C., and Whiteside, A. (eds) (2003), OpenGIS Geography Markup Language (GML) Implementation Specification. OpenGIS project document reference number OGC 02-023r4, Version 3.0 [Fox2005] Geoffrey Fox, Sang Lim, Shrideep Pallickara, Marlon Pierce: Message-based cellular peer-topeer grids: foundations for secure federation and autonomic services. Future Generation Comp. Syst. 21(3): 401-415 (2005). [Gannon2005] Dennis Gannon and Geoffrey Fox Workflow in Grid Systems Editorial of special issue of Concurrency & Computation: Practice & Experience (in press). [Granat2004] Granat, R. A., Regularized Deterministic Annealing EM for Hidden Markov Models, Ph.D. Thesis, University of California, Los Angeles, 2004. [Grant2005] Grant L.B., A. Donnellan, D. McLeod, M. Pierce, G.C. Fox, A.Y. Chen, M.M. Gould, S.S. Sung, P.B. Rundle, A Web-Service Based Universal Approach to Heterogeneous Fault Databases, Computing in Science and Engineering Special Issue on Multi-Physics Modeling, in press. [Okada1985] Okada,Y.(1985) Surface deformation due to shear and tensile faults in a half-space, Bull.Seism.Soc.Am., 75, 1135-1154. [Pallickara2003] Shrideep Pallickara, Geoffrey Fox: NaradaBrokering: A Distributed Middleware Framework and Architecture for Enabling Durable Peer-to-Peer Grids. Middleware 2003: 41-61.
[Parker2005] Parker, J., Lyzenga, G., Donnellan, A., Judd M., Baker T., Norton C., Tisdale E., Li P., Using the GeoFEST faulted region simulation system, Proceedings of the 4th ACES Workshop, Beijing China (in Press) [Pierce2002] Marlon E. Pierce, Choon-Han Youn, Geoffrey Fox: The Gateway computational Web portal. Concurrency and Computation: Practice and Experience 14(13-15): 1411-1426 (2002) [Rundle2002] Rundle, JB, PB Rundle, W Klein, J Martins, KF Tiampo, A Donnellan and LH Kellogg, GEM plate boundary simulations for the Plate Boundary Observatory: Understanding the physics of earthquakes on complex fault systems, Pure and Appl. Geophys., 159, 2357-2381 2002. [SensorML] Sensor Model Language (SensorML) Project Web Site: http://vast.nsstc.uah.edu/SensorML/. [Tiampo2002] Tiampo, K.F., Rundle, J.B., McGinnis, S., and Klein, W. Pattern dynamics and forecast methods in seismically active regions, Pure and Applied Geophysics, 159, 2002. [Vretanos, 2002] Vretanos, P (ed.) (2002), Web Feature Service Implementation Specification, OpenGIS project document: OGC 02-058, version 1.0.0. [Youn2003] Choon-Han Youn, Marlon E. Pierce, Geoffrey Fox: Building Problem Solving Environments with Application Web Service Toolkits. International Conference on Computational Science 2003: 403412.
Chapter 8. The Cactus Portal I. Kelley, Center for Computation and Technology, Louisiana State University. The numerical relativity community uses high-performance resources to model Einstein’s equations in an attempt to learn more about some of the basic elements in the universe, such as gravitational forces and waves. These simulations model collisions between black holes to more accurately predict gravitational waves. Numerical results can help to provide feedback to researchers detecting gravitational waves, helping them to recognize appropriate waveforms in their signal analysis, with the ultimate detection of gravitational waves reinforcing Einstein’s theories. With large gravitational wave detection systems like LIGO and GEO600 coming online the push to increase numerical model output is becoming more important. These numerical simulations can require hundreds of processors, take days to run, and often produce very large data sets in the order of terabytes. Traditional HPC centers may not be able to easily meet these requirements, or a researcher may not have access to individual super-computers that can satisfy his or her needs. Because of this pressing demand for more high-performance resources, numerical applications make them an ideal use-case for grid computing. Beyond raw compute cycle and storage demands, researchers in numerical relativity often need to work with colleagues around the world to coordinate projects, analyze results and share ideas. These types of interactions are traditionally done through emails and conference calls, which is an ad-hoc method of sharing information and given world time differences often leads to inefficiency. The Cactus Portal is a project geared towards building the tools needed to facilitate project coordination as well as providing mechanisms to monitor the real-time progress of these applications, thereby enabling researchers to perform live visualizations of results and remotely steer their applications. By providing a centralized, intuitive, and common interface for access to numerical simulations and results, the Cactus Portal will be able to have an impact on the general productivity and collaborative aspects of a researcher’s work. This paper will discuss the types of applications using Cactus and the basic design of the Cactus Portal, highlighting the elements that will help the numerical community to more easily make the transition from a traditional command-line driven HPC operating environment to a more robust grid system.
1. The Core Capabilities of the Portal Most of the simulation codes in numerical relativity are complicated MPI applications that use a combination of C, C++ and Fortran. To reduce the complexity of these applications, computational toolkits have been built that provide researchers with common toolboxes to perform repetitive tasks or implement certain widely used algorithms. In the numerical relativity community, the most widespread framework for the development of parallel codes is the Cactus [VecPar02] framework. The Cactus framework provides researchers with a modular architecture for constructing their scientific applications that allows them to easily plug-in modules built by other research groups and contribute their developments to the wider community. It is through this framework that the Cactus Portal project was able to build components for Cactus that interact with the portal without requiring researchers to modify any of their physics code.
Although the focus in this paper is on the numerical relativity community, which has been the driving force in the development of the Cactus framework and the Cactus Portal, it should be noted that the Cactus framework is generic and is currently being used by other communities such as bioinformatics, chemical engineering and CFD. Therefore, most of the tools developed for Cactus and subsequently the Cactus Portal can easily be applied to these application groups in addition to numerical relativity.
Figure1. The Cactus Portal simulation tracking portlet. The Cactus Portal project is constructing a custom grid portal that provides many specialized features and capabilities for applications using Cactus. Throughout the project, emphasis has been placed on working closely with the user community to build the necessary elements to help manage Cactus simulations. These application-specific components include job execution and migration, parameter file management, project coordination, event notification and remote visualization of data. Two specific aims are key to the Cactus Portal project: to build generic tools for any grid-application that can be used for monitoring and collaboration development; and to construct Cactus-specific portlets and tools that are tied to applications written using Cactus. Cactus-specific components generally extend generic tools to publish richer information about a simulations progress as well as provide mechanisms for more advanced functionality, such as remote steering and parameter file management. The fully deployed Cactus Portal primarily contains portlets from the GridSphere [\ref], GridPortlets [\ref] and Cactus Portal projects. The following list illustrates the general categories for portlets that are currently deployed or being designed and developed for distribution with the Cactus Portal web application: Installation and Configuration - enables the user to install and configure a Cactus application on a remote resource from the portal. These portlets rely on the GridPortlets API for job submission and use user-provided information to customize Cactus installation scripts that are then deployed to a remote resource for compilation. Job Execution – extends the GridPortlets generic job submission components to allow for custom interfaces and options for launching Cactus simulations. When launching a Cactus application, many parameters are known beforehand or can be extracted from a common list, it is therefore useful to provide a more intuitive interface to users than a generic GRAM job submission interface would provide. Module and Parameter File Management - supplies tools and interfaces to allow users to add, remove, and modify lists of source code modules used to create executables, as well as to create and
modify run-time simulation parameter files. Sharing and comparing parameter files is a very important aspect when trying to build collaborations between disparate research groups, as often they are sharing the same source code and it is the modification of parameters that determines successful simulations. Collaborative Project Tracking - provides researchers a common workspace for a project, showing the projects goals, progress, running jobs and queued jobs. Project management tools such as these provide mechanisms for monitoring the progress of collaborative scientific simulations and facilitate easier integration of researchers, complimenting the current email-centric information exchange mechanisms. Resource Information - gives tailored views on resource information, allowing users to attach application specific metadata to resources, such as the location of common scratch spaces, libraries, and Cactus-specific compile time options. Integrating this information into a centralized repository will not only allow for more automated installation and configuration processes in the future, but also provides researchers with easy access to what can sometimes be hard-to-find or group-specific information. Simulation Tracking and Archiving - provides ability to track the progress of active jobs as well as to review archived simulations [Figure 1]. Capabilities are also provided for informing the user or their colleagues of a running simulations progress by instant messages, emails, or SMSes. Due to the long-running nature of these jobs and the time they are often required to wait in a queue, it is useful for a researcher to be informed when a simulation actually starts and its subsequent progress. Additionally, tools have been created to allow researchers to interact with their running jobs, providing a means to start, stop, and pause a running simulation.
2 The Portal Architecture Implementation Framework The Cactus Portal evolved out of work done in the Astrophysics Simulation Collaboratory project (ASC) [ASC] to build a portal for astrophysics researchers. When the ASC project was reaching its end, the European Gridlab [HPDC02] project received funding to build, among other things, a scientific portal whos driving application would be Cactus. While work began to enhance the ASC portal for our efforts, it became apparent that a more clearly defined separation between grid, scientific applications, and portal framework would be advantageous. The portals workpackage was therefore split into three parts: the GridSphere Portal Framework, GridPortlets, and the Cactus Portal. Given this history, it is only natural that the Cactus Portal uses GridSphere and GridPortlets for its container and grid-functionality. That said, the portlets themselves are JSR-168 [JSR168] compliant, although the services layer currently depends on GridSphere. For our production portal we have also deployed portlets and services from other projects as they were evaluated to be beneficial to our user community, for example the GPIR [GPIR] resource monitoring service from TACC.
Security Model Security in the Cactus Portlets web application is handled primary through the mechanisms provided in GridSphere and GridPortlets. GridSphere provides standard login mechanisms that can include LDAP and password authentication for access to the portal for individual user accounts. GridPortlets has functionality for retrieval and storage of MyProxy [MyProxy] certificates, which many of the portlets within the Cactus Portal use for performing grid authentication. For more advanced security mechanisms the project is currently investigating deploying infrastructure such SDSC’s GAMA [GAMA] project for automatic credential creation and delegation.
Simulation data and results are currently stored on the resources on which a given simulation was run, giving them default Unix-like file and data security. The information published to the portal is typically general information about a simulation that can be shared within the group. Therefore, at this stage in development, security with regard to the portal is not an extremely high priority for the numerical community. That said, the Cactus Portal does have mechanisms to restrict access to viewing results from published simulations, allowing researchers to specify whether their simulations are publicly or privately visible. As the project progresses and more advanced functionality is put into place, like the ability for third parties to access live simulation data and view more detailed archived simulation results, security will become more of a focus.
Interaction with the back-end resources or Grid. The portlets in the Cactus Portal provide the visual content a user sees in his or her web browser, but complex business logic is often being performed in the background. A portlet services layer is used as a way to separate visual components from business logic and back-end low-level functionality, allowing for clear separation of responsibilities and easing the software design process. The following list identifies some of the core services that are in development to support the Cactus Portal: Storage Services - extendable databases for storing information about Cactus simulations and configuration parameters. Information Services - back-end services than can be used by Cactus portlets for getting Cactus associated metadata about hardware resources as well as virtual organization access rights. These services include the XML-RPC listeners that receive calls from Cactus simulations to publish information to the portal. Job Execution Services - builds upon the GridPortlets job management system to provide custom services for configuring and launching Cactus simulations. Notification Services - mechanisms for registering metadata about running simulations and sending email, instant message or SMS reports to stakeholders. Parameter File Management Services – provides services for the management and comparison of Cactus parameter files. These services are currently being integrated into simulation tracking portlets to allow users the added functionality of associating simulation parameters with results.
3 The Cactus Portal user scenario The following user scenario described below and depicted in Figure 2 represents where the evolution of the Cactus portal is headed. Although it is a simplified version of the entire process workflow a numerical relativist would use when interacting with his or her simulation, it highlights the key elements that are necessary for portal integration. In more advanced stages this would also include aspects such as code compilation and remote steering.
Figure 2. Activity diagram depicting simulation tracking and notification. A numerical relativist at Louisiana State University wants to run a physics simulation using the Cactus framework. He provides a parameter file specifying certain run time options for his simulation such as the scope of problem he wants to evaluate and the types of data he would like made available for later analysis. The physicist then instructs the portal to locate and reserve the best available compute resource for the simulation based on his requirements, such as cost, compute cycles and time-scales. After the portal reserves the appropriate resources, it dynamically generates an executable to perform the calculation. The simulation executable is then sent, along with its parameter file to the resource's job scheduling system for execution. The physicist can then register with the portal to receive notifications of his simulation's progress at certain specified events, such as startup, termination, or when a noteworthy event occurs. These announcements can take the form of an email message, an instant message, or a text message sent to his cell phone. The simulation may produce large 1D, 2D and 3D datasets. Due to the complexity and size of 2D and 3D datasets, it may not be feasible to remotely visualize them. However, one-dimensional data can be registered with the portal, allowing the physicist to analyze this lower resolution light-weight data while the simulation is still in progress. He could then make decisions based upon his findings and use the portal to control the simulation in real-time -- perhaps modifying parameters to steer the application in a new direction. After the simulation has completed, 2D and 3D data would be automatically archived to mass-storage until a more in-depth analysis of the results is required. [APAC05]
4 Future Plans The Cactus Portal project has evolved as user requirements change and with the advent of new grid technologies. The portal components described above highlight what are considered to be the base components for the construction of a grid portal that would be useful in the day-to-day process of running Cactus simulations.
Once these fundamental building blocks are in place, the Cactus Portal will be enhanced to provide additional functionalities such as: file distribution, benchmarking, application unit testing, resource estimation, and allocation tracking. As this is an ongoing project at the Center for Computation and Technology and is being used in others such the German D-Grid project, it is expected that over the next years the Cactus Portal will continue to be developed and take its place as a fundamental tool for the coordination and development of high-performance applications using Cactus.
Bibliography [ASC] Ruxandra Bondarescu, Gabrielle Allen, Greg Daues, Ian Kelley, Michael Russell, Edward Seidel, John Shalf, Malcolm Tobias: The Astrophysics Simulation Collaboratory Portal: a framework for effective distributed research. Future Generation Comp. Syst. 21(2): 259-270 (2005) [APAC05] I. Kelley, O. Wehrens, M. Russell, J. Novotny. The Cactus Portal. In proceedings of APAC 05: Advanced Computing, Grid Applications and eResearch, (2005). [HPDC02] Gabrielle Allen, Kelly Davis, Thomas Dramlitsch, Tom Goodale, Ian Kelley, Gerd Lanfermann, Jason Novotny, Thomas Radke, Kashif Rasul, Michael Russell, Edward Seidel, Oliver Wehrens: The GridLab Grid Application Toolkit. HPDC 2002: 411 [VecPar02] T. Goodale, G. Allen, G. Lanfermann, J. Mass\’o, T. Radke, E. Seidel and J. Shalf. The Cactus Framework and Toolkit: Design and Applications. Vector and Parallel Processing VECPAR'2002, 5th International Conference, Lecture Notes in Computer Science. Springer, Berlin. 2003. [GAMA] Kurt Mueller. GAMA: Grid Account Management Architecture. Presentation to GridSphere and Portals Workshop. (February 4-5 2005) [JSR168] (some generic reference, I am sure someone else has one) [MyProxy] (some generic reference, I am sure someone else has one) [GPIR] (some generic reference, I am sure someone else has one)


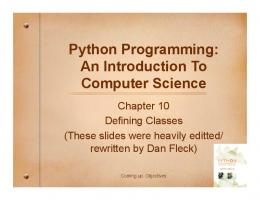

![[PDF] An Introduction to Management Science: Quantitative ...](https://m.moam.info/img/260x300/pdf-an-introduction-to-management-science-quantita_6477c7fe097c474b228c75ac.jpg)


![[PDF] Zookeeping: An Introduction to the Science and Technology Full ...](https://m.moam.info/img/260x300/pdf-zookeeping-an-introduction-to-the-science-and-_6477e8f2097c4744708c3d25.jpg)


![[PDF] Zookeeping: An Introduction to the Science and ... - Google Sites](https://m.moam.info/img/260x300/pdf-zookeeping-an-introduction-to-the-science-and-_64782d2d097c4737708c8452.jpg)


![[PDF] Zookeeping: An Introduction to the Science and Technology ...](https://m.moam.info/img/260x300/pdf-zookeeping-an-introduction-to-the-science-and-_6477e768097c474b228c98b8.jpg)