IEEE TRANSACTIONS ON SYSTEMS, MAN, AND CYBERNETICS—PART A: SYSTEMS AND HUMANS, VOL. 28, NO. 5, SEPTEMBER 1998
601
An Invariant Performance Measure for Surface Reconstruction Using the Volume Between Two Surfaces June Ho Yi, Member, IEEE, and David M. Chelberg, Member, IEEE
Abstract—In this paper, we propose the volume between two surfaces normalized by the surface area (interpreted as average distance between two surfaces) as an invariant quantitative measure for comparing surface reconstruction results of the explicit form, z (x; y ). The invariant property of the volume quantity provides the same measure with respect to an arbitrary coordinate system. By normalizing the volume by the surface area, the values of the measure can be compared for different size of images. We also present a novel computationally simple and efficient way of computing the volume between two surfaces and the surface area using a least-squared-error plane approximation of a surface patch defined over a rectangular grid. Experiments indicate that the method gives equivalent performance as other more complicated and computationally expensive methods. The advantages of this new method are that computation is simple and efficient. Index Terms— Invariant quantitative measure, least-squarederror, surface area, surface reconstruction, volume.
I. INTRODUCTION
I
N computer vision, surface reconstruction is necessary to derive a complete representation of a surface from sparse noisy sets of geometric information, such as depth, orientation or other sources of information. A reconstructed surface is an intermediate representation to bridge the gap between sensor data and symbolic descriptions. Considerable research has been devoted to the problem of reconstruction of visible surfaces [1]–[21]. Reconstruction results from different reconstruction methods are usually compared by showing visual differences using three-dimensional (3-D) displays or displays of a slice of reconstructed surfaces. However, using visual displays makes it difficult to see differences between reconstruction results when they are similar. It is also difficult to quantify how much better one method performs compared to other methods. A quantitative measure is necessary for concise, accurate and informative comparison of different reconstruction results. A good quantitative measure for comparing reconstruction results should have several properties. The measure must be invariant with respect to rotations and translations of the coordinate system. If a measure is not invariant with Manuscript received July 27, 1995; revised November 8, 1997. J. H. Yi is with the School of Electrical and Computer Engineering, Sungkyunkwan University, Suwon, Korea (e-mail:
[email protected]). D. M. Chelberg is with the School of Electrical Engineering and Computer Science, Ohio University, Athens, OH 45701 USA. Publisher Item Identifier S 1083-4427(98)06208-0.
respect to these transformations of coordinate system, then it is possible to obtain inconsistent performance measures. For example, in comparing two reconstruction methods, A and B, that reconstruct a surface in two different coordinate systems, a noninvariant performance measure may lead to a conclusion that method A is better than method B in one coordinate system but is worse in the other coordinate system. It is also desirable to use a measure that produces consistent results for different sizes of images. Finally, there should be a simple, efficient and accurate way to compute as an invariant the measure. In this work, we propose performance measure for the comparison of reconstruction results, where represents the volume between two surfaces and the surface area. We also present a simple and efficient method to compute the volume between two surfaces and the surface area. It is important to point out that to compare images of different scales, other dimensionless measures such would be more appropriate. These measures, as however, do not have an intuitive relation to geometry as does (average distance between surfaces). is independent of rotations and translations of the coordinate system but is scale dependent. or norms have been The metrics induced by the popularly used to give a quantitative measure for comparison of reconstruction results. The use of these metrics is natural because many reconstruction methods employ minimization or error between the true or techniques of target data set and the measurement data set (constraints) to compute the reconstruction results. In Chu and Bovik’s work [5], the reconstruction results were computed by minimizing error (maximum absolute error) and the normalized the (average absolute error) and error were used as metric performance measures. On the other hand, the has mostly been used as a reasonable performance measure irrespective of reconstruction methods [11], [13], [15]. and measures were computed in [15]. Sinha and Schunck [13] employed a rms error measure which is the normalized metric for comparison of two different reconstructions. and metrics The following are the discrete forms of (normalized by the number of the sampled points) and metric that have been commonly used for comparison of
1083–4427/98$10.00 1998 IEEE
Authorized licensed use limited to: IEEE Xplore. Downloaded on March 30, 2009 at 23:55 from IEEE Xplore. Restrictions apply.
602
IEEE TRANSACTIONS ON SYSTEMS, MAN, AND CYBERNETICS—PART A: SYSTEMS AND HUMANS, VOL. 28, NO. 5, SEPTEMBER 1998
p
Fig. 1. Two 1-D functions in two different coordinate systems. In both cases, the true distance (i.e., perpendicular distance) between the two curves is 2.
1d
2d
L ; L ;
THE
metric
1 d 2 L d L
1
d
L
AND
TABLE I 1 d MEASURES GIVE DIFFERENT VALUES FOR
L
(a)
TWO DIFFERENT COORDINATE SYSTEMS SHOWN IN FIG. 1 Fig. 1(a)
1 3 (2 + 2 + 2) = 2 p 1 1=2 2 3 3 (4 + 4 + 4) = 3 2
1 (p2 + p2 + p2) = p2 3 1 1=2 p6 3 (2 + 2 +p2) = 3 Fig. 1(b)
2
reconstruction results of the explicit form,
metric
(1) (b)
(c)
(d)
0
metric
(2)
metric
(3)
and are where and respecsampled points of two functions, or norms, however, tively. These measures using are not invariant with respect to a coordinate system because they are not taken in the direction of the surface normal. This results in different measures in different coordinate systems. For simplicity, let us take a one-dimensional (1-D) example and measures shown in Fig. 1. Table I shows the computed for the two functions in the two different coordinate systems shown in Fig. 1. The measures for the coordinate system shown in Fig. 1(a) is more emphasized than for the coordinate system shown in Fig. 1(b) because in Fig. 1(a), true distance (i.e., perpendicular distance) between the two curves is not used. For the two-dimensional (2–D) case, different measures will also result when different coordinate systems are used. The contributions of this paper are an invariant performance , for the comparison of reconstruction results and measure, a simple and efficient method to compute the measure. A. Approach where denotes a sampled Given data at we compute the volpoint of a surface ume and the surface area by approximating each surface
0
Fig. 2. (a) A reconstructed surface, hx = xi+1 xi and hy = yj +1 yj ; (b) the volume under the surface patch marked in (a), the volume displayed in (b) can be estimated by approximating the surface patch in (b) using (c) the least-squared-error plane computed from z (xi ; yj ); z (xi+1 ; yj ); z (xi ; yj +1 ); and z (xi+1 ; yj +1 ); or (d) two triangles.
patch [Fig. 2(b)] defined by and by the least-squared-error plane [Fig. 2(c)] obtained from these four points. The four points and are not necessarily coplanar. In the results section, four methods of computing the volume between two surfaces and the surface area are compared. Let us denote these four computing methods as follows. • LSE-PLANE [Fig. 2(c)]: computes the volume in Fig. 2(b) by approximating the surface patch using the least-squared-error plane obtained from four surand face points Repeat for the second surface and sum the difference of volume over the image domain. • TWO-TRIANGLES [Fig. 2(d)]: computes the volume in Fig. 2(c) by approximating the surface patch using two triangles. Repeat for the second surface and sum the difference of volume over the image domain. • LSE-PLANE-I: same as LSE-PLANE except that, where two surface patches intersect, the volume between them is computed by decomposing the volume between them into tetrahedra. • TWO-TRIANGLES-I: same as TWO-TRIANGLES except that, where two surface patches intersect, the volume
Authorized licensed use limited to: IEEE Xplore. Downloaded on March 30, 2009 at 23:55 from IEEE Xplore. Restrictions apply.
YI AND CHELBERG: AN INVARIANT PERFORMANCE MEASURE
between them is computed by decomposing the volume between them into tetrahedra. Although other methods using a polynomial or spline fit can be included for comparison, we consider planar fits since they are computationally much simple and more efficient. It should be noted that a reconstructed surface is an approximated surface and the surface shape is ambiguous in regions between pixels; hence a computationally simple and efficient method with reasonable accuracy is advantageous. For example, the implicit assumption in spline fits that the underlying surfaces are smooth, is not always accurate, especially near discontinuities. LSE-PLANE-I and TWO-TRIANGLES-I use the same approximations of a surface patch as in LSE-PLANE and TWOTRIANGLES respectively. However, in the regions where two surface patches intersect, they compute the volume between two surface patches in the same way by decomposing it into tetrahedra. Surface area is computed the same in LSE-PLANE and LSE-PLANE-I and also in TWO-TRIANGLES and TWOTRIANGLES-I. It will be shown in Section VII that LSEPLANE gives equivalent performance as TWO-TRIANGLES, LSE-PLANE-I, and TWO-TRIANGLES-I even if two surfaces intersect. We recommend LSE-PLANE for computing the volume between two surfaces and the surface area because of its computational simplicity, efficiency over other methods and good accuracy. As expected, our experimental results also verify that the computational advantage becomes greater as the problem size increases. In the following section, we briefly describe some mathematical formulas which will be used in later sections. A presentation on how the volume between two surfaces and the surface area are computed using the LSE-PLANE method is given in Section III. Section IV describes the TWO-TRIANGLES method. In Section V, we present how the LSE-PLANEI and TWO-TRIANGLES-I algorithms compute the volume between two surface patches in regions where two surface patches intersect. The computational cost for the four methods are analyzed in Section VI. Experimental results comparing the four methods are presented in Section VII. II. MATHEMATICAL PRELIMINARIES In this section, simple mathematical facts which will be used in Sections III–V are described. be the plane Formula 1: Let and defined by three points in the rectangular coordinate system [see Fig. 3(a)]. Then the plane equation is and the volume, of and the prism defined by is given by Formula 2: Let four points and be coplanar in the rectangular coordinate system [see Fig. 3(b)]. Then the volume, , defined by these four points and is given by Formula 3: The volume, four points
of a tetrahedron defined by and
603
[shown in Fig. 3(c)] is computed as
Determinant
(4) (area The volume of a tetrahedron can be viewed as of one of four faces as a base) (perpendicular height of the fourth point to this base). This results in the same expression as (4).1 Based on these simple mathematical facts, we present in the next section how the volume between two surfaces and the surface area can be efficiently computed using the least-squared-error plane (LSE-PLANE) approximation of a surface patch. III. VOLUME AND AREA BY LEAST-SQUARED-ERROR PLANE APPROXIMATION In order to compute the volume and the surface area, LSEPLANE method approximates each surface patch defined by and on a rectangular grid by the least-squared-error plane [Fig. 2(c)] computed from these four points. Recall that the four points and are not necessarily coplanar. Let us denote a rectangular domain and defined by by th grid domain. We use the following lemma together with formulas 1 and 2 of Section II. be the leastLemma 1: Let squared-error plane computed from four points, and (see Fig. 4). The volume, under the plane on the rectangular domain is given by Interestingly, this expression is equivalent to the volume of a rectangular box with height given by the average height of the four points ] in the [i.e., height same domain. and the leastProof: Given four points, is obtained from squared-error plane, the following system equation:
where
and
1 A tetrahedron is a 3-D simplex. See [22] for a volume computing formula and its proof for the general n-D simplex.
Authorized licensed use limited to: IEEE Xplore. Downloaded on March 30, 2009 at 23:55 from IEEE Xplore. Restrictions apply.
604
IEEE TRANSACTIONS ON SYSTEMS, MAN, AND CYBERNETICS—PART A: SYSTEMS AND HUMANS, VOL. 28, NO. 5, SEPTEMBER 1998
(a)
(b)
(c)
Fig. 3. (a) Formula 1, (b) formula 2, and (c) formula 3.
(a)
(b)
(c)
Fig. 4. (a) A surface patch in which four vertices P1 ; P2 ; P3 ; and P4 are not necessarily coplanar. Recall that, in a reconstructed surface, reconstructed values are available only at lattice points and that the surface shape between lattice points is unknown. (b) Its least-squared-error fit plane computed from the four points in (a), (c) shows an equivalent volume of (b).
The LSE-PLANE method computes the volume between two surfaces on the th domain, as the absolute difference of volumes under two surfaces on the same domain
Then the least-squared-error solution [23] is
(6)
Then the volume,
represents two surfaces. Therefore the where between two surfaces is obtained by summing volume, over the image domain. Assuming a rectangular grid
is computed by formula 2
(7) Q.E.D. (5)
Note that this equation does not explicitly take into account regions where two surface patches intersect (LSE-PLANE-I
Authorized licensed use limited to: IEEE Xplore. Downloaded on March 30, 2009 at 23:55 from IEEE Xplore. Restrictions apply.
YI AND CHELBERG: AN INVARIANT PERFORMANCE MEASURE
605
(a)
(b)
Fig. 5. (a) Left triangle domain (filled region) and (b) right triangle domain (filled region).
takes this into account). The surface area,
is calculated as
of the triangulation shown in Fig. 5. The volume of a prism defined on a triangle domain is obtained using formula 1. The TWO-TRIANGLES method computes the volume between two surfaces on the left triangle domain and on the right triangle domain of the th gird as follows:
(9) (8) denotes the surface area on the rectangular where and and are the first domain fundamental forms of the least-squared-error plane computed and The from the four points are first fundamental forms of the surface and where and are the first order with respect to and respectively. We derivatives of estimate at the th rectangular domain as the average value and Similarly, of is estimated as the average value of and Hence, the volume between a known surface and its reconstructed surface normalized by the known surface area becomes The following section discusses how the TWO-TRIANGLES method computes the volume and surface area.
and denote the volume between two where surfaces on the left and right triangle domain, respectively, and represents two surfaces. These equations do not explicitly take into account regions where two surface patches intersect (TWO-TRIANGLES-I takes this into account). The is obtained as follows volume between two surfaces, rectangular grid assuming a (10) is calculated as sum of areas of all left The surface area, and right triangles over the entire surface
IV. VOLUME AND AREA BY TWO-TRIANGLES APPROXIMATION TWO-TRIANGLES method approximates each surface patch by two triangles [Fig. 2(d)] instead of the least-squarederror plane described in the previous section. Each surface patch is approximated by two triangles in a consistent direction over an entire image. We triangulate each surface patch so that one triangle is defined by three points (we will call this left triangle) and the other triangle by three (we will call this right triangle) points as shown in Fig. 5. However, two triangles can be defined in the other consistent direction over the entire image, i.e, one and the other by triangle by Without loss of generality, we consider the case
(11) where fundamental forms of
and and
are the first , respectively.
V. VOLUME BETWEEN TWO SURFACES WHERE INTERSECTION OCCURS As mentioned in Section I-A, LSE-PLANE-I and TWOTRIANGLES-I use the same approximations of a surface
Authorized licensed use limited to: IEEE Xplore. Downloaded on March 30, 2009 at 23:55 from IEEE Xplore. Restrictions apply.
606
IEEE TRANSACTIONS ON SYSTEMS, MAN, AND CYBERNETICS—PART A: SYSTEMS AND HUMANS, VOL. 28, NO. 5, SEPTEMBER 1998
patch as in LSE-PLANE and TWO-TRIANGLES, respectively. However, a different approach is used by LSE-PLANEI or TWO-TRIANGLES-I in the computation of the volume between two surfaces in regions where two surface patches intersect. In the intersecting regions, they compute in the same way the volume between two surface patches by decomposing it into tetrahedra. This section describes how the volume between two surface patches is computed by decomposing the volume into tetrahedra in these regions. For each grid domain, we test whether two surfaces intersect each other. We define an intersection test as follows. On the th grid domain If
The three subcases are identified by the signs of and where denotes and are computed vertices of the triangles. The points as intersection points of two straight lines. For these three subcases, the volume can be computed as the sum of one tetrahedron and one irregular prism which can be decomposed into three tetrahedra. Fig. 7(a) shows a prism, resulting from the first subcase of case 3 [Fig. 6(d)]. Fig. 7(b) is one example of possible decompositions of the prism into three tetrahedra. The volume of the prism, , shown in Fig. 7(a) is computed as tetrahedron tetrahedron
tetrahedron (12)
Thus the volume between two prisms in the cases of Fig. 6(a)–(c) is computed as
or
tetrahedron
tetrahedron (13)
i.e., all four points from the surface, are above or below the four points from the other surface, then the two surfaces do not intersect on the current domain. Otherwise, the two surfaces are considered to intersect on the current domain. When two surfaces are known to intersect on a grid domain according to this test, special consideration is given in the computation of the volume between two surface patches on this grid domain. Each surface patch is approximated by two triangles as in the previous section, and the left and right triangle domains are considered separately. If all three vertices of one triangle (surface) are above or below three vertices of the other triangle (surface) on a triangle domain, two surfaces are considered nonintersecting on this triangle domain. The intersection occurs in the other triangle domain. In the intersecting triangle domain, the volume between two surface patches is decomposed into tetrahedra. The following three cases have to be considered for each left and right triangle domain when the above intersection test is true: • case 1: two triangles do not intersect; • case 2: two triangles intersect with one shared vertex. See Fig. 6(a)–(c); • case 3: two triangles intersect without shared vertices. See Fig. 6(d)–(f). Without loss of generality, we describe the case of the left triangle domain (Fig. 6). In case 1, the volume between two prisms can be simply computed as the absolute value of the difference of each prism’s volume as in TWO-TRIANGLES method [(9)]. In case 2, there are three subcases, (a)–(c), depending on the location of the shared vertex. Each subcase The is determined by the location of the shared vertex is easily computed as the intersection point of two point straight lines. In each subcase, the volume between two prisms is computed as the sum of two tetrahedra. Case 3 also has three and subcases depending on the location of the points
In the cases of Fig. 6(d)–(f) tetrahedron tetrahedron tetrahedron tetrahedron The computation of points, pendix A.
and
(14) is presented in Ap-
VI. COMPUTATIONAL EFFICIENCY In this section, we analyze the computational cost of the four methods of computing the volume between two surfaces and the surface area. For simplicity, it is assumed that the cost of taking the absolute value or a logical operation (“OR” operation in the intersection test) is equivalent to that of an addition. We also assume that the constants such as and in (5), (8), (10), and (11) are computed in advance. Images are assumed to be of size represents the fraction of intersecting regions. The following is the number of operations for the four methods. 1) LSE-PLANE method a) b)
additions volume: cation. additions area: square root operations multiplications.
1 multipli-
2) TWO-TRIANGLES method a) b)
additions volume: plication. additions area: square root operations multiplications.
Authorized licensed use limited to: IEEE Xplore. Downloaded on March 30, 2009 at 23:55 from IEEE Xplore. Restrictions apply.
1 multi-
YI AND CHELBERG: AN INVARIANT PERFORMANCE MEASURE
607
Fig. 6. (a)–(c) Three subcases of case 2: one vertex is shared. (d)–(f) Three subcases of case 3: no vertex is shared. triangle1 and triangle2 are represented by z 1 (x; y ) = a1 x + b1 y + c1 and z 2 (x; y ) = a2 x + b2 y + c2 ; respectively.
3) LSE-PLANE-I method a)
b)
(8 additions 1 volume: (71 additions 108 multiplimultiplication) 7 divisions) . cations area: same as in the method 1.
4) TWO-TRIANGLES-I method a)
b)
(10 additions volume: 1 multiplication) (71 additions 108 multi7 divisions) . plications area: same as in the method 2.
In order to speed up the computation, a simple caching scheme is used. In (7) of the LSE-PLANE method, the partial computed in the previous resums gion is cached and used in the next region without recomputing
(a)
(b)
Fig. 7. (a) A prism resulting from the first subcases of case 3 and (b) a decomposition of (a) into three tetrahedron.
them. In (10) of the TWO-TRIANGLES method, the partial in the left triangle domain are sums, cached for reuse in the right triangle domain. In computing and the surface area,
Authorized licensed use limited to: IEEE Xplore. Downloaded on March 30, 2009 at 23:55 from IEEE Xplore. Restrictions apply.
608
IEEE TRANSACTIONS ON SYSTEMS, MAN, AND CYBERNETICS—PART A: SYSTEMS AND HUMANS, VOL. 28, NO. 5, SEPTEMBER 1998
(a)
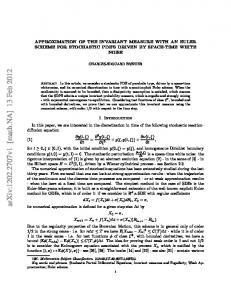
(b) Fig. 8. Surface plot of z1 (i; j ) when (a)
T
= 13:0 and (b)
T
= 26:0:
are cached in (8) of the LSE-PLANE method for reuse in the next region. In computing the volume using the methods LSE-PLANE-I and TWO-TRIANGLES-I, the intersection test requires five additions and the test results can be reused for identifying the three cases described in the previous section. and is added to The cost of identifying the points the cost of computing the volume of four tetrahedra. For simplicity, the cost of identifying subcases is ignored. From the above analysis, we can see that the method using the leastsquared-error plane approximation (LSE-PLANE method) is the most efficient in computing the volume between two
surfaces normalized by the surface area. Experimental results in the following section verify this analysis.
VII. EXPERIMENTAL RESULTS In this section, we report on the accuracy and the computational efficiency of the four methods described in the previous section. For an accuracy test, the volume between two surfaces and the surface area computed from the four methods are compared with exact known values of known volume and surface area. The following synthetic graph surfaces were used
Authorized licensed use limited to: IEEE Xplore. Downloaded on March 30, 2009 at 23:55 from IEEE Xplore. Restrictions apply.
YI AND CHELBERG: AN INVARIANT PERFORMANCE MEASURE
609
Fig. 9. Period (T ) versus percentage of intersecting regions.
Fig. 11. Comparison of real area computed by the methods LSE-PLANE and TWO-TRIANGLES.
Fig. 10. Period (T ) versus error in computing the volume between two surfaces.
to test the accuracy of the above four methods:
if otherwise if
(15)
otherwise where The two surfaces, and are defined on a circular domain with radius 52.0 centered at (63, 63) in 128. A surface plot of is arrays of size 128 and 26.0. As the period shown in Fig. 8 when increases from a small value, the percentage of intersecting regions decreases as shown in Fig. 9 and the sampled surfaces (i.e., a high frequency surface) appear smoother. A small represents a rough sampling of an image. These images are general in that the surfaces are curved. Recall that LSEPLANE and TWO-TRIANGLES do not consider intersecting regions separately thus their performance is independent of the fraction of intersecting regions. We can see in Fig. 10 that the volume between two surfaces computed from the four methods quickly approaches the analytically computed
volume as increases. It is hard to visually distinguish between LSE-PLANE-I and TWO-TRIANGLES-I in this figure because they provide almost the same volume for this pair of images. Fig. 11 shows the surface area computed by LSEPLANE and TWO-TRIANGLES where LSE-PLANE can be seen giving a better approximation of the image surface than TWO-TRIANGLES. The computation time shown in Fig. 12 indicates that LSE-PLANE is computationally more efficient than the other three methods. An experiment was carried out to verify that LSE-PLANE is computationally more advantageous as the problem size gets larger. Images of six sizes are tested where 32, 64, 128, 256, different 512, 1024. The same form of surfaces (15) is used except is fixed to 10.0 and the radius of the disc domain is that so that two surfaces can maintain an defined as approximately constant rate of intersecting regions for different Fig. 13 shows that the percentage of intersecting size of regions is maintained approximately constant for various sizes of surfaces. The actual and theoretical computation time is illustrated in Figs. 14 and 15, respectively. The theoretical computation cost was computed from the analysis made in the previous section. For simplicity, the computational cost of addition, multiplication/division, and square root operations were assumed to be equal although in reality the square root operation is much more expensive than other operations. Only the computation of surface area involves the square root operation and TWO-TRIANGLES has more square root operations than LSE-PLANE. Therefore, this assumption does not change the order of computational efficiency of the four methods in Fig. 15. As can be expected, computation time for all four methods. The comincreases proportionally to putational cost for LSE-PLANE-I and TWO-TRIANGLESI (two upper curves in both figures) becomes much more expensive than LSE-PLANE and TWO-TRIANGLES as the problem size gets larger. The theoretical computation cost for LSE-PLANE and TWO-TRIANGLES is displayed again in Fig. 16 for a clear comparison. Shapes of plots for the actual (Fig. 14) and theoretical (Figs. 15 and 16) computation time strongly resemble each other. The use of method LSEPLANE is computationally more advantageous for large image sizes.
Authorized licensed use limited to: IEEE Xplore. Downloaded on March 30, 2009 at 23:55 from IEEE Xplore. Restrictions apply.
610
Fig. 12.
IEEE TRANSACTIONS ON SYSTEMS, MAN, AND CYBERNETICS—PART A: SYSTEMS AND HUMANS, VOL. 28, NO. 5, SEPTEMBER 1998
Computation time of four methods for two (128
2 128) surfaces.
Fig. 13. The percentage of intersecting regions is almost the same for various sizes of surfaces.
Fig. 15. Problem size versus relative computation times (theoretical), # ops. denotes number of operations.
Fig. 16. Problem size versus relative computation times (theoretical) for LSE-PLANE and TWO-TRIANGLES. This is a close up of lower two curves of Fig. 15. # ops. denotes number of operations.
TABLE II V/A MEASURE FOR THE RECONSTRUCTION RESULTS FROM TWO DIFFERENT RECONSTRUCTION METHODS, A AND B LSE-PLANE LSE-PLANE-I TWO-TRIANGLES TWO-TRIANGLES-I
Fig. 14.
Problem size versus relative computation times (experimental).
We now present an example where this proposed algorithm is used for the comparison of different surface reconstrucvalues tion techniques, A and B. Table II shows the computed from the four methods described in earlier sections for reconstruction results of a sparse image reported in [20]. Fig. 17(a) and (b) show the original noiseless and noisy images, respectively. This curved-inclined image has three and two curved surfaces flat, two inclined (slope 1 and (curvature and and 50% of pixels of the image are
method A 0.6770 0.7198 0.6966 0.7198
method B 0.2176 0.2383 0.2254 0.2383
performance ratio 3.11 3.02 3.09 3.02
randomly deleted. The reconstructed surfaces from the two different methods, A and B, are shown in Fig. 17(c) and (d), give almost respectively. The four methods of computing the same performance ratio (in the last column of Table II) for values are slightly the reconstruction results although the different for each method. The performance ratio is computed for method A)/( for method B). The values as ( allow us to quantify the performance of reconstruction method B as being three times better than that of method A. VIII. CONCLUSION We propose the volume between two surfaces normalized by surface area as an invariant measure for comparing
Authorized licensed use limited to: IEEE Xplore. Downloaded on March 30, 2009 at 23:55 from IEEE Xplore. Restrictions apply.
YI AND CHELBERG: AN INVARIANT PERFORMANCE MEASURE
611
Fig. 17. Reconstruction results from two different reconstruction methods, (c) method A and (d) method B, along with V =A measure computed using the LSE-PLANE method for a sparse image of which sparseness is 50%.
reconstruction results of the explicit form, This measure is interpreted as the average distance between two surfaces. We have presented a new computationally simple and efficient method of computing the volume between two surfaces and the surface area by the least-squared-error plane approximation of a surface patch. These new methods for computing volume and surface area were successfully applied in [20] and [21] to compute the proposed invariant performance measure for surface reconstruction. Given the fact that a reconstructed surface is an approximated surface and the surface shape is ambiguous in regions between pixels, the described method of the least-squared-error plane approximation gives accurate estimates of the volume between two surfaces and the area of a surface. The advantages of our method are that computation is extremely simple and efficient. A standard quantitative measure for the comparison of different reconstruction techniques allows analysis of different reconstruction algorithms when applied to the same input data. This ability to objectively compare different algorithms will facilitate further research in the area of surface reconstruction.
APPENDIX COMPUTATION OF The points, follows: a)
and
AND
in Fig. 6(a)–(f) are computed as
b)
Authorized licensed use limited to: IEEE Xplore. Downloaded on March 30, 2009 at 23:55 from IEEE Xplore. Restrictions apply.
612
IEEE TRANSACTIONS ON SYSTEMS, MAN, AND CYBERNETICS—PART A: SYSTEMS AND HUMANS, VOL. 28, NO. 5, SEPTEMBER 1998
c)
[11] J. Marroquin, S. Mitter, and T. Poggio, “Probablistic solution of illposed problems in computational vision,” J. Amer. Statist. Assoc., vol. 82, pp. 76–89, Mar. 1987. [12] P. Perona and J. Malik, “Scale-space edge detection using anisotropic diffusion,” IEEE Trans. Pattern Anal. Machine Intell., vol. 12, pp. 629–639, July 1990. [13] S. S. Sinha and B. G. Schunck, “A two stage algorithm for discontinuitypreserving surface reconstruction,” IEEE Trans. Pattern Anal. Machine Intell., vol. 14, pp. 36–55, Nov. 1988. , “Discontinuity preserving surface reconstruction,” in Proc. IEEE [14] Int. Conf. Computer Vision Pattern Recognition, San Diego, CA, June 1989, pp. 229–234. [15] R. L. Stevenson and E. J. Delp, “Viewpoint invariant recovery of visual surfaces from sparse data,” IEEE Trans. Pattern Anal. Machine Intell., vol. 14, pp. 897–909, Sept. 1992. [16] R. Szeliski, “Bayesian modeling of uncertainty in low-level vision,” Int. J. Comput. Vision, vol. 5, no. 3, pp. 271–301, 1990. , “Fast surface interpolation using hierarchical basis functions,” [17] IEEE Trans. Pattern Anal. Machine Intell., vol. 12, pp. 513–520, June 1990. [18] D. Terzopoulos, “Regularization of inverse visual problems involving discontinuities,” IEEE Trans. Pattern Anal. Machine Intell., vol. 8, pp. 413–423, July 1986. , “The computation of visible-surface representations,” IEEE [19] Trans. Pattern Anal. Machine Intell., vol. 10, pp. 417–438, July 1988. [20] J. Yi and D. M. Chelberg, “Discontinuity-preserving and viewpoint invariant reconstruction of visible surfaces from sparse data using a first order regularization,” in Proc. Int. Conf. Automation, Robotics, Computer Vision, Singapore, vol. 1, pp. cv5.1.1–cv5.1.5, Sept. 1992. , “Discontinuity-preserving and viewpoint invariant reconstruc[21] tion of visible surfaces from sparse data using a first order regularization,” IEEE Trans. Pattern Anal. Machine Intell., vol. 17, pp. 624–629, June 1995. [22] S. Lang, Analysis I. Reading, MA: Addison-Wesley, 1969. [23] G. Strang, Linear Algebra and Its Applications, 3rd ed. Orlando, FL: Harcourt Brace Jovanovich, 1986.
d)
e)
f)
where and REFERENCES [1] J. Aloimonos and D. Schulman, “Learning early-vision computations,” J. Opt. Soc. Amer., vol. 6, June 1989. [2] A. Blake, “Reconstructing a visible surface,” Proc. AAAI Conf., 1984, pp. 23–26. [3] A. Blake and A. Zisserman, “Invariant surface reconstruction using weak continuity constraints,” Proc. IEEE Int. Conf. Computer Vision Pattern Recognition, Miami, FL, June 1986, pp. 22–26. [4] T. E. Boult and J. R. Kender, “Visual surface reconstruction using sparse depth data,” in Proc. IEEE Int. Conf. Computer Vision Pattern Recognition, Miami, FL, June 1986, pp. 68–76. [5] C. Chu and A. C. Bovik, “Visible surface reconstruction via local Minimax approximation,” Pattern Recognit., vol. 21, no. 4, pp. 303–312, 1988. [6] D. Geiger and F. Federico, “Parallel and deterministic algorithms from MRF’s: Surface reconstruction,” IEEE Trans. Pattern Anal. Machine Intell., vol. 13, pp. 401–412, May 1991. [7] S. Geman and D. Geman, “Stochastic relaxation, Gibbs distributions, and the Bayesian restoration of images,” IEEE Trans. Pattern Anal. Machine Intell., vol. 6, pp. 721–741, Nov. 1984. [8] W. E. Grimson and T. Pavlidis, “Discontinuity detection for surface reconstruction,” Comput. Vision, Graphics, Image Process., vol. 30, pp. 316–330, 1985. [9] V. E. Johnson, W. H. Wong, X. Hu, and C. Chen, “Image restoration using Gibbs priors: Boundary modeling, treatment of blurring, and selection of hyperparameter,” IEEE Trans. Pattern Anal. Machine Intell., vol. 13, pp. 413–425, May 1991. [10] S. Z. Li, “Invariant surface segmentation through energy minimization with discontinuities,” Int. J. Comput. Vision, vol. 5, no. 2, pp. 161–194, 1990.
June Ho Yi (S’92–M’94) received the B.S. degree from Seoul National University, Seoul, Korea, in 1985, the M.S. degree from the Pennsylvania State University, University Park, in 1987, and the Ph.D. degree from Purdue University, West Lafayette, IN, in 1994, all in electrical engineering. In 1989, he was a Research Scientist at the Samsung Advanced Institute of Technology. From 1994 to 1995, he was a Postdoctoral Research Scientist at the University of California, Riverside. From 1995 to 1996, he was a Senior Research Scientist at the Korea Institute of Science and Technology, Seoul. He is currently an Assistant Professor with the School of Electrical and Computer Engineering at Sungkyunkwan University, Suwon, Korea. His research interests are broadly in the areas of computer vision and vision-based computer interation. Dr. Yi is a member of Eta Kappa Nu.
David M. Chelberg (S’87–M’88) was born in Chicago, IL, on February 16, 1960. He received the B.S. degree in mathematics with honors from Stanford University, Stanford, CA in 1981, and the Ph.D. degree in computer science from Stanford University in 1989. From 1989 to 1996, he was an Assistant Professor of Electrical Engineering at Purdue University, West Lafayette, IN. He is currently an Associate Professor of Electrical Engineering and Computer Science at Ohio University, Athens. His research interests include range image processing, medical image processing, computer vision, three-dimensional object recognition, scientific visualization, and computer graphics. Dr. Chelberg is a member of the Association for Computing Machinery and Phi Beta Kappa.
Authorized licensed use limited to: IEEE Xplore. Downloaded on March 30, 2009 at 23:55 from IEEE Xplore. Restrictions apply.