An Investigation of Model-Based Microdata Masking for Magnitude Tabular Data Release Mario Trottini1 , Krish Muralidhar2 , and Rathindra Sarathy3 1
University of Alicante, Apartado de Correos 99, Alicante, Spain
[email protected] 2 University of Kentucky, Lexington, KY 40506
[email protected] 3 Oklahoma State University, Stillwater, OK 74078
[email protected]
Abstract. Traditionally, magnitude tabular data and microdata masking have been treated as two independent problems. An increasing number of government agencies are exploring establishing remote data access centers where both types of data release may occur. We argue that in these cases, consistency across both types of data release becomes an important component in the assessment of the performance of a certain masking and a common approach to the problem of masking both tabular and microdata would produce better results than approaches that address the two problems separately. Along this line, in this study we investigate the efficacy of using a model based microdata masking method (specifically Data shuffling) when the data is also used for magnitude tabular data release. We identify some aspects of our proposal that are important in addressing this issue further to perform a comprehensive evaluation of techniques suitable for both microdata and magnitude tabular data release. Keywords: Data shuffling, disclosure risk, information loss, magnitude tabular data, masking, microdata
1
Introduction
In recent years, there have been a number of studies that have addressed the issue of microdata and tabular data in the statistical disclosure limitation literature. This has resulted in a number of fine techniques for protecting sensitive confidential information when this information is released to the public. A closer look at the literature however, also reveals a separation between studies that address microdata methods and tabular data methods. Even the Report on Statistical Disclosure Methodology produced by the Federal Committee on Statistical Methodology treats the two approaches as distinct from one another. Such a separation cannot be explained simply by the different focus of these two types of data release (for microdata, the focus is on individual records while with magnitude tabular data, the focus is on aggregated magnitudes) but rather
II
is the result of important differences in two key aspects of the disclosure scenarios underlying microdata and magnitude tabular data release: (1) the assumed intruders prior knowledge and (2) the type of the analysis that users might want to perform using the released data. These aspects play a key role in disclosure risk and data utility assessment and thus in the definition of the optimal masking procedure. For (magnitude) tabular data, very specific assumptions are made regarding the intruders prior knowledge. For example, it is assumed that identity of the individuals or entities whose data is released in tabular form is known and hence disclosure of identity is not an issue for magnitude data. With microdata, it is often (although not always) assumed that the identity of the masked microdata is not known. Consequently, sampling alone provides considerable protection from disclosure for microdata which is not the case for tabular data. Another important difference is that while a variety of different assumptions about intruders’ prior knowledge characterize different approaches to microdata masking, for (magnitude) tabular release it is usually assumed that each respondent can estimate to within 100% the actual value of the sensitive variable (that define the magnitude table) for any other respondent. This is explicitly assumed for large cell values because of the sampling design but is implicitly extended to all cell values in the table when disclosure is assessed according with standard sensitive measures such as the p% rule, the (p,q) rule or the (n,p) rule. The second important difference relates to the analysis that the users are expected to perform with the data that is released. Typically, the type of statistical analysis that is performed on masked microdata is unspecified, and the type and sophistication of statistical analysis that may be performed on the released data are usually very diverse (see for example [14]). In terms of disclosure risk and data utility assessment this requires to view the released microdata as an initial product that will be the input of (possibly sophisticated) inference analysis. By contrast, the published cell values of a magnitude table are usually viewed as the “final product” rather than as objects of further research. This again has a direct impact on disclosure risk and data utility assessment. In our opinion the above discussion of the differences that characterize microdata and magnitude tabular release explains the separation of the methods that address statistical disclosure control for these two types of data release but do not provide an argument for such separation. There are, in fact, several reasons to maintain consistency between microdata and magnitude tabular release (and alternative forms of data release in general). The first reason to maintain consistency between the two types of data is that data is released to the public in order to convince them that the statistical disclosure methods employed are effective both in providing meaningful data for analysis purposes and in preventing disclosure of confidential information. Many government agencies generate both tabular and microdata for public consumption. If different methods are used to protect microdata and tabular data, then it is possible that a comparison of the two releases could lead to inconsistencies in the released data. From a statistical disclosure limitation perspective, it is pos-
III
sible that the different methods employed to protected microdata and tabular data are indeed the best methods individually. But if the two protection methods yield completely different results, the public is likely to mistrust the entire data release. Hence, there is a need to ensure that when different forms of the same data are released, that the entire data release is consistent when analyzed. Several articles also comment on the relative advantages and dis-advantages of the two approaches ([7], [6], [16]). Giessing also describes an experiment by H¨ohne along these lines as well (see [3] and [4]). Another reason that consistency across multiple forms of data release must be maintained relates to remote data access centers. In recent years, several government agencies have shown an interest in developing remote data access centers ([11], [13], [5], [1], [12], [9]). The primary objective of these centers is to provide the public with the ability to remotely query and receive response from data gathered by government agencies. When such data include sensitive confidential information, statistical disclosure limitation methods are often employed to protect the data. From a practical perspective, remote data access centers make perfect sense given the computing power and the easy availability of statistical analysis software. Remote data access centers also eliminate the need for separate forms of data release. Such integration is not only beneficial from an administrative perspective, but also allows the users much greater flexibility in their analyses. But this also means that it is possible for the same user to issues queries that involves statistical analyses using microdata and results from tabulating the same data. If the user were to receive different responses for the same type of analyses, then this is likely to lead to mistrust of the results of both types of analyses. Hence, in the context of remote data access centers, the issue of maintaining consistency across different types of analyses becomes even more important. Maintaining consistency across all types of data is important. In this study however, our focus is limited to the case of sensitive numerical microdata that are analyzed through remote data access centers and/or are released as microdata and/or are released as magnitude tabular data. Given that existing methods for statistical disclosure limitation for microdata and tabular data are quite different, the possibility of finding two different approaches for microdata and tabular data is likely to be very difficult. Hence, we take the approach of using a same method for both analyses involving microdata and magnitude tabular data releases (without precluding the possibility of selecting two different methods to provide consistent results across the analyses). Finally, we have two options in the selection of the method for protecting the data, namely: (i) select a method designed to protect magnitude tabular data and employ it to protect microdata; and (ii) select a method designed to protect microdata and use the masked microdata to generate the tabular results. [3] illustrates the possibility of using the first approach. In this study, we choose to investigate the latter approach. In particular, we address the efficacy of a microdata masking mechanism to protect magnitude tabular data for the special case where the sensitive variables are numerical.
IV
The problem is not new in the literature on statistical disclosure control. As discussed earlier, [4], [7], [6] and [16], for example, have investigated the advantages and disadvantages of applying microdata masking methods for magnitude tabular data using the noise addition/multiplication approaches adapted specifically for magnitude tabular data. In addition, for microdata, model based approaches have generally been shown to have both lower disclosure risk and information loss characteristics compared to noise addition methods. Motivated by the better performance of model based method compared to noise methods in masking microdata, in this study we provide a preliminary investigation of the potential of using a general, model based microdata masking methods to protect magnitude tabular data. For illustration purposes only, we will use Data shuffling (DS) as model based masking method for the underlying microdata without implying that data shuffling is necessarily the best model based masking method. In order to motivate the problem, in Section 2 we present a simple example of inconsistent responses. In section 3 we present an empirical evaluation of the performance of DS. Section 4 summarizes our main findings and outline ideas for future work.
2
A Simple Example of Inconsistent Responses
In this section, we provide a simple example to illustrate the problem of inconsistent responses. The data for this illustration consists of the values of two variables, one binary categorical (X1 ) and the other numerical (X2 ), observed in ten sample units. We assume that the agency with the data plans to release both the microdata and the magnitude table obtained by cross-classifying X2 with respect to X1 . We now illustrate the impact on the results if the tabular and microdata masking were performed independently. In particular we assume that: (i) for the magnitude table, the agency uses a simple masking technique consisting on adding to the value of the sensitive cells the minimum amount of perturbation that is needed to make the cell safe according to the p = 25% rule and modify the value of the non-sensitive cells accordingly in order to maintain the marginal total for X2 ; (ii) for the microdata, the agency adopts noise addition with noise variance equal to 20% of the variance of X2 (the noise was added from a normal distribution with zero mean and the specified variance). Table 1 provides the results of applying the two types of masking. Cell 1 and Cell 2 represent the classification by the binary categorical variable X1 , resulting in 5 records in each cell. The original values of the numerical variables are provided in the first column of the table. The true cells sums are provided in the second column. The p% rule is used to evaluate the sensitivity of a given cell using the following expression x1 − (
n X 100 )· xi < 0. p i=c+2
(1)
where c represents the size of the collusion and the data in a given cell are ordered from largest to smallest x1 > x2 > . . . > xn . If equation (1) is satisfied,
V
this implies that no respondents value can be estimable more accurately than within p% and the cell is classified as non-sensitive. However, when the equation (1) is not satisfied, then releasing the unmodified cell total will result in the colluding group being able to estimate the value of x1 to within p%, resulting in disclosure. Hence, the cell is classified as sensitive. Table 1. : Results of applying independent masking to the data p% rule p% rule Original True p% rule Modified Perturbed satisfied Perturbed evaluation values cell sum evaluation cell sum Values for cell sum for (20% noise) individual perturbed records ? sum 20 21.0 No 5 Sensitive 6.0 No Sensitive Cell 1 1 28 Cell 30 0.5 Yes 27.8 Cell 1 0.2 Yes 1 0.1 Yes 30 Non31.5 No Non20 Sensitive 24.7 No Sensitive Cell 2 10 74 Cell 72 10.9 No 82.2 Cell 10 9.3 No 4 5.8 Yes
Traditionally, this evaluation is performed assuming that no collusion takes place (i.e. c = 1). In this case, we can modify the expression above as follows: x1 − (
n 100 X xi < 0 )· p i=3
(2)
Using equation (2) , it can be verified that Cell 1 would be classified as sensitive while Cell 2 would be classified as non-sensitive. Simple algebra show that the absolute value of the amount of perturbation that is required for Cell 1 to be safe based on the p% rule (also called nominal perturbation) is 2. Thus we change the value of Cell 1 to 30 and the value of Cell 2 to 72 in order to preserve the marginal total of X2 . As observed before, application of the p% rule for tabular data implies that no respondents value should be estimable more accurately than within p%. Yet, for six of the ten records in the masked microdata, the perturbed values are within 25% of the true value. Hence, the application of the p% rule principle to the perturbed microdata would imply a violation of the rule. At the very least, in order to rectify this situation, it would be necessary to increase the noise variance in order to account for the p% rule. Even if the agency were to increase the noise variance, there is no guarantee that the perturbed data would satisfy
VI
the p% rule for the following reason. The p% rule is inherently a deterministic rule which requires that the actual magnitude be different by at least a certain quantity. By contrast, all noise addition approaches are probabilistic where there is no guarantee that every value would be modified by at least a certain quantity. This random component is necessary in order to preserve the statistical characteristics of the microdata. The above discussion suggests that treating microdata and tabular data release as two separate problems might lead to use masking techniques which assume inconsistent disclosure scenarios. In our example the disclosure risk requirements seem to be not the same for tabular and microdata release and this represent an evident inconsistency since the interpretation of disclosure should be independent of the choice of data release. Even if the agency carefully defines the common disclosure scenario underlying tabular and microdata release the results of tabular and microdata masking still would be different. In our case, for example, the agency might decide to use multiplicative noise with a noise distribution that guarantees that the p% rule is satisfied for the masked microdata records (see [7]). However, this would still imply that the cell totals obtained from the masked microdata would be different form the cell totals obtained by the independent masking of the magnitude table that we described in the example. In some cases, the agency may not release microdata at all, but allow users access to perform statistical analyses on the perturbed data as would be the case in remote access systems. Note that, in order to prevent disclosure, we assume that the analyses are still performed on the perturbed data. From the data in Table 1 above, consider the categorical variable to be the Gender variable with Cell 1 = “Female” and Cell 2 = “Male” and the numerical to be Income measured in thousands of dollars. The user could perform a general linear model analysis on this data which would result in the release of the (perturbed) cell means for the two groups. The release of this information would violate the p% rule as shown in Table 1 above. Thus, even if microdata are not released, results of statistical analyses could provide the users with information that contradicts magnitude data release as tables. It is possible that in these situations, the agency imposes additional controls in order to maintain consistency between the results. However, if microdata is released and/or users are allowed to perform ad hoc statistical analyses through a remote access system, it would be very difficult for the agency to consider all potential analyses that can be performed on the data. Hence, it would be very difficult to eliminate the potential for contradictions between the results between magnitude tabular data and microdata/remote access both in terms of the results of the masking and in terms of the assumed disclosure scenario. In such situations, it would be beneficial to consider the possibility of using a consistent approach for masking the data. As discussed earlier, there are two potential approaches to achieve this objective. The first is to use a tabular masking approach and the second is to use a microdata masking approach. We do not have any evidence to suggest that the first approach is not a viable method for addressing the problem, and we certainly do not preclude that possibility.
VII
Our interest in this study, however, is to evaluate the efficacy of using a microdata masking approach for both data released in the form of magnitude tables and when released as microdata or used for statistical analyses through remote access centers. Thus, our primary focus is on evaluating the extent to which microdata masked satisfies the disclosure risk and information loss requirements for magnitude tabular data.
3
Empirical Evaluation of Microdata Masking Methods for Tabular Data Release
In this study, for illustration purposes, we use DS as the microdata masking method for tabular data release. DS represents one of several model based microdata masking methods. Compared to other model based methods DS has the major advantage that the original numerical values are not modified but shuffled among different records. 3.1
Data Shuffling
Let X represent the set of confidential variables and let S represent the set of non-confidential variables. In the DS procedure perturbed values for the sensitive variables are generated according to an approximation of the conditional distribution of X given S. The perturbed values are then used to make a “smart” shuffling of the original sensitive variable that are finally released. The shuffling is “smart” since it is made according to the ranks of values for the sensitive variables generated from an approximation of the conditional distribution of X given S. In the original version of the method, the approximation of such conditional distribution is obtained from the joint distribution of a random vector that has the same univariate margins and the same rank order correlation of the original data. Thus, to the extent to which rank order correlation is an appropriate measure of dependence for the original data, the DS procedure provide a shuffled data set that preserves both the marginals and the relevant features of the dependence structure of the original data. Since rank order correlation is a copula-based measure of dependence, (Gaussian) copulas provide the natural tool to implement the method (for a more detailed description of DS and its generalizations see [8] and [15]). 3.2
Simulation Study
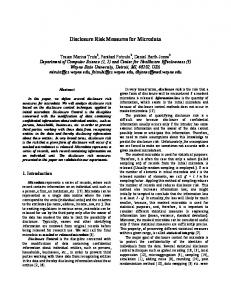
The effectiveness of DS as microdata masking method for (magnitude) tabular data release has been evaluated using an artificial microdata with 2738 respondents and six variables, three non-sensitive variables (two binary and one ordinal variable with six levels) and three numerical nonnegative sensitive variables with different degree of skewness. Figure 1 provides the frequency distribution of the sensitive variables and their skewness. Univariate summary statistics are shown in Table 2.
VIII
S3 (Skewness= 33.35 )
1e−03
S2 (Skewness= 1.83 )
8e−04 6e−04 Density 2e−04 0e+00
0.000
0.000
0.002
0.005
0.004
4e−04
0.006
Density
Density
0.010
0.008
0.010
0.015
0.012
S1 (Skewness= −0.04 )
50
100 S1
150
0
100
300
0
5000
S2
15000 S3
Fig. 1. Frequency distribution of the sensitive variables
Table 2. : Univariate summary statistics for the sensitive variables Min. 1st Qu. Median Mean 3rd Qu. Max. S1 (Symmetric) 17.35 83.99 100.70 100.70 117.10 177.30 S2 (Moderately skewed) 0.03 15.28 36.14 51.46 71.32 417.50 S1 (Highly skewed) 0 1.16 4.52 46.71 19.21 16310
IX
It is assumed that the agency has to released (possibly masked version of): (i) the original microdata; and (ii) the three magnitude tables corresponding to each of the three sensitive variables according with the cross classification induced by the non-sensitive (categorical) variables. Each magnitude table consists of 24 cells. The distribution of record counts for the 24 cells is shown in Table 3. As Table 3. : Distribution of record counts # records # cells # records # cells # records # cells # records # cells 3 1 17 1 71 1 281 1 4 1 19 1 72 1 309 1 6 1 20 1 73 1 415 1 7 1 22 1 83 1 476 2 8 2 25 1 98 1 12 1 60 1 173 1
shown in Table 3, the number of records (contributors) per cell in the magnitude tables ranges from 3 up to more than 400. We masked the original microdata using DS. The masking of the magnitude tables corresponding to the three sensitive variables follows automatically by considering the (masked) magnitude table induced by the masked microdata according to the cross classification defined by the non-sensitive (categorical) variables. 3.3
Results of the Simulation Study
We assessed the performance of DS, as masking method for the magnitude tables in the example, using the p% rule (with p=25%) to identify the sensitive cells, and the related “alpha error”(α) and “beta error” (β) coefficients discussed in [7] to assess disclosure risk and information loss. α is a measure of the amount of under-protection of the cells in the released magnitude table. For each cell of the original magnitude table we calculate the absolute value of the amount of perturbation that is required for the cell to be safe according to the p =25% rule (also called nominal perturbation). Denoting by frac(i) the ratio between the actual perturbation and the nominal perturbation for the i − th cell in the magnitude table, sensitive cells will be characterized by frac values smaller than one and up(i) = max{0, 1 − f rac(i)} can be assumed as a measure of underprotection for cell i. α is defined as the average of the up(i) values for the sensitive cells and can be interpreted as an overall measure of disclosure risk for the masked magnitude table. It takes value in the interval [0,1]. If all sensitive cells are fully protected α= 0 and if none of the sensitive cells receive protection, α= 1. Similarly β is a measure of the amount of over-protection of the cells in the released magnitude table. For each cell we evaluate the relative over- perturbation, op(i), defined as the relative difference of the actual perturbation and the
X
nominal perturbation. β is defined as the average of the op(i) values for the cells that are either safe or fully protected by the masking, and can be interpreted as an overall measure of information loss for the masked magnitude table. In the assessment we considered coalition sizes (c) for the p% rule ranging from 1 up to (n−2) where n is the size of the cell (the case c = n−2 corresponds to the worst case scenario in terms of disclosure). Figure 2 shows the percentage of sensitive cells as a function of the relative size of the coalition for each of the three magnitude tables in the example1 . As expected the number of sensitive cells increases as the coalition size and the level of skeweness of the data increase. Figure 3 provides the values α and β as a function of the relative size of the coalition for each of the three magnitude tables. Again as expected, α and β errors in general, regardless of the size of the coalition, increase with the level of skeweness. We observe, however, that while DS seems effective in preventing disclosure even for the magnitude table corresponding to the highly skewed variable S3 (the α error for the magnitude table corresponding to S3 is smaller than 0.1), its performance in terms of information loss deteriorates dramatically with the level of skeweness. The β error is approximately zero for the magnitude table corresponding to the symmetric variable S1 and increases up to 0.8 for the magnitude table corresponding to the highly skewed variable S3 . Similar results were found by [7] using additive noise as masking method for the underlying microdata. [6] described a possible modification of the additive noise technique called Balanced Noise aimed at reducing the β error (and thus increasing data utility) 2 . The amount of masking implied by the shuffling as a function of the cell counts and the features of the numerical variable underlying the magnitude table is shown in Figure 4. As one would expect, the amount of masking induced by shuffling, measured in terms of relative perturbation, increases with the level of skewness and decreases with the records counts of the cell (highly skewed data and small cell counts increases the chances of disclosure in a magnitude table). This result seems to suggest that shuffling provides an adaptive masking, that is, the masking increases with the riskiness of the cell.
4
Discussion and Conclusions
The primary objective of this study was to perform an investigation of the efficacy of using a general model based microdata masking method when the data is also used for magnitude tabular data release. Our research was motivated by the inherent differences between microdata and tabular data release relating to 1
2
A relative size of 0.6 means that the coalition size is 60% of the number of record counts of the cell, that is, c = (0.6 · n). For large n, c = 1 and c = n − 2 correspond (approximately) to relative size of 0 and 1. Modification of DS in this line could be defined as well considering, for example, a partial shuffling of the original data, excluding form the shuffling the records corresponding to safe cells. This modification however, goes beyond the goals of this study.
40
60
S1 (Skew.= −0.04 ) S2 (Skew.= 1.83 ) S3 (Skew.= 33.35 )
0
20
% sensitive cells
80
100
XI
0.0
0.2
0.4
0.6
0.8
1.0
Relative size of the coalition (c)
Fig. 2. Percentage of sensitive cells as a function of the relative size of the coalition
assumptions regarding both intruder prior information and the manner in which the data is viewed (as input for further analysis in the case of microdata and as the final output in the case of tabular data). These differences lead us to think of tabular and microdata masking as two separate problems which originate from very different disclosure scenarios and requires different techniques and a different assessment of the performance of these techniques. We argue that such a separation is not beneficial when an agency use both tabular and microdata (or remote access) releases and that a common approach to the problem of masking tabular and microdata would produce better results. The results presented in this paper are preliminary. In this section, we identify some aspects of our proposal that are important in addressing this issue further to perform a comprehensive evaluation of techniques suitable for both microdata and magnitude tabular data release. 4.1
Disclosure Scenario, and the Balance Between Disclosure Risk and Information Loss
As we illustrated with the simple example in Section 2, a precise definition of the disclosure scenario is a critical aspect when the agency plan to use different types of data releases for a collected data set. For the case considered here, where a public use microdata and magnitude tables must be released, the users might be the same and the disclosure scenario could also be the same if, for
XII
0.0 0.2 0.4
Alpha Error
Alpha Error S1 (Skew.= −0.04 ) S2 (Skew.= 1.83 ) S3 (Skew.= 33.35 ) ● ● ●
● ●
0.0
0.2
0.4
0.6
0.8
1.0
Relative size of the coalition (c)
0.0 0.4 0.8
Beta Error
Beta Error
●
●
● ●
● ●
0.0
0.2
0.4
0.6
0.8
1.0
Relative size of the coalition (c)
Fig. 3. Alpha and Beta errors a function of the relative size of the coalition
XIII
●
●● ● ● ● ●●
0
● ●
●
● ●
100
●
200
● ●
300
●
● ●
400
0.8 0.4
● ●
●
●
● ● ● ● ● ● ● ● ●
0.0
● ● ●
1.2
S2, Skewness= 1.83
Relative Perturbation
0.00 0.05 0.10 0.15
Relative Perturbation
S1, Skewness= −0.04
●
0
Cell counts
●●● ●● ●
100
●
200
● ●
300
●
●
400
Cell counts
0 1 2 3 4 5
Relative Perturbation
S3, Skewness= 33.35 ●
● ● ● ● ● ● ● ● ●● ● ●
0
●● ● ●
100
● ●
200
● ●
300
●
400
Cell counts
Fig. 4. Relative perturbation as a function of cell counts and skewness of the data
example, both releases are on the web with no restrictions. Failing to consider the common setting underlying the two data releases, in this case, would lead to inconsistencies that are difficult to justify in practice. Even assuming that a common disclosure scenario has been defined, the specification of global measures of information loss and disclosure risk remains a very difficult problem. From the disclosure risk side, for a given interpretation of disclosure we should be able to define: (i) risk measures both for microdata and tabular release that are consistent with the assumed notion of disclosure; and (ii) a global measure of disclosure, that in addition to the components defined in (i), should take into account the possibility that an intruder might combine the information in the published microdata with the information in the published tables. In this respect our proposal (and more in general masking a magnitude table via perturbation of the underlying microdata) has the important advantage that knowledge of the released microdata implies the knowledge of the released magnitude tables. Thus protecting the microdata also protects from attacks of an intruder who tries to combine the information in the released microdata with the information in the published tables. Note that this would not be the case if the microdata and the tabular data were masked independently. For independent masking disclosure risk assessment would be much more cumbersome because of (ii), which we believe provides an additional motivation for our proposal. Even in our case, however, the definition of risk measures both for microdata and tabular release that are consistent with the assumed notion of disclosure
XIV
is not a trivial problem. The principle underlying standard sensitive measures, such as the p% rule, apparently extends easily to microdata. We must require no respondents value (for the sensitive variable) should be estimable (based on the released microdata) within p%. Unfortunately the extension is not so simple. First of all, the p% rule, as defined, reflects the agencys perspective of the precision of an intruders estimates rather than the intruders perception of the precision of his/her estimates which is what really matters for disclosure risk assessment. In the derivation of the p% rule it is observed that if the original cell value would be published, the estimation error of a coalition of c respondents that want to estimate the value of the “largest” respondent in the cell would be equal to their error in estimating the sum of the non colluding group, which is smaller or equal than the sum of the non colluding group, (Coalition estimation error for x1 ) ≤
n X
xi .
(3)
i=c+2
The requirement that the estimate be no closer than p% of the value of x1 together with the upper bound for the coalitions estimation error in (3) produces the p% rule. Note, however, that the upper bound for the coalition estimation error in (3) is known to the agency but not to the coalition. The coalition will only have an estimation of such an upper bound and this estimation will not be very precise since, by hypothesis, the coalition can estimate each term in the sum in the right side of (3)) only within 100% of its true value. The assessment of the riskiness of a cell should take into account the coalition uncertainty about the actual value of the upper bound in (3). The corresponding modified p% rule would be then consistent with traditional assessment of disclosure risk for microdata where the level of security is often expressed as some measure of the variance in estimation of the value of individual records. Another issue is that even for the modified p% rule it would be difficult to extend the notion of disclosure risk assessment for the microdata under coalitions of respondents. With respect to information loss, a global measure should take into account not only the extent to which the masked microdata and tabular release “differ” from their corresponding versions based on the original data but also the extent to which the information on the two data release is consistent. In this respect our proposal (and, in general masking a magnitude table via perturbation of the underlying microdata) has the important advantage that consistency holds automatically. As we shown in section 2, this would not be the case if the microdata and the tabular data were masked independently which, we believe, provide an additional motivation for our proposal. 4.2
Over-protection
Our results indicate that when disclosure risk assessment is performed from the traditional tabular data perspective, the masked microdata, in general, performs well in preventing disclosure of sensitive cells. The results, however, are not quite as encouraging for information loss. When information loss is evaluated
XV
from the traditional tabular data perspective, our results indicate that model based microdata masking techniques tend to protect even safe cells resulting in information loss. Even for sensitive cells, in some cases, the level of masking is quite high, resulting in relatively high information loss. As we observed in section 3, similar results were found by [7] using additive noise as masking method for the underlying microdata. [6] described a possible modification of the additive noise technique called Balanced Noise aimed at reducing the β error (and thus increasing data utility). Research on the same line should be done to design modified version of DS (and more in general of model based masking methods) that could preserve the good performance of these microdata masking in terms of disclosure risk while reducing the information loss associated with the tabular release. 4.3
Distributional Characteristics of the Data
A third issue that is of importance deals with the distributional characteristics of the data. It is well understood that this is of critical importance for microdata since changes in distributional characteristics can have a detrimental impact on statistical analyses performed on microdata. For magnitude tabular data however, information loss is often characterized only by the change in the magnitude of the table value that is released. [3] has recognized that distributional characteristics can have a significant impact on magnitude tabular data. Our analysis in this study supports this conclusion. Our results indicate that the performance of microdata masking mechanisms will vary considerably with the underlying characteristics of the data. 4.4
Adapting Magnitude Tabular Methods for Microdata
Another key question that should be investigated relates to the ability of methods used to modify magnitude tabular data output to masking microdata. [3] provides some preliminary results regarding the possibility of this type of approach, but does not directly address the issue of microdata release. One reasonable question that naturally arises is whether methods used for magnitude tabular data can be adapted for releasing microdata (or other non-tabular statistical analyses involving microdata). This approach would almost definitely eliminate cell suppression as a potential approach since this would imply that this microdata is unavailable for further analyses. But approaches such as controlled tabular adjustment ([2]) and others eliminate the need for suppression of values. An important question that deserves more attention is whether it would be possible to adapt these approaches to perturbing microdata consistent with the results for tabular data. 4.5
Input versus Output Masking
In the most general terms, the question of magnitude tabular data masking and microdata masking can be classified under the more general issue of input versus
XVI
output masking mechanisms. Input masking mechanisms modify the individual data records and respond to all queries using the masked data. With output masking mechanisms, the response to the query is computed using the original data and the response is modified to generate the actual output to the user. There is a need to investigate the relative benefits of both approaches. This issue gains even more importance when we consider that many government agencies are considering remote query access systems. We believe that the magnitude tabular data is simply one manifestation of the bigger problem of the relative benefits of input versus output masking techniques. Finally, it is important to note that the analysis presented in this study evaluates the performance of microdata masking methods based on performance metrics developed for tabular data release. Tabular data masking methods were developed specifically to satisfy these performance metrics. Hence, a comparison of microdata masking versus tabular data masking naturally favor the tabular data masking methods. A fair comparison would involve the evaluation of both microdata masking and tabular data masking methods using performance metrics developed for both tabular data and microdata, which, as we observed in 4.1, should also take into account the consistency of the information in the two types of data release. We believe that this is an important area for future research.
References 1. Chipperfield, J., Yu F.: Protecting Confidentiality in a Remote Analysis Server for Tabulation and Analysis of Data. UNECE Work session on Statistical Disclosure Limitation, October 26-28, Tarragona, Spain (2011). 2. Dandekar R. A., Cox L. H.: Synthetic Tabular Data: An Alternative to Complementary Cell Suppression, unpublished manuscript (2002). 3. Giessing, S.: Post-tabular Stochastic Noise to Protect Skewed Business Data. UNECE Work Session on Statistical Disclosure Limitation, October 26-28, Tarragona, Spain (2011). 4. H¨ ohne, J.: Anonymisierungsverfahren fr Paneldaten. In Springer, Wirtschafts- und Sozialstatistisches Archiv, Bd. 2, 259–275 (2008) 5. Honinger, J., H¨ ohne J.: Morpheus Remote Access to Microdata with a Quality Measure. UNECE work session on Statistical Disclosure Limitation, October 26-28, Tarragona, Spain (2011). 6. Massell, P. , Funk, J.: Protecting the Confidentiality of Tables by Adding Noise to the Underlying Microdata. Proceedings of the 2007 Third International Conference on Establishment Surveys (ICES-III), June 18-21, Montreal, Canada (2007). 7. Massell, P., Zayatz L., Funk J.: Protecting the Confidentiality ofTables by Adding noise to the Underlying Microdata: Application to the Commodity Flow Survey. In J. Domingo-Ferrer and L. Franconi (Eds.), Privacy in Statistical Databases, LNCS 4302, 304 – 317 (2006). 8. Muralidhar K., Sarathy, R.: Data Shuffling: A New Approach for Masking Numerical Data. Management Science, 52, 658–670 (2006). 9. O’Keefe, C. M., Good, N. M.: Regression Output from a Remote Analysis Server. Data & Knowledge Engineering, 68, 1175–1186 (2009). 10. Roberts, D.: Cell Suppression: Experience and Theory. In J. Domingo-Ferrer (Ed.), Inference Control in Statistical Databases, LNCS 2316, 8–20 (2002).
XVII 11. Simard, M.: Progress with Real Time Remote Access. UNECE work session on Statistical Disclosure Limitation, October 26-28, Tarragona, Spain (2011). 12. Sparks, R., Carter, C., Donnelly J. B., O’Keefe C. M., Duncan, J., Keighley, T., McAullay D.: Remote Access Methods for Exploratory Data Analysis and Statistical Modelling: Privacy-Preserving Analytics TM, Comput Methods Programs Biomed 91, 208–222 (2008). 13. Tarkoma, J.: Remote Access in Statistics Finland. UNECE work session on Statistical Disclosure Limitation, October 26-28, Tarragona, Spain (2011). 14. Trottini, M., Franconi, L., Polettini, S.: Italian Household Expenditure Survey: A proposal for Data Dissemination. In J. Domingo-Ferrer and L. Franconi (Eds), Privacy in Statistical Databases, LCNS 4302, 318–333 (2006). 15. Trottini, M., Muralidhar K., Sarathy, R.: Maintaining Tail Dependence in Data Shuffling Using t Copula. Statistics & Probability Letters, 81, 3, 420–428 (2011). 16. Zayatz, L.: New Implementations of Noise for Tabular Magnitude Data, Synthetic Tabular Frequencies and Microdata, and a Remote Microdata Analysis System. Statistics#2007-17, Research Report Series, US Census Bureau (2007).