crown; Rs the signature of shadowed crown; g the pro- terrain on forest reflectance have ... surface element will face the viewer given that it is. (terrain irradiance),. (4) ..... TM digital values were converted to calibrated radi-. TM REFLECTANCE ...
An Investigation of Terrain Effects on the Inversion of a Forest Reflectance Model Fraser Gemmell
The effects of terrain on conifer stand reflectance were
estimated using sensitivity analysis of the Li and Strahler bidirectional reflectance (BRDF) model, and model inversions with both simulated and real Landsat Thematic Mapper (TM) reflectance data. Emphasis was placed on surface characteristics, and atmospheric correction was assumed. The results of sensitivity analysis indicated that strong interactive effects between nadir coverage of crowns, stand structure, and the slope and aspect of the stand occur in the reflectance data. This was supported by the results of model inversions using simulated reflectance data of sloping stands. It was found that, by neglecting slope in the inversion process, significant errors occurred in the retrieved values of forest coverage. Finally, inversion was tested using real TM reflectance data from a mountainous site in British Columbia, with a digital terrain model (DTM), forest attribute data, and the 6S atmospheric code. The results indicate that the effects of sloping terrain would preclude the retrieval of forest coverage unless terrain effects were specifically included in the inversion process. Elsevier Science Inc., 1998
INTRODUCTION Accurate information on the distribution and rates of change of forest characteristics are required for a number of ecosystem, environmental, and climate applications. These range from local applications, where very detailed information is required on a per-stand basis in forest management, to global applications, where quantitative information on vegetation structure and amount are critical inputs to models that describe the interaction between land surface and climate. Remote sensing has
Address correspondence to F. Gemmell, P.O. Box 5193, Leicester, LE2 2YW, UK. E-mail: fg3@ le.ac.uk Received 10 October 1997; revised 18 February 1998. REMOTE SENS. ENVIRON. 65:155–169 (1998) Elsevier Science Inc., 1998 655 Avenue of the Americas, New York, NY 10010
the potential to offer a timely and cost effective method for deriving information on forest characteristics. Often, researchers have used empirical methods to relate remote sensing data to forest characteristics. However, there are difficulties associated with empirical relationships. First, empirical relationships are site- and scene-dependent, which may limit their general applicability. Second, there can be hidden variables in empirical relationships since forest reflectance is complex. A more general problem is that the relative importance of slopeaspect effects in forest reflectance are not well understood. Further, there are incompatibilities between forest attribute labels and the biophysical characteristics of the forest that determine stand reflectance. It is not generally possible, therefore, to relate remote sensing data directly to forest attribute data. Physically based algorithms have not been widely used to estimate forest biophysical parameters from satellite multispectral data, although there are exceptions (Strahler et al., 1988; Franklin et al., 1991; Rosema et al., 1992; Woodcock et al., 1994; Wu and Strahler, 1994; Hall et al., 1995a; Jasinski, 1996; Ruiter et al., 1997). More work need to be done in this area, including testing using actual satellite data, where atmospheric effects are important, and with heterogeneous canopies, where structural parameters are important (Hall et al., 1995b). The inversion of reflectance models provides an objective method for estimating biophysical characteristics from remotely sensed data. Inversion involves adjusting model parameters until the model reflectance best matches the measured reflectance (Goel, 1988). Inversion techniques are applicable to all sites and sampling conditions, and do not rely on empirical calibration of reflectances against measured biophysical properties, although some knowledge of ecosystem characteristics can be used to constrain the solution domain (Privette et al., 1996). Goel (1988) distinguished four types of canopy reflectance model: (i) geometric-optical; (ii) turbid medium; (iii) hybrids of (i) and (ii); (iv) computer simulations. The 0034-4257/98/$19.00 PII S0034-4257(98)00022-4
156
Gemmell
choice of canopy reflectance model depends on the nature of the surface under investigation and how the model is to be used. Most canopy reflectance models are not formulated to be invertible or are either not invertible or difficult to invert (Woodcock et al., 1997). To derive forest characteristics from remotely-sensed data, geometric-optical models are recommended (Gauthier et al., 1991). In geometric-optical models, the calculation of reflectance is simplified thus facilitating the inversion process. In addition, studies suggest that, in practice, geometric-optical forest models are able to retrieve useful biophysical information (Hall et al., 1995a; Woodcock et al., 1997). In this investigation, the Li and Strahler (1992a,b) geometricoptical model was used. Validation of the Li and Strahler (1992a,b) model has shown reasonable agreement with measured reflectances (Abuelgasim and Strahler, 1993; Schaaf and Strahler, 1994). One aspect of model inversion that does not appear to have been investigated in detail are the effects of terrain. Teillet (1986) notes that not enough work has been done in this area to establish guidelines on the relative importance of slope–aspect effects in remotely-sensed imagery; this situation has not improved appreciably in recent years. If inversion is to become a generally applicable method for estimating forest characteristics, it is essential that the effects of terrain are understood and can be accounted for in the inversion process. However, quantitative analysis of topographic effects in remotely sensed data present a number of difficulties including limited slope and aspect ranges, a lack of appropriate forest cover information, and dependencies of forest attributes on terrain in mountainous areas. Previous investigations suggest that terrain effects in remotely sensed data have been investigated at two levels. The first is the macroscale level (e.g., Holben and Justice, 1981; Conese et al., 1993; Sandmeier and Itten, 1997), where the emphasis has been on radiometric correction of image data without taking into account the specific reflectance characteristics of the surface. Although a review of this extensive area of investigation is beyond the scope of this article, consideration of macroscale effects are included in the simulation model. The second level is at the scale of a homogeneous forest stand where the effects of terrain on forest reflectance have been investigated (Cavayas and Teillet, 1985; Strahler et al., 1988; Schaaf et al., 1994; Gemmell, 1995; Woodcock et al., 1997). Attempts to incorporate terrain into models of stand reflectance have followed a geometric–optical approach. Cavayas and Teillet (1985) simulated the effects of terrain on stand reflectance by use of a geometric–optical model and found, that for certain cases of population density and solar zenith angle, the simulation results showed very significant changes in pixel reflectance as a function of slope and aspect. Schaaf et al. (1994) found that, for gentle to moderate slopes, hemispherical reflectances calculated using the Li and Strahler (1992a,b) bidirectional reflectance
(BRDF) model remained quite similar, although the shapes of the BRDFs changed with slope and aspect effects. For steeper slopes (.308), the shape of the BRDF became quite distorted and there was distinct variation in the albedo values. Woodcock et al. (1997) found improved results, between measured coverage parameters and those estimated by inversion of the Li and Strahler (1985) model, when terrain effects were included in the analysis. Although these investigations have had different emphases, all investigations indicated that the effects of terrain should be taken into account. As yet, there does not appear to be a specific report which quantifies the effects of terrain on the inversion of a forest reflectance model. The central aims of this investigation were to carry out a sensitivity analysis of stand reflectance to slope and aspect, and to provide a quantified estimate of the errors that would potentially occur if the effects of slope were neglected in the inversion process. This article is structured as follows: Initially, the Li–Strahler BRDF model is summarized along with the adaptations made to account for terrain; second, the interaction of coverage, stand structure, and slope in determining stand reflectance is examined for slopes in the solar principal plane; third, sensitivity analysis of the model is presented; fourth, inversion of the model is tested using simulated reflectance data; and finally, inversion is tested using real TM reflectance data from a mountainous site in British Columbia. FOREST REFLECTANCE MODEL The model used here is the geometric-optical BRDF model of Li and Strahler (1992a,b). The calculation of pixel reflectance is simplified and computed as a sum of the bulk component signatures (sunlit and shadowed crown and background components) weighted by their relative proportions as viewed by the sensor. The Li– Strahler model calculates stand reflectance R in a given spectral band as follows: R5Rg·g1Rd·d1Rv·v1Rs·s,
(1)
where Rg is the signature of sunlit ground; Rd the signature of shadowed ground; Rv the signature of sunlit crown; Rs the signature of shadowed crown; g the proportion of pixel that is background that is both sunlit and viewed; d the proportion of pixel that is background that is both shadowed and viewed; v the proportion of pixel that is crown surface that is both sunlit and viewed, as projected onto the background; and s the proportion of the pixel that is crown surface that is both shadowed and viewed, as projected onto the background. The component signatures (which are estimated empirically) represent a combined signature including the effects of direct and diffuse radiance and include all orders of scattering (Woodcock et al., 1997). The fractions in Eq. (1) are calculated from geometrical considerations
Terrain Effects on Forest Reflectance
and take into account the correlation between illumination and viewing shadows. Calculation of the fraction v5f·(12g) includes the probabilities of mutual shadowing between tree crowns as follows (Schaaf et al., 1994): (12Cv·Pv·Mv/Cc) f5b·F· 1(12b)·F, (12M)
(2)
where Cc is the area of sunlit crown projected in the view direction; Cv is the area of view shadow of a single ellipsoid on the background; F5Cc/C, where C is the area of background shaded in either view or illumination directions by a single ellipsoid; Pv is the conditional probability that a crown surface element will face the sun given that it is shaded from view; Mv is the mutual shadow proportion in the view direction; and M is the mutual shadow proportion. Equation (2) holds while the view zenith angle hv is greater than the illumination zenith angle hi. Otherwise, the Pv·Mv is replaced by Pi·Mi if it is a larger value; Pi is the conditional probability that a crown surface element will face the viewer given that it is shaded from view; Mi is the mutual shadow proportion in the illumination direction. The quantity b is a weighting factor varying between 0 and 1 that determines whether the stand is composed primarily of trees of random heights (low mutual shadowing) or trees of a uniform height (and, therefore, a great amount of mutual shadowing exists between tree crowns). Li and Strahler (1992a) gave a simple equation for determining b based on the upper and lower bounds of the height distribution of crown centers: b5(12(h22h1)/4·b)2.
(3)
A more rigorous estimate of b was presented in Li and Strahler (1992b), but it was also stated that the more complex estimate gave results that were not significantly different to those obtained using the simpler estimate of b. Thus Eq. (3) is used to estimate b here. For further details, refer to Li and Strahler (1992a,b) and Schaaf et al. (1994). Because reflectance is represented as a linear process, the component signatures are assumed constant and thus are assumed to be independent of their relative proportions in the pixel. Interactions between component proportions and their signatures are not included, for example, multiple scattering between tree crowns and between crowns and the background can affect shadow signatures and thus signatures are not constant in reality. However, in real vegetation, especially those of low to medium densities, the variation between signatures of sunlit and shadowed, crown and background components is usually much greater than the variation within signatures of these components (Li and Strahler, 1992a). Thus a geometric model should be a reasonable first order approximation of stand reflectance.
157
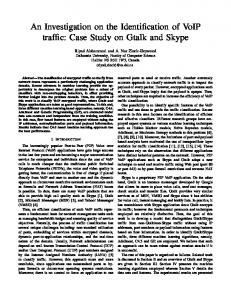
Terrain alters stand reflectance in three ways. First, sloping terrain changes the areas of the shadows cast on the background. Second, mutual shadowing relations between tree crowns are altered. The net result is to alter the relative proportions of the illuminated and shadowed components observed by the sensor (see Fig. 1). These effects were taken into account by transforming the geometric relationships among the sun–sensor geometry and the crown shape into the coordinate system of the slope, so that the problem reduces to that of a flat surface (Schaaf et al., 1994). Third, the component signatures are modulated relative to flat terrain. These latter effects may be examined by inspecting the three different components of the total irradiance E(k,z) impinging on a Lambertian sloping surface at elevation z (Sandmeier and Itten, 1997): E(k,z)5H·Ehd(k,z)·cos hi/cos hs (direct irradiance) 1Ehf(k,z)·[k(k,z)·cos hi/cos hs1(12k(k,z))·Vd] (diffuse irradiance) 1Eh(k,z)·Vt·qadj(k) (terrain irradiance), (4) where Ehd(k,z) is the direct component of irradiance in wavelength on horizontal sunlit ground; Ehf(k,z) is the diffuse component of irradiance on horizontal ground; Figure 1. Schematic showing the effects of terrain on the shadowing effects within a forest stand. Spheres are used for simplicity. a) and b) show the effect of slope and aspect on the area of shadow cast from a single crown onto the sloping background. c) and d) show the effect of slope and aspect on the mutual shadowing relations between tree crowns.
158
Gemmell
Eh(k,z) is the total irradiance on horizontal sunlit ground; k(k,z) the anisotropy index; Vd the sky view factor; Vt the terrain view factor; qadj(k) the average reflectance of adjacent terrain; H the binary coefficient to control cast shadow; hi the angle between solar rays and the normal to surface; and hs the solar zenith angle. For simplicity, the receipt of scattered irradiance from adjacent terrain was left aside (Vt50), and only a constant elevation was considered. The signatures of the sloping background Rg and Rd were considered first. For given atmospheric conditions and hs, it can be seen that the magnitude of Rg will depend on the cosine of hi and on the sky view factor Vd. When crown transparency is small, Rd should not be significantly affected by either direct irradiance, or by the circumsolar part of the diffuse irradiance component, since Rd lies in shadow cast by tree crowns. For a point on the ground within a stand, the sky view factor Vd will be dominated by the coverage of the stand itself, rather than surrounding terrain, except perhaps at very low tree densities. The possibility of correcting the background signatures according to Vd was considered; for example, Vd could be modeled as Vd5exp(2N·p·r 2), where N is the density of the stand and r is the average tree crown radius in the stand. However, in Eq. (4) such a correction will only have a small effect on Rg when the direct irradiance term dominates E(k,z) and, in addition, may simply be outweighed by the effects of the approximation in Eq. (1) that Rg and Rd are independent of coverage. Rd was assumed independent of terrain. Following Woodcock et al. (1997) the magnitude of Rg was corrected by cos(hi). The signatures of the crown surfaces Rv and Rs were not corrected for terrain since trees are always vertically oriented. In reality, however, there will be some terrain effect due to differential receipt of sky irradiance as different portions of the sky are obscured at different slopes and aspects. Again, it was felt that any attempt at correcting Rv and Rs for terrain would be outweighed by the approximations inherent in Eq. (1). In this work, nadir viewing was assumed and the model simulations were confined to slopes with normals lying in the principal plane of the sun (defined relative to flat terrain) since this will be the plane of maximum anisotropy of the stand BRDF. Slopes that are completely covered by shadow cast from adjacent terrain features were not included. The receipt of irradiance from adjacent terrain is not included, and thus the results will be less applicable to forested slopes lying in areas of faint illumination such as deep valleys. It was further assumed that the length scales of terrain slope and aspect are typically greater than those of a forest stand and thus slope and aspect are homogeneous over the whole stand. This seems a reasonable assumption for a TM 30 m pixel and for most terrain.
Table 1. Inputs Used in Simulationsa Component Reflectances b
Rg Rv Rd Rs
Red
Near-IR
0.05 0.03 0.01 0.01
0.2 0.4 0.1 0.1
a Geometric: solar zenith5308; observation zenith508. Forest: crown shape 5 spheroid; crown radius r52.5 m; crown vertical half-axis b57.5 m; mean height of crown center above ground, h515 m. b Value for flat terrain.
SLOPES IN THE SOLAR PRINCIPAL PLANE: INTERACTION OF SLOPE, COVERAGE, AND STAND STRUCTURE Initially, the Li and Strahler BRDF model was used to examine how the interaction of slope, coverage, and stand structure influenced reflectance in the principal plane. Coverage is the proportion of the stand covered by tree crowns when viewed at nadir: coverage512exp(2N·p·r 2). The crown shape used was a spheroid, taken to represent a conifer (Table 1). Sun–sensor geometry was set at values typical of a Landsat TM scene: a nadir view and a 308 solar zenith angle. Crown component reflectances for the TM bandpasses were taken from the results of field measurements of conifer reflectances by Cavayas and Teillet (1985). Values for sunlit ground reflectance were based on data from Rosema et al. (1992). For simplicity, the signature of shadowed background Rd was assumed to be equal to the signature of shadowed crown Rs. This assumption, used by other investigators (Li and Strahler, 1992a; Hall et al., 1995a), is reasonable since in a given spectral band both Rd and Rs may be similar in magnitude and also small relative to both Rg and Rv. Figure 2 shows the variation of reflectance with slope for the red band in the principal plane at three coverages. Here, a very irregular stand structure was assumed in all cases, that is illumination and viewing shadows were independently scattered on other crowns (the mutual shadowing parameter b was set to zero). For all three coverages, reflectance can be observed to be higher at slopes facing toward the sun (negative slope values in Figs. 2–5) and lower for slopes facing away from the sun. The underlying reason for this difference was that the shadows cast from the crowns (as projected onto the background) and hence the overall shadow coverage of both crowns and background were greater on slopes facing away from the sun (see Fig. 1). In the case of the low coverage (0.2) stand, the effect of illuminated background was dominant; for slopes facing the sun, shadows cast from crowns as projected onto the background were shortened by the slope relative to flat terrain. Thus a greater fraction of the pixel consists of brighter, illuminated ground. In addition, the signature of the illuminated background, Rg varied with the cosine of the solar incidence angle and thus is brighter for
Terrain Effects on Forest Reflectance
159
Figure 2. Variation of red reflectance with slope for slopes in the principal plane of the sun for three coverages. Negative slope values indicate slopes facing toward the sun while positive values indicate slopes facing away from the Sun. In this case, low mutual shadowing has been assumed (b50).
Figure 4. Variation of near-infrared reflectance with slope for slopes in the principal plane of the sun for three coverages. Negative slope values indicate slopes facing toward the sun while positive values indicate slopes facing away from the sun. In this case, low mutual shadowing has been assumed (b50).
slopes facing the sun. At intermediate coverage (0.5) the variation of reflectance with slope was damped relative to the low coverage stand. In this case, the fraction of illuminated background in the stand was much smaller and shadows are cast onto other crowns as well as background. At the higher coverage (0.8) virtually no illuminated background was visible and reflectance depends
primarily on the relative amounts of illuminated and shadowed crown viewed. Figure 3 shows the same coverages as Figure 2, but in this case a high degree of mutual shadowing was assumed (b50.8). This corresponds to a stand in which tree crowns are of quite a uniform height. For the low coverage stand there is no difference between the high and the zero mutual shadowing case
Figure 3. Variation of red reflectance with slope for slopes in the principal plane of the sun for three coverages. Negative slope values indicate slopes facing toward the sun while positive values indicate slopes facing away from the sun. In this case, a large amount of mutual shadowing has been assumed (b50.8).
Figure 5. Variation of near-infrared reflectance with slope for slopes in the principal plane of the sun for three coverages. Negative slope values indicate slopes facing toward the sun while positive values indicate slopes facing away from the sun. In this case, a large amount of mutual shadowing has beeen assumed (b50.8).
160
Gemmell
background in the near-infrared, the reflectance curves for both intermediate and high coverages were shifted to greater values relative to the low mutual shadowing case, with the high coverage stand now brightest at all slopes. Overall, in examining the response of conifer stand reflectance to slopes in the solar principal plane, stands with slopes facing toward the sun were brighter than stands on slopes facing away from the sun for both red and near-infrared bands. Shadowing was the primary cause of this effect. However, the situation is not straightforward since coverage, stand structure, and slope and aspect of the stand interact with the spectral characteristics of the components to determine stand reflectance for a given sun–sensor geometry.
Figure 6. Coverage trajectories for a low (b50, lower curve) and a high mutual shadowing case (b50.8, upper curve). The values plotted on the figure are coverages.
(shown in Fig. 2). This was expected since trees were at a very low density here and mutual shadowing was not important. For the intermediate and high coverage stands, the effect of mutual shadowing was to raise the absolute reflectance of the stand at all slopes and also to bring the curves for both the intermediate and high coverages very close together. In both these cases mutual shadowing has the effect of increasing the proportion of viewed, sunlit crown v, relative to the corresponding zero mutual shadowing case. The mutual shadowing effect is greater at higher coverage, and this has the effect of giving the higher coverage stand a reflectance that was similar to that of the intermediate coverage stand (in which the fraction of viewed illuminated background was greater than in the high coverage stand). Figures 4 and 5 show the variation of reflectance with slope for the near-infrared band. For the low mutual shadowing case (Fig. 4), the curves for the three coverages are close to one another. As with the red band, shadowing was still the dominant factor controlling the response of reflectance to slope, but, as cover increases, the increase in the shadow fractions (which reduces the fraction of viewed, illuminated background) was “counteracted” by the increase in brighter illuminated crown. This effect is shown in Figure 6 where the coverage trajectory of the low mutual shadowing case is almost flat. Figure 6 also shows that the two mutual shadowing cases were quite distinct above low coverages. For the high mutual shadowing case (Fig. 5), the response of the low coverage stand remains unchanged. For both the intermediate and high coverage stands, the proportion of viewed, sunlit crown v was increased relative to the zero mutual shadowing case. Since the component signature of illuminated crown was brighter than that of illuminated
SENSITIVITY ANALYSIS OF THE FOREST REFLECTANCE MODEL The aim of sensitivity analysis was to determine the sensitivity of stand reflectance to slope relative to the following parameters: coverage, stand structure (b), and the signatures of the illuminated crown and background (Rv and Rg). These five parameters can be varied independently of one another in the Li and Strahler model. Knowledge of the coverage of a stand provides useful information in some sites as coverage may be correlated with other forest attributes such as timber volume. Coverage and leaf area index are the variables estimated by the FLIM inverse algorithm (Rosema et al., 1992). The inversion process is best able to retrieve those parameters to which the model is sensitive (Goel, 1988). The method employed to analyze model sensitivity was as follows (Privette et al., 1994). Five hundred synthetic stands were simulated by use of a random number generator to produce parameter values within reasonable and physically plausible limits (Table 2). For a given synthetic stand, each parameter was in turn perturbed by 10% of its theoretical range (Table 2), and a new stand reflectance was computed. The absolute difference in reflectance between the original stand and the reflectance produced by a parameter’s perturbation was recorded. There were two possibilities of handling the data generated in this way. One method was to perform principal Table 2. Parameter Ranges Used in Sensitivity Analysisa
Cover Slope (deg) Beta Rg (red)b Rv (red) Rg (IR)b Rv (IR) a b
Lower
Upper
Increment
0 0 0 0.05 0.02 0.10 0.25
1 60 1 0.12 0.04 0.30 0.40
0.1 9 0.1 0.1 0.1 0.1 0.1
Increment510% of theoretical range. Value for flat terrain.
Terrain Effects on Forest Reflectance
Figure 7a. Results of sensitivity analysis of the model for the red band and slopes facing away from the sun.
component analysis on the data. Since the first principal component was in the direction of maximum variance, the contribution of a given parameter to this axis could be taken as a measure of the models sensitivity to that parameter (Privette et al., 1994). An alternative method, used here, was to group the data according to the coverage of the synthetic stand and interpret the mean differences produced for each parameter. Below, the results are presented as mean values for each coverage bin. Sensitivity analysis was applied using the conifer crown geometry of Table 1 and constant shadow signatures. Figures 7 and 8 show the results for slopes facing away from the sun. For the red band (Fig. 7a) reflectance can be seen to be most sensitive to the component signatures. At low coverage, the influence of Rg was great as would be expected. At high coverage, the influence of Rv was greatest as the background was increasingly obscured from view. Figure 7a indicates that the success of model inversion may be highly dependent on the nature of the spatial variability of Rg in a given site. This hypothesis is supported by the results of Ruiter et al. (1997), who found that, because of large variations in the spectral characteristics of the background cover in their study area, large errors in the results of model inversion occurred in areas of open forest. On the other hand, Ruiter et al. (1997) note that the assumption of a unique reflectance characteristic for tree crowns may be less complicated and that the reflectance characteristics of spruce and pine do not differ very much. For clarity, Figure 7b shows the same result as Figure 7a but at a different scale and only the sensitivity of the red reflectance to coverage, slope, and b is shown. It can be seen that sensitivity to b was small while sensitivity to both coverage and slope was greater at low coverages. Significantly, red reflectance was almost equally sensitive to both coverage and slope at all coverages.
161
Figure 7b. Results of sensitivity analysis of the model for the red band and slopes facing away from the sun.
For the near-infrared band (Fig. 8) reflectance was much more sensitive to the three parameters slope, coverage, and b, relative to the component signatures, than in the red band. This can be explained as follows. A given perturbation in slope, cover, or b resulted in a change in the relative proportions of the illuminated and shadowed components; however, for the near-infrared band, a greater sensitivity resulted because the absolute values of the differences between the component signatures in the near-infrared band were greater than those in the red band. On the other hand, a constant perturbation in the signature of a single component resulted in the same change in stand reflectance at both red and near-infrared bands. Figure 8 shows that, relative to the sensitivity to coverage, reflectance was more sensitive to slope at low coverages, while at greater coverage, coverFigure 8. Results of sensitivity analysis of the model for the near-infrared band and slopes facing away from the sun.
162
Gemmell
Figure 10. Results of sensitivity analysis of the model for the near-infrared band and slopes facing toward the sun.
Figure 9. Results of sensitivity analysis of the model for the red band and slopes facing toward the sun.
age became the dominant variable; sensitivity to b increased with coverage and was greatest at higher coverages where mutual shadowing had a significant influence. Figures 9 and 10 show the results for slopes facing towards the sun. For the red band (Fig. 9) the component signatures dominated the model sensitivity again and are not shown; reflectance was quite insensitive to slope relative to coverage below a coverage of 0.5 but, at higher coverages, slope, coverage, and b are about equally important. In the near-infrared band (Fig. 10) reflectance was most sensitive to coverage at all coverages, although it can be seen that slope was still significant; b was quite significant also at greater coverages. In summary, the results of sensitivity analysis indicated that strong interactive effects between forest coverage, stand structure, slope, and aspect will occur in the reflectance data. The effects of terrain should, therefore, be taken into account in model inversion. MODEL INVERSIONS WITH SIMULATED REFLECTANCE DATA The general inversion problem may be defined as follows (Privette et al., 1994). Given a set of empirical reflectance measurements, determine the set of independent model parameters such that the computed reflectances best fit the measured reflectances. The fit of the empirical data is determined by the merit function e 2 defined as n
e 25 o [Rj2Rjm]2, j51
(5)
where Rj is the reflectance for a given spectral band and sun–sensor–slope geometry, Rjm is the analogous model estimate, and n is the number of reflectance samples. In this case n52; nadir (TM) viewing was assumed, and both red and near-infrared bands were included since it
is not possible to retrieve a unique forest coverage on the basis of only one band. Only one independent parameter was adjusted in this case in order to minimize e 2: coverage. b was set at an intermediate value of 0.5. All other parameters were set as constant as in Table 1. A penalty function was used in order to limit the coverages to physically plausible values; coverage was thus constrained between 0 and 1. Once the best fit was achieved (e 2 was minimized), the coverage value producing that fit was considered the retrieved parameter and the best estimates of the true surface value. Minimization was carried out using a conjugate direction set method [subroutine POWELL (Press et al., 1992)]. Initially, Eq. (1) was used to simulate reflectance data for a number of cases of varying forest structure and sun– sensor–slope geometry. The model was then inverted with these reflectance data, and the retrieved values of coverage were compared to their original values. In all cases, inversion retrieved the original values. Inversions were then repeated with various levels of error of up to 10% of the reflectance values added to the reflectance data. In reflectance data obtained from a satellite, error may arise from quantization effects, for example. Errors were added to the red and near-infrared bands separately and in combination. Errors in the values of retrieved coverage were proportional to the level of error added to the reflectance data and were generally less than 20% with the addition of a 5% error. In an attempt to quantify the errors that would occur by neglecting slope in model inversion at sloping sites, inversions were carried out using simulated reflectance data. Reflectance data were assumed to be free of errors so as to allow the effects of terrain to be isolated. The method was as follows. First, a synthetic stand was generated with a given slope. Second, stand reflectance was calculated for that slope. Finally, these reflectance
Terrain Effects on Forest Reflectance
163
Table 3. Results of Model Inversion with Simulated TM Dataa Slopes away from Sun Case 1 error Case 2 error Case 3 error a
Slopes toward Sun
408
308
208
108
108
208
308
408
234 246 237
232 234 222
227 223 212
218 211 24
133 110 14
175 120 18
1101 128 113
1107 136 116
Values are the percent error in model inversion; 15overestimation; 25underestimation.
data were used to invert the model, but with slope assumed to be zero, that is, the effects of terrain were neglected in the inversion process. Results of inversion of the Li and Strahler model are given in Table 3 for three coverages (0.2, 0.5, and 0.8). It can be seen that, overall, errors were quite large. Coverage was overestimated for slopes facing towards the sun while coverage was underestimated for slopes facing away from the sun. Errors were greatest for slopes facing the sun at a coverage of 0.2, and least for slopes facing the sun at a coverage of 0.8. Thus it appears that the effects of sloping terrain would preclude the successful retrieval of forest coverage unless the effects of terrain were specifically included in the inversion. MODEL INVERSIONS WITH REAL LANDSAT TM REFLECTANCE DATA In order to test the effects of terrain on model inversion with real TM data, inversion was applied to a dataset from a mountainous site in British Columbia. This section first summarizes details of the site and the dataset, and the geometric and radiometric preprocessing of the dataset. Signature estimation was carried out using inverse modeling with the TM data and stands of known structural characteristics. Inversion was tested with and without the effects of terrain included. Site Characteristics The Canal Flats test site, located in southeast British Columbia, is 30 km310 km (300 km2) with an elevation range of 1700 m. The site has very mountainous terrain and some flat valley areas. The area is mainly forested with Douglas-fir, larch, spruce, balsam, and lodgepole pine as the dominant tree species. The site is dominated by low to medium crown closures and poor to medium site quality. Stand timber volumes were generally less than 300 m3 ha21, although the volumes of some stands could reach 500 m3 ha21. Age varied between 100 years and 250 years, excluding regenerating areas. The site is moisture-limited with steeper west-facing slopes containing the forest stands with the greatest volumes. Geometric and Radiometric Preprocessing The dataset consisted of TM imagery, a digital terrain model (DTM, absolute positional accuracy 12 m), and forest attribute data obtained by field work on the
ground. The subsequent analysis of the dataset was dependent on accurate spatial integration of these data, and considerable work was done in order to ensure accurate spatial integration. Geocoded TM imagery from August 1990 was acquired from the Canada Centre for Remote Sensing (CCRS) production facilities and then geometrically corrected for terrain effects using data from the DTM. Forest cover data were precisely located and digitized in a geographic information system (GIS), and converted to raster format to be used in the image processing routines. Further details on data acquisition, geometric correction, and spatial integration of the dataset can be found in Gemmell (1995). In terms of spatial accuracy, the complete dataset was geometrically registered to an rmse of 25 m, or less than 1 TM pixel (30 m). TM digital values were converted to calibrated radiances and then to top-of-the-atmosphere (TOA) Lambertian reflectances using calibration data and equations contained in Markham and Barker (1986). Atmosphericelevation correction was then applied to the spectral data using the 6S radiative transfer code (Vermote et al., 1997) and the elevation data sampled from the DTM. A “dark target” approach (Teillet and Fedosejevs, 1995) was used in which the 6S code was used to determine the aerosol optical depth input that gave the observed (image-based) dark target reflectance at the output. A “continental” aerosol model was assumed for the site, and the appropriate standard model atmosphere for the latitude and time of year was used. Teillet and Fedosejevs (1995) estimated the uncertainty (which results primarily from the assumed value of the dark target reflectance) in surface reflectance retrieval with the dark target method to be 0.01 absolute reflectance units in TM Band 3 for typical conditions. This uncertainty is of a similar magnitude to the actual reflectance values in TM Band 3 for dark stands of coniferous forest where a significant fraction of the stand consists of shadow. However, errors in the absolute reflectance values arising from atmospheric correction should not affect the variance in the reflectance data since atmospheric correction is applied to the whole scene and thus results in a more-or-less uniform shift of the data points in spectral space. In this investigation, where component signatures were estimated from the imagery, atmospheric correction does help in signature estimation since it aids in the assessment of the realism of the component signatures retrieved from the imagery.
164
Gemmell
Table 4. Details of the Scene and the Test Stands Geometric Solar zenith 378 Observation zenith 08 Slopes 2–278, mean 148 Sun–slope azimuth difference range 4–1738, mean 788 Elevation range 1040 m to 1480 m, mean elevation 1330 m Forest Species Douglas-fir Stand age 100–250 years Coverages 0.02–0.65 Mean tree height h 20 m Crown vertical half-axis b50.2 h Crown radius r50.1 h Mean height of crown center above ground50.8 h Mutual shadowing parameter50.25
Atmospheric correction assumed a Lambertian surface and a constant solar zenith angle (that of a flat surface). Thus the spectral data were corrected for atmosphericelevation effects but relative to a flat surface. The spectral data were uncorrected for slope–aspect effects which were subsequently taken into account in the reflectance model inversion process. Forest Data The forest attribute data consisted of 220 ground cells (or stands). Each of the 220 cells was assumed to represent at least a 50 m*50 m area of forest and the TM image was sampled within a pixel window located over each coregistered ground cell. Overall, the dataset was complex with a number of different sources of variance contained within the reflectance data. These sources included coverage, stand age, height and structure, species composition, background characteristics, and terrain slope and aspect. It was, therefore, necessary to simplify the dataset in order to examine the effects of terrain effectively. In one area of the site, old-growth Douglas-fir comprised over 80% of the species composition of the forest and the data from the 44 ground cells for this area were selected to examine terrain effects in model inversion. Table 4 summarizes details of these stands. Coverages ranged from as little as 0.02 up to a maximum of 0.65 while the mean slope angle was 148 and the stands occupied the full range of aspects. Stand background characteristics were quite variable, particularly in the very low density stands of poor site quality where ground vegetation and rocks existed. For model inversion, it was necessary to estimate constant values for both the tree crown geometry and the stand structure. In addition, the mutual shadowing calculation (Li and Strahler, 1992a) required knowledge of the density of the stand. Density would be unknown for all practical inversion purposes. Since coverage was the variable to be retrieved by inversion, and thus was the variable to be adjusted in order to minimize the
merit function, an estimate of density N was made from coverage512exp(2N·p·r 2). This was done by assuming a constant crown radius r for all stands, estimated as 0.1 h, where h was an estimate of mean tree height. The effects of these simplifying assumptions on the results of inversion were tested by using the actual (measured) tree heights (from which crown radius could be estimated) in the inversion process. It was found that the errors in the retrieved values of coverage, introduced by these simplifying assumptions, were small for the test stands. This was because mutual shadowing was small in the test stands, for two reasons: First, coverages (densities) were fairly low, and thus mutual shadowing was also relatively small; and, second, stand structure (discussed next) was complex, and this also contributed to low mutual shadowing in the test stands. Mean values for tree crown geometry were estimated using data collected by the local forestry office. For Douglas-fir aged greater than 100 years (all 44 stands), the ratio of the crown vertical half-axis b to crown radius r was estimated as 2 and mean crown height h was estimated at 20 m. A spheroidal crown shape was assumed in accordance with the reflectance model. Stand structure (variation in tree heights) was generally complex in these old-growth stands and, in the field, it was apparent that stands had uneven tree heights. It is well known that older Douglas-fir stands may have multiple canopy layers with numerous gaps (Cohen and Spies, 1992). Gaps resulted from natural causes, and it was also known that selective logging of trees had occurred in the site. Stand structure was therefore observed to be closer to the random case of Li and Strahler (1992a), that is, illumination and viewing shadows were nearly independently scattered on other crowns. A range of heights of twice the vertical half-axis of the crown was estimated for the fir stands, and b was calculated as 0.25. Further evidence of stand structure can be found by inspecting the coverage trajectories of the stands in rednear-infrared plots of the stands. Figure 11 shows coverage trajectories as simulated by the Li and Strahler model for the stands using the geometrical data in Table 4 and the component signatures, estimated below, and assuming flat terrain. The upper trajectory corresponds to trees of quite a uniform height (a high degree of mutual shadowing among tree crowns, b50.8) while the lower trajectory corresponds to trees of a very variable height, the random case, b50). In Figure 12 the TM data in Bands 3 and 4 are plotted for the 44 Douglas-fir stands. With some scatter, coverage increased from the top-right of Figure 12 (coverage less than 0.05) towards the bottom-left, where the maximum nadir coverage was 0.65. Comparison of Figures 11 and 12 suggests that the forest structure was close to the random shadowing case, since the “coverage trajectory” of the fir stands appears to follow a more-or-less linear path similar to that of the
Terrain Effects on Forest Reflectance
Figure 11. Coverage trajectories for a low (b50, lower curve) and a high mutual shadowing case (b50.8, upper curve) for the test site. The values plotted on the figure are coverages.
random case in Figure 11. In Figure 12, however, it must be kept in mind that the effects of both variable background signatures and terrain also affect the distribution of the points. Since all 44 stands consisted of oldgrowth forest with species composition greater than 80% fir, the effects of age and species on the variance in the data may have been relatively less than the effects of background variability and terrain. Signature Estimation Direct measurements of the component signatures were not available for the stands. It was, however, possible to estimate mean values for the component signatures using inverse modeling with the TM data and the known stand
Figure 12. Red (TM3) and near-infrared relectances (TM4) for the test stands. The test stands appear to follow a trajectory closer to that of the zero mutual shadowing case shown in Figure 11.
165
characteristics for a number of selected stands. The principle of the method was to retrieve the signatures of the crowns Rv and Rs using stands of high coverage, where the effects of the background on stand reflectance were small, and then to retrieve the background signatures Rg and Rd using stands of low coverage together with the estimated values of Rv and Rs. An attempt was made to estimate the crown signatures Rv and Rs. In this case it was necessary to eliminate or at least to minimize the influence of illuminated background Rg by using TM data for stands of high coverage. High coverage stands were not available, but two of the stands had a nadir coverage greater than 0.5 with slopes facing away from the sun. Shadow coverage for these stands was calculated as 0.9 and 0.8, respectively, and the probability of the sensor viewing illuminated background g was calculated to be less than 0.03 in the first case and less than 0.09 in the other. For each of the two stands, it was possible to write a linear equation using Eq. (1) giving a pair of simultaneous linear equations for each spectral band. For each stand, the component fractions g, d, v, and s were obtained from the model using the known structural information of the stand and the slope and aspect of the stand to transform viewing and illumination angles into slope coordinates as described above. The four component signatures were unknown and thus the pair of equations were underdetermined. However, the following simplifying assumptions were made. First, the probability of viewing illuminated background was less than 0.1 in both stands, and so it seemed possible that a rough estimate of Rg would be sufficient; Rg was estimated from Figure 12 by assuming that the TM reflectance values for stands with very low coverage (less than 0.1) were close to the background reflectance values. Second, the signature of shadowed background Rd was assumed to be equal to the signature of shadowed crown Rs. Thus the number of unknowns had been reduced to two, and it was possible to estimate Rv and Rs for a given band by minimizing the difference between modeled and observed reflectances for the two stands using the merit function [Eq. (5)]. Red (TM3), near-infrared (TM4), and short-wave infrared (TM5) bands were used since these three spectral bands contain the great majority of variance for coniferous forest (Horler and Ahern, 1986). A penalty function was used to limit the retrieved signatures to physically plausible values (between 0 and 1 for reflectance). For the near-infrared band, it subsequently proved necessary to further constrain the value of Rs to realistic values as the minimization produced physically impossible values of Rs (that is, Rs.Rv). This problem may have resulted from trapping of the merit function due to local minima, or from errors in either the forest data or TM spectral data. Thus, an estimate of Rs had to be made: the ratio of diffuse to direct solar irradiance at the surface for the TM scene, obtained from the 6S model, was used to constrain Rs in the inversion to the
166
Gemmell
Table 5. Component Signatures Estimated from the TM Image and Model Inversiona
TM3 TM4 TM5 a
Rv
Rs
Rg
Rs
0.019 0.302 0.136
0.004 0.030 0.000
0.029 0.213 0.110
0.004 0.030 0.000
Slope and aspect included.
corresponding fraction of Rv. Such an estimate may be justified since an error analysis for the near-infrared band using simulated stands (Rv50.30) revealed that if the estimate of Rs used here was in error by 0.01, the value of Rv obtained by inversion would be in error by less than 0.02. The values of Rv and Rs obtained for red, near-infrared, and short-wave infrared bands are given in Table 5. It should be kept in mind that there is also some uncertainty in the realism of these absolute values of the component signatures which arises from the dark target estimate of aerosol optical depth in the atmospheric correction. However, this uncertainty should be small for both near-infrared and short-wave infrared bands since atmospheric effects are relatively less at these wavelengths. The values of Rv and Rs in Table 5 appeared to be quite realistic when compared to other published data (Cavayas and Teillet, 1985; Rosema et al., 1992; Hall et al., 1995a). In the second stage of estimating the component signatures for the scene, 10 stands of low coverage (less than 0.2) were used to determine the background signature Rg. For each band, with the aid of the crown and shadow signatures obtained above, the best estimate of Rg was obtained by minimizing the differences between modeled and observed reflectances for the 10 stands. As many as 10 stands were used in this case since it was known that background signatures were variable in this site at low coverages. In testing inversion below, two experiments were carried out. In the first, inversion was tested with the effects of slope included, and in the second experiment, slope effects were neglected. For consistency, it was necessary to repeat the whole inversion process, including signature estimation, without slope effects included. Thus, signature estimation was carried out on the same stands but with a constant sun–sensor geometry (that of a flat stand in the site). The signatures obtained are given in Table 6. The crown component signatures were Table 6. Component Signatures Estimated from the TM Image and Model Inversiona
TM3 TM4 TM5 a
Rv
Rs
Rg
Rs
0.011 0.227 0.090
0.004 0.030 0.000
0.024 0.172 0.088
0.004 0.030 0.000
Slope and aspect not included.
lower than those obtained with terrain effects included. The reason for this was that the stands used for crown signature estimation were on slopes facing away from the sun, and thus it was not possible to realistically model the shadow coverage and hence the reflectance of these stands using the sun–sensor geometry of a flat stand. The illuminated background signatures were also lower; this was due to the lack of the cosine correction when slope– aspect effects were excluded in the model. Inversion of the Model To Retrieve Coverage The aim of inversion was to test whether or not the inclusion of the effects of terrain in model inversion improved the inversion results. The 10 lowest coverage stands used in determining the background signatures were not included so as not to bias the results. The two higher coverage stands used to determine the crown signatures were included since any bias introduced from them would have been small. First, inversion was tested with the effects of terrain included. The method was as follows. For each of the 34 test stands, model inversion was applied using all the peripheral information available for the stand (except for coverage) including sun–sensor– slope geometry (variable, obtained from the DTM), the geometrical crown constants, the mutual shadowing parameter b (constant), and the four component signatures for each band (constant) obtained by inverse modeling as described above. The coverage that minimized the differences between modeled and observed TM reflectances was taken to be the best estimate of coverage. The results of inversion using constant background signatures were very poor and are not presented. It was known, however, that background signatures were very variable for the stands, and, from sensitivity analysis above, it was found that reflectance was relatively most sensitive overall to the illuminated component signatures. Thus inversion was tested by allowing for a variable background signature. For each stand, four independent parameters were adjusted in order to minimize e 2: coverage, Rg (red), Rg (near-infrared), and Rg (short-wave infrared). Rg was constrained during the inversion to ranges estimated from the low-coverage stands. By allowing for a variable background signature, the results were considerably improved; the correlation (r50.76) between the measured coverages and the coverages retrieved by model inversion is shown in Figure 13. This improvement was, to some extent, expected for the test stands since it was known from inspection of high spatial resolution (3-m) spectral imagery that background signatures were variable in the site. The whole inversion process was then repeated without taking into account the effects of terrain and using the crown component signatures estimated above assuming flat stands (Table 6). Model inversion was then tested using these signatures and a flat stand assumed for all
Terrain Effects on Forest Reflectance
Figure 13. Coverages retrieved by inversion plotted against the measured coverages for the test stands. In this case, slope and aspect effects were included in the inversion process. The correlation coefficient was 0.76.
stands in the inversion process. In this case, the correlation was reduced (r50.57, Fig. 14) relative to the case where terrain effects were included. A further test of terrain effects was made by assuming that the crown signatures obtained by including the effects of terrain in signature estimation (Table 5) were more realistic than those obtained without terrain included. This may be a reasonable assumption since the stands used for crown signature estimation were on slopes facing away from the sun, and it was not possible to realistically model the shadow coverage, and hence the reflectance, of these stands using the sun–sensor geometry of a flat stand. Thus inversion for coverage was carried out using the Figure 14. Coverages retrieved by inversion plotted against the measured coverages for the test stands. In this case, slope and aspect effects were not included in the inversion process. The correlation coefficient was 0.57.
167
crown signatures in Table 5, but assuming a flat stand in the inversion for coverage. In this experiment the correlation was much lower (r50.1). Thus, the greatest correlation between measured and retrieved coverages was found when terrain effects were included in the inversion process—that is, both signature estimation, and inversion for coverage. The results using real TM data support the results of model inversion with simulated data where quite large errors in retrieved coverage were apparent when slopes of 10–208 were neglected in the inversion at low coverages (Table 3). This improved result supports the results of Woodcock et al. (1997), who also found an improved relationship with terrain included. Even with terrain included in the inversion, there was considerable scatter in the relationship between measured and retrieved coverages (Figure 13). This results from a number of factors including the assumption of constant stand structure and crown component signatures. However, the primary cause of this scatter was most likely due to the presence of gaps in the test stands. Gaps arose from both the natural complex structure of old-growth forest and from selective logging in the site. Where gaps occur, this represent a departure from the random spatial distribution of trees assumed in the model. It is also likely that if the background signatures had been available on a stand by stand basis, a greater accuracy would have been achieved; however, these difficulties highlight some of the problems encountered in attempting to invert a reflectance model over many stands, and by extension, over significant areas of forest. CONCLUSIONS This work has investigated the effects of terrain on the inversion of the Li and Strahler (1992a,b) geometric– optical BRDF model, which was adapted to include the effects of slope and aspect using the method of Schaaf et al. (1994). Emphasis was placed on surface characteristics and atmospheric correction was assumed. Inversions were tested with both simulated and real TM reflectance data. With simulated reflectance data, it was found that, by neglecting slope in the inversion process, significant errors occurred in the retrieved values of forest coverage. This result was supported by the results of inversions with real TM data, where improved correlation between retrieved and measured coverages was found when slope–aspect effects were included in the inversion process. Overall, the results indicate that the effects of sloping terrain would preclude the retrieval of forest coverage unless the effects of terrain were specifically included in the inversion process. Slope and aspect effects can be readily incorporated into the inversion, since no additional unknown variables are introduced when terrain data are obtained from a digital terrain model of appro-
168
Gemmell
priate resolution and accuracy. In addition, the Li and Strahler (1992a,b) geometric–optical model can be readily adapted to accommodate the changes in sun–sensor–stand geometry caused by sloping terrain. Further work is needed in two areas. First, inversions should be tested in sloping stands where signatures are known for each stand and where stands are younger or less subject to the presence of unpredictable gaps. This would allow these uncertainties to be reduced in the analysis of the results of inversion. Steeper slopes could also be used in future work. Second, simulations with more physically based forest reflectance models (Li et al., 1995) should also provide useful comparisons with the geometric–optical models. In addition, coupling a forest BRDF model to an atmospheric model and a DTM would enable macroscale effects, including the differential receipt of diffuse irradiance at different slopes and aspects, to be investigated. The use of improved datasets together with different BRDF models should enable the relative importance of slope–aspect effects in remotely sensed data to be better understood. The author is grateful to the Natural Science and Engineering Research Council (NSERC) Canada for funding in this work. The author would like to thank Dr. Jeff Privette and Dr. Stefan Sandmeier (both at the Biospheric Sciences Branch, NASA Goddard Space Flight Center) and the anonymous reviewers, for their helpful comments on the manuscript. The author is grateful to Miss Shao-Ying Chen for help in drawing the figures.
REFERENCES Abuelgasim, A., and Strahler, A. H. (1993), Modelling bi-directional radiance measurements collected by the Advanced Solid-State Array Spectroradiometer (ASAS) over Oregon transect conifer forest. Remote Sens. Environ. 47:261–275. Cavayas, F., and Teillet, P. M. (1985), Geometric model simulations of conifer canopy reflectance. In Proceedings of the Third International Colloquium on Spectral Signatures of Objects in Remote Sensing, Les Arcs, France, 16–20 December, pp. 183–189. Cohen, W. B., and Spies, T. A. (1992), Estimating structural attributes of Douglas-fir/western hemlock forest stands from Landsat TM and SPOT imagery. Remote Sens. Environ. 41:1–17. Conese, C., Gilabert, M. A., Maselli, F., and Bottai, L. (1993), Topographic normalization of TM scenes through the use of an atmospheric correction method and digital terrain models. Photogramm. Eng. Remote Sens. 59(12):1745–1753. Franklin, J., Davis, F., and Lefebvre, P. (1991), Thematic mapper analysis of tree crown cover in semi-arid woodlands using a model of canopy shadowing. Remote Sens. Environ. 36:189–202. Gauthier, R. P., Affern, F. J., Teillet, P. M., and Fedosejevs, G. (1991), Report on the specialist meeting on the derivation of bidirectional reflectance distribution functions for various ground cover types: Report of a workshop held 27–29 No-
vember 1990 in Tempe, Arizona initiated by the Canada Centre for Remote Sensing, hosted by the USDA Agricultural Research Service, Canada Centre for Remote Sensing Technical Report, Ottawa, Ontario, Canada. Gemmell, F. M. (1995), Effects of forest cover, terrain and scale on timber volume estimation with Thematic Mapper data in a Rocky Mountain site. Remote Sens. Environ. 51: 291–315. Goel, N. S. (1988), Models of vegetation canopy reflectance and their use in estimation of biophysical parameters from reflectance data. Remote Sens. Rev. 4:1–213. Hall, F. G., Shimabukuro, Y. E., and Huemmrich, K. F. (1995a), Remote sensing of forest biophysical structure using mixture decomposition and geometric reflectance models. Ecol. Appl. 5(4):993–1013. Hall, F. G., Townshend, J. R., and Engman, E. T. (1995b), Status of remote sensing algorithms for estimation of land surface state parameters. Remote Sens. Environ. 51:138–156. Holben, B., and Justice, C. (1981), An examination of spectral band ratioing to reduce the topographic effect in remotely sensed data. Int. J. Remote Sens. 2(2):115–133. Horler, D. N. H., and Ahern, F. J. (1986), Forestry information content of Thematic Mapper data. Int. J. Remote Sens. 7:405–428. Jasinski, M. F. (1996), Estimation of sub-pixel vegetation density of natural regions using satellite multispectral imagery. IEEE Trans. Geosci. Remote Sens. 34(3):804–813. Li, X., and Strahler, A. H. (1985), Geometric-optical modelling of a conifer forest canopy. IEEE Trans. Geosci. Remote Sens. GE-23:705–721. Li, X., and Strahler, A. H. (1986), Geometric-optical bidirectional reflectance modeling of a coniferous forest canopy. IEEE Trans Geosci. Remote Sens. GE-24:281–293. Li, X., and Strahler, A. H. (1992a), Geometric-optical bidirectional reflectance modeling of the discrete crown vegetation canopy: effect of crown shape and mutual shadowing. IEEE Trans. Geosci. Remote Sens. 30(2):276–292. Li, X., and Strahler, A. H. (1992b), Mutual shadowing and directional reflectance of a rough surface: a geometric-optical model. In Proceedings of the International Geoscience and Remote Sensing Symposium (IGARSS92), Houston, TX, May. Li, X., Strahler, A. H., and Woodcock, C. E. (1995), A hybrid geometric optical-radiative transfer approach for modeling albedo and directional reflectance of discontinuous canopies. IEEE Trans. Geosci. Remote Sens. 33:466–480. Markham, B. L., and Barker, J. L. (1986), Landsat MSS and TM post-calibration dynamic ranges, exoatmospheric reflectances and at-satellite temperatures, EOSAT Landsat Technical Notes No. 1, August, EOSAT, Lanham, MD. Peddle, D. R., Hall, F. G., and LeDrew, E. (1996), Remote sensing of boreal forest biophysical variables using spectral mixing analysis and a canopy reflectance model. In Proceedings of the 26th International Symposium on Remote Sensing of Environment, Vancouver, BC, Canada, 25–29 March, pp. 418–421. Press, W. H., Teukolsky, S. A., Vetterling, W. T., and Flannery, B. P. (1992), Numerical Recipes, 2nd ed., Cambridge University Press, Cambridge. Privette, J. L., Myneni, R. B., Tucker, C. J., and Emery, W. J. (1994), Invertibility of a 1-D discrete ordinates canopy reflectance model. Remote Sens. Environ. 48:89–105.
Terrain Effects on Forest Reflectance
Privette, J. L., Emery, W. J., and Schimel, D. S. (1996), Inversion of a vegetation reflectance model with NOAA AVHRR data. Remote Sens. Environ. 58:187–200. Rosema, A., Verhoef, W., Noorbergen, H., and Borgesius, J. J. (1992), A new forest light interaction model in support of forest monitoring. Remote Sens. Environ. 42:23–41. Ruiter, J. F., Peters, S. W. M., van de Griend, A. A., and Rosema, A. (1997), Monitoring boreal forest with Landsat TM: a validation of the Forest Light Interaction Model FLIM, in press. Sandmeier, S., and Itten, K. I. (1997), A physically-based model to correct atmospheric and illumination effects in optical satellite data of rugged terrain. IEEE Trans. Geosci. Remote Sens. 35(3):708–717. Schaaf, C. B., and Strahler, A. H. (1994), Validation of bidirectional and hemispherical reflectances from a geometric-optical model using ASAS imagery and pyranometer measurements of a spruce forest. Remote Sens. Environ. 49:138–144. Schaaf, C. B., Li., X., and Strahler, A. H. (1994), Topographic effects on bidirectional and hemispherical reflectances calculated with a geometric-optical canopy model. IEEE Trans. Geosci. Remote Sens. 32(6):1186–1193. Strahler, A. H., Wu, Y., and Franklin, J. (1988), Remote esti-
169
mation of tree size and density from satellite imagery by inversion of a geometric-optical canopy model. In Proceedings of the 22nd International Symposium on Remote Sensing of Environment, Abidjan, Ivory Coast, 20–26 October, Environmental Res. Inst. of Michigan, Ann Arbor, pp. 337–348. Teillet, P. M. (1986), Image correction for radiometric effects in remote sensing. Int. J. Remote Sens. 7(12):1637–1651. Teillet, P. M., and Fedosejevs, G. (1995), On the dark target approach to atmospheric correction of remotely sensed data. Can. J. Remote Sens. 21:374–387. Vermote, E. F., Tanre´, D., Deuze, J. L., Herman, M., and Morcrette, J. J. (1997), Second simulation of the satellite signal in the solar spectrum 6S: an overview. IEEE Trans. Geosci. Remote Sens. 35(3):675–686. Woodcock, C. E., Collins, J. B., Gopal, S., et al. (1994), Mapping forest vegetation using Landsat TM imagery and a canopy reflectance model. Remote Sens. Environ. 50:240–254. Woodcock, C. E., Collins, J. B., Jakabhazy, V. D., Li, X., Macomber, S. A., and Wu, Y. (1997), Inversion of the Li– Strahler canopy reflectance model for mapping forest structure. IEEE Trans. Geosci. Remote Sens. 35(2):405–414. Wu, Y., and Strahler, A. H. (1994), Remote estimation of crown size, stand density and biomass on the Oregon transect. Ecol. Appl. 4:299–312.