Key words: ischemic heart disease, iso-integral mapping, multi-channel SQUID ... obtain a map as projected total current image on the torso from the heart.
55
International Journal of Cardiac Imaging 16: 55±66, 2000. Ó 2000 Kluwer Academic Publishers. Printed in the Netherlands.
An iso-integral mapping technique using magnetocardiogram, and its possible use for diagnosis of ischemic heart disease Keiji Tsukada1, Tsuyoshi Miyashita1, Akihiko Kandori1, Toshio Mitsui2, Yasushi Terada2, Masato Sato2, Junko Shiono2, Hitoshi Horigome2, Satsuki Yamada2 & Iwao Yamaguchi2 1 2
Hitachi Ltd., Central Research Laboratory, 1-280 Higashikoigakubo, Kokubunji, Tokyo 185, Japan; Institute of Clinical Medicine, University of Tsukuba 1-1-1 Tennodai, Tsukuba, Ibaraki 305, Japan
Key words: ischemic heart disease, iso-integral mapping, multi-channel SQUID system, tangential MCG, ventricular depolarization, ventricular repolarization Abstract We have developed an iso-integral mapping technique that uses magneto-cardiogram (MCG) data to obtain a map as projected total current image on the torso from the heart. We have also investigated the applicability of iso-integral mapping to the diagnosis of ischemic heart disease. We simulated and measured the characteristics of two types of iso-integral maps: one using tangential (Bxy) components, and one using the normal component (Bz). Each vector component was measured by two types of superconducting quantum interference device (SQUID) system to determine the tangential and normal components. The tangential component of the magnetic ®eld appeared to be equivalent to the current image in the myocardium projected on the observing plane, and we were able to obtain a projected total current image by integration of the tangential components during the depolarization and repolarization processes. And we found that the iso-integral maps of normal hearts showed similar pattern in both processes; however, those of ischemic hearts showed dierent patterns. Introduction Ischemic heart disease is a particularly dangerous disease because of its high mortality and frequency of occurrence. To detect ischemic heart disease early, a non-invasive and convenient diagnostics method is needed. Electro-cardiograms (ECG) are widely used for diagnosing heart disease, and diagnosis is done through the analysis of ECG waveform changes. The advances in computer data acquisition and analysis capabilities also now enable easy measurement using multichannel electrodes, and body surface mapping (BSPM) [1] has been developed. With this technique, the imaging diagnosis method, a new category of electro-physiological measurement became possible.
Parallel to the progress made in BSPM, the magneto-cardiogram technique (MCG) [2, 3] has also been developed. The electrical current generated by the heart creates not only electric potential but also a magnetic ®eld. This weak magnetic ®eld from the heart can be measured in MCG with a superconducting quantum interference device (SQUID) used as an ultra-sensitive magnetic sensor, and mapping of the magnetic ®eld has been easily done with a multi-channel SQUID system [4±6]. Thus, either BSPM maps or MCG enables us to depict spatial information concerning the cardiac electrical sources, and allows us to noninvasively observe dynamic electro-physical phenomena in the heart [7]. However, while the BSPM maps are useful in identifying temporal changes
56 such as those caused by arrhythmia or conduction blocks, the diagnosis of ischemia is sometimes dicult with only dynamic change observation. For this reason, iso-integral mapping was developed for BSPM [8, 9]. In MCG, the normal component Bz, which is perpendicular to the chest wall, is usually measured. In a contour map using Bz, a current source in the heart produces a two-pole pattern having positive and negative poles, and the separation between the poles mean that neither will be directly above the current source. This complicates
iso-integral mapping pattern because movement of the current source that is random, over a long distance, or rotary, aects the integration values obtained within a desired interval for integration at each measuring point. This problem arises because the Bz contour map does not represent a direct one-to-one relationship between the magnetic ®eld strength and the active region of the heart. Here, we introduce a method for obtaining a projected total current image from the myocardium by using the tangential component Bxy. We have reported that the tangential magnetic
Figure 1. Schematic diagram of the relationship between the magnetic ®eld and the current dipole in the heart.
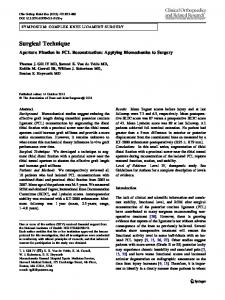
Figure 2. Simulated magnetic ®eld distributions generated in a horizontally layered conductor by a single current dipole. (a) iso-®eld map of normal component Bz. (b) iso-®eld map of tangential component |Bxy| = (|Bx|2 + |By|2)1/2.
57 ®eld pattern just above the current source, which means the tangential magnetic ®eld pattern is likely to be a two-dimensional current projection pattern on the observing plane [5, 6, 7, 10, 11]. This coincidence in location between the magnetic ®eld strength and the current source is what enables us to obtain a projected total current image by using an iso-integral of Bxy. We have investigated the usefulness of this analysis technique for the diagnosis of ischemic heart disease, and also discuss our ®ndings in this paper. Simulation To analyze electro-magnetic phenomena in the heart in detail through simulation, we usually have
to use a torso model that is realistic in body shape, and in the conductivity of components such as the heart, blood, and lungs. However, to simplify our analysis of the relationship between the current in the heart and magnetic ®eld pattern we used a much simpler torso model as described below. The current source in the heart is usually assumed to be a current dipole. A current dipole in the conductor volume creates two external magnetic ®elds, Bex Bp Bv where, Bp is caused by the primary current and Bv is caused by the volume current. We express the magnetic ®elds at the observing plane outside the horizontally layered conductor used as a simple torso model, assuming that the moment of the current dipole Q is located at r0
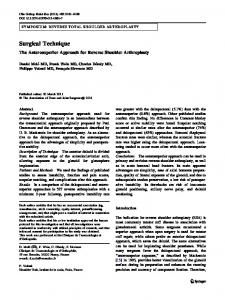
Figure 3. Simulated change in iso-integral maps of the normal and tangential components caused by rotation of the current dipole. (a) Iso-integral map of normal component Bz. (b) Iso-integral map of tangential component |Bxy| = (|Bx|2 + |By|2)1/2.
58 inside the conductor, using the formula derived by Sarvas [12]. The frontal plane is assumed to be the x±y planes, and the direction perpendicular to the surface is assumed to be the z-axis (Figure 1). The absolute value of the moment of the current dipole was ®xed at 5 lA m and it was located )40 mm from the observing plane (z = 0) and parallel to the y-axis (h = 90°) in the horizontally layered conductor. Figure 2 shows the magnetic®eld pattern of the normal component and that of the tangential component generated by a single dipole. The normal component Bz means that the locations of the two (a positive and a negative) ®eld extrema will not be directly above the current dipole. On the other hand, the iso-®eld map of the tangential component |Bxy| = (|Bx|2 + |By|2)1/2 which is a two-dimensional vector parallel to the observing plane, shows a single-pole pattern just above the current dipole. These characteristics con®rmed the coincidence between the peak of a tangential magnetic ®eld pattern and the position of a current source. The decrement of h did not change the peak position of the magnetic ®eld, but the strength decreased in both the tangential Bxy and normal maps. These characteristics show that both magnetic ®eld patterns depend only on the tangential component of the current dipole vector. When the dipole was rotated, the location of the magnetic peak remained above the current dipole in the tangential magnetic ®eld. On the other hand, the maximum and minimum poles of the normal magnetic ®eld were rotated at the center of the dipole. This characteristic was a problem in the integration during the source rotation. Figure 3 shows the iso-integral maps of the tangential and normal components when the current dipole was rotated from 0° to 360° with a constant rotation speed. The iso-integral map of the normal component showed a fairly ¯at pattern because of the dierence in location between the magnetic ®eld peak and the current source. After the dipole was rotated, the integrated value became zero, and in such a case we cannot distinguish whether there was no dipole or that the dipole had been rotated. On the other hand, the location of the maximum integrated value in the tangential map did not change, and the integration value was proportional to the rotation time. Thus we observed the
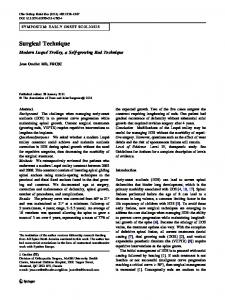
c Figure 5. Gridmaps showing the time waveform of each magnetic-®eld component for a one-heartbeat period. (a) Schematic diagram of 8 ´ 8 recording sites on the chest. (b) Gridmap of Bx, and (c) By. (d) Overlapped 64 channel time waveform of Bx and (e) By.
total projected current image on the observing plane from the iso-integral map obtained from the tangential magnetic ®eld. The integral maps of the normal component shown in Figure 3 were obtained using a scalar of Bz. Next, we considered the absolute value of Bz. The integral values at each point were increased (Figure 4), but the location of the current dipole remained dicult to determine during the integration time, as was the case with the scalar Bz. Consequently, since the tangential component of a magnetic ®eld parallel to the surface best
Figure 4. Iso-integral map using the absolute normal component |Bz| and its roation angle dependence.
59
Table 1. Patients' demographics (n = 10). Patient No.
Age (years)
Sex
Diagnosis
Coronary angiography (Location and severity of stenosis)
Echocardiograph left ventricular ejection fraction (%)
RCA(%)
LAD(%)
LCX(%)
#7, 90, #9, 90 #5, 25, #6, 100, #9, 90 #6, 99 #6, 75, #9, 90 #7, 75, #9, 99 #7, 90, #8, 75 #7, 90, #9, 90 #5, 50, #7, 75, #9, 50, #10, 90 #5, 75, #7, 50 #6, 75, #7, 75
#11, 90 #12, 95
34 53
#13, 75 #11, 90 #12, 99, #13, 99 #12, 50, #13, 50
60 67 75 78 51 68
#11, 75, #13, 99 #IM, 50
43 50
P1 P2
70 65
Male Male
OMI, AP OMI, AP
#1, 100 #2, 99
P3 P4 P5 P6 P7 P8
73 63 53 67 61 59
Male Male Male Male Female Male
AP OMI, AP OMI, AP AP OMI, AP AP
P9 P10
72 70
Female Male
OMI, AP OMI, AP
#2, 75 #3, 100 #3, 100 #2, 90, #4PD, 90 #2, 90 #1, 100, #4AV, 90, #4PD, 90 #1, 50, #3, 99 #2, 100
OMI: Old myocardial infarction; AP: angina pectoris; RCA: right coronary artery; LAD: left anterior descending artery; LCX: left circum¯ex artery; LCA: left coronary artery.
60
Figure 6. Sequential iso-®eld maps of QRS and ST-T. (a) QRS at 10-ms intervals and 2 pTsteps. (b) ST-T at 20-ms intervals and 0.5 pTsteps.
61
Figure 7. Overlapped 64-channel waveforms, and integration regions for the iso-integral map. (tangential component |Bxy| = (|Bx|2 + |By|2)1/2)
re¯ects a current source position, we obtained the total current distribution image from an isointegral map. MCG data The MCG measurements were carried out with a 32-channel low-Tc SQUID system to measure tangential components (Bx, By). The system used 16 measuring points with a grid spacing of 25 mm, and these measuring points were arranged in a 8 ´ 8 grid making the measurement are a 175 ´ 175 mm (Figure 5a) when a combined fourshifted measuring area was used. The plane of observation parallel to the chest was considered the x±y plane, where x and y are the axes with x directed from right to left and y directed from head to foot. The signals were acquired at a sampling rate of 1 kHz and passed through a 0.1±100 Hz
band-pass ®lter and a power-line noise (50 Hz) ®lter. The measurement period was 30 s, and the data was averaged. Electrocardiograms were also acquired as reference signals. The iso-®eld map of the tangential component is made by using the equation jBxy j. And the iso-integral map is made by integrating jBxy j at each measuring point during the depolarization and repolarization processes. We obtained MCG data from twelve healthy subjects (9 men and 3 women; mean age 33 10 years) who had no history of cardiac disease, and from ten subjects (8 men and 2 women; mean age 65 12 years) who were patients with coronary artery disease (ischemia or infraction) (Table 1). The location and severity of stenosis measured by coronary angiography is based on a American Heart Association committee report [13]. The left ventricular ejection fraction evaluated by echocardiograph is based on a report from The American Society of Echocardiography [14].
62
Figure 8. Iso-integral maps from the tangential components of all twelve normal subjects.
63
Figure 8. (Continued).
Informed consent was obtained from all subjects and MCG measurements were performed. Results and discussion Figure 5b, c show typical examples of gridmaps made from one-beat waveforms for the tangential components Bx and By of a healthy subject at each measuring point. Each waveform indicates the temporal change in each vector component at a measuring point (64 points). From these temporal waveforms, we drew iso-magnetic ®eld maps where measured values of a magnetic ®eld with the same magnitude were connected by lines in the measuring area for each point in time. Figure 6a, b show sequential contour maps where (a) is a map of the QRS (the depolarization process) with a 5-ms interval, and (b) is a map of ST-T (the repolarization process) with a 20-ms interval.
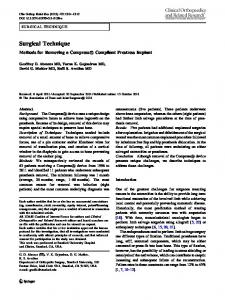
In the depolarization process, the direction and position of the current sources quickly changes compared to during repolarization. Figure 7 shows overlapped waveforms of the tangential components on the same baseline. In Figure 7, two time intervals representing the depolarization process (QRS) and the repolarization process (ST-T) are clearly de®ned. From this ®gure, iso-integral maps for these time intervals were obtained. The iso-integral maps from all twelve normal subjects are shown in Figure 8. The dark areas indicate the presence of a highest integral value, and this value is listed at the peak point. As for all the healthy subjects, for both the depolarization and repolarization processes, the iso-integral maps of tangential components show similar patterns. The maximum-value area in each map is located in the area of the left ventricle, and it re¯ects the high myocardium volume of the left ventricle. However, the integral values of the repolarization are higher than that of the depolarization in each patient. Considering our results were obtained by simulation and from measurements on healthy subjects, we conclude that the tangential component of the iso-integral map re¯ects the projected total-current image on the measuring plane. We next tested a technique that uses the iso-integral map to detect ischemic heart disease. The iso-integral maps obtained from all ten patients with coronary artery disease (ischemia or infarction) are shown in Figure 9. These isointegral maps show that depolarization and repolarization exhibit dierent patterns. All subjects suering from heart problems show several dierences. In contrast to the normal subjects' maps, all ten patients' integral values of the repolarization are lower than those of the depolarization. The maximum values of each depolarization and repolarization of all subjects are shown in the Figure 10a, b. The values of individual subjects are dierent. Magnetic ®eld strength is in inverse proportion to r2 (r: distance between sensor and current source). This means that magnetic ®eld strength and its iso-integral value are easily affected by chest dimension, myocardial wall thickness and heart size. The ratio of the integrated values of repolarization to that of depolarization is a distinctive parameter. The normal subjects and
64
Figure 9. Iso-integral maps obtained from all ten patients with coronary artery disease (ischemia or infarction).
65
Figure 10. Comparison of maximum depolarization and repolarization values. (a) Normal subjects. (b) Patients with coronary artery disease.
the patients with ischemic heart disease clearly show opposite characteristics. The ratios of the normal subjects are more than 1. On the other hand, the ratios of the patients with coronary artery disease are less than 1. We believe these dierences in the mapping pattern and ratio of the iso-integral value are due to current perturbations caused by the ischemic and/or infarction parts. That is, the current ¯ow in the ischemic part seems to become random during the repolarization process. In normal myocardium, the current ¯ow is uniform. Alternatively, the current ¯ow may be disturbed in the ischemic and/ or infarction parts, and this disturbance causes the macro-size total current to become weaker. Subsequently, the strength of the magnetic ®eld will become weaker. Another possible explanation of the disturbance is that the current ¯ow direction during depolarization changes from that during repolarization in the ischemic part. We have developed an iso-integral mapping technique that uses a tangential magnetic ®eld. This technique can be used for non-invasive diagnosis of ishemic heart disease. However, the iso-integral map is a two-dimensional image and
does not show depth information at the present. By further developing this technique three-dimensional visualization of the current image in the myocardium will be possible. Conclusion We have developed a total current imaging method that uses MCG iso-integral maps. With this system, we found that the iso-integral maps of normal subjects have a similar pattern for both the depolarization and repolarization processes. However, there was a clear dierence between both the processes in the case of an ischemic heart. Thus, this method is a promising tool for diagnosing ischemic heart disease. References 1. Taccardi B. Distributions of hearts potentials on the thoracic surface. Circulation Research 1963; 12: 341±352. 2. Baule G, McFee R. Detection of the magnetic ®eld of the heart. Amer Heart J 1963; 66: 95±96. 3. Cohen D, Edelsack EA, Zimmerman JE. Magnetocardiogram taken inside a shielded room with a superconducting
66
4.
5.
6.
7.
8.
9.
point-contact magnetometer. Appl Phys Lett 1970; 16: 278±280. Hoenig HE, Daalmans GM, Bar L, Bommel F, Paulus A, Uhl D, et al. Multichannel dc SQUID sensor array for biomagnetic applications. IEEE Trans Magn 1991; 27: 2777±2784. Tsukada K, Haruta Y, Adachi A, Ogata H, Komuro T, Takada Y, et al. Multichannel SQUID system detecting tangential components of the cardiac magnetic ®eld. Rev Sci Instruments 1995; 66: 5085±5091. Tsukada K, Kandori A, Miyashita T, Sasabuti H, Suzuki H, Kondo S, et al. A simpli®ed superconducting quantum interference device system to analyze vector components of a cardiac magnetic ®eld. Proceedings of the 20th annual international conference of the IEEE engineering in medicine and biology society 1998; 29 October±1 November: 524±527. Tsukada K, Mitsui T, Terada Y, Horigome H, Yamaguchi I. Noninvasive visualization of multiple simultaneously activated regions on torso magnetocardiographic maps during ventricular depolarization. J Electrocardiol 1999; 32: 305±313. Montague TJ, Smith ER, Cameron DA, Rautaharju PM, Klassen GA, Felmington CS, et al. Isointegral analysis of body surface maps: Surface distribution and temporal variability in normal subjects. Circulation 1981; 63: 1166±1172. Tonooka I, Kubota I, Watanabe Y, et al. Isointegral analysis of BSMs for the assessment of location and size of myocardial infarction. Am J Cardiol 1983; 52: 1174±1180.
10. Miyahsita T, Kandori A, Tsukada K, Sato M, Terada Y, Horigome H, et al. Construction of tangential vectors from normal cardiac magnetic ®eld components. Proceedings of the 20th annual international conference of the IEEE engineering in medicine and biology society 1998; 29 October± 1 November: 520±523. 11. Horigome H, Tsukada K, Kandori A, Shiono J, Mitsui A, Terada Y, Mitsui T. Visualization of regional myocardial depolarization by tangential component mapping on magnetocardiogram in children. Int J Cardiac Imaging 1999; 15: 331±337. 12. Sarvas J. Basic mathematical and electromagnetic concepts of the biomagnetic inverse problem. Phys Med Biol 1987; 32: 11±22. 13. Gerald Austen W, Jesse E Edwards, Robert L Frye, Goredo G Gensini, Vincent L Gott, Grith SC, et al. AHA committee report; A reporting system on patients evaluated for coronary artery disease. Circulation 1975; 51: 5±40. 14. Schiller NB, Shah PM, Crawford M, DeMaria A, Devereux R, Feigenbum H, et al. Recommendations for quanti®cation of the left ventricle by two-dimensional echocardiography. J Am Soc Echo 1989; 2: 358±367.
Address for correspondence: Keiji Tsukada, Hitachi Ltd., Central Research Laboratory, 1-280 Higashikoigakubo, Kokubunji, Tokyo 185, Japan.