AN ITERATIVE MODEL-CONSTRAINED GRAPH-CUT ALGORITHM FOR ABDOMINAL AORTIC ANEURYSM THROMBUS SEGMENTATION Moti Freiman1 , Steven J. Esses2,3 , Leo Joskowicz1 , Jacob Sosna3 1
School of Engineering and Computer Science, The Hebrew University of Jerusalem, Israel. 2 Mount Sinai School of Medicine, New York, NY. 3 Dept. of Radiology, Hadassah Hebrew University Medical Center, Jerusalem, Israel. Email:
[email protected] ABSTRACT
We present an iterative model-constrained graph-cut algorithm for the segmentation of Abdominal Aortic Aneurysm (AAA) thrombus. Given an initial segmentation of the aortic lumen, our method automatically segments the thrombus by iteratively coupling intensity-based graph min-cut segmentation and geometric parametric model fitting. The geometric model effectively constrains the graph min-cut segmentation from “leaking” to nearby veins and organs. Experimental results on 8 AAA CTA datasets yield robust segmentations of the AAA thrombus in 2 mins computer time with a mean absolute volume difference of 8.0% and mean volumetric overlap error of 12.9%, which is comparable to the interobserver error. Index Terms— Abdominal Aortic Aneurysm thrombus, segmentation, model constrained graph min-cut. 1. INTRODUCTION Abdominal Aortic Aneurysms (AAA) are a common and dangerous condition of the endovascular system. An AAA is formed when the arterial walls of the abdominal aorta are weakened, thus increasing the risk of rupture and internal bleeding. Contrast enhanced CT Angiography (CTA) is widely used for AAA evaluation, as it provides detailed images of the aortic anatomy, including the lumen, the calcifications, and the thrombus. Automatic segmentation and 3D reconstruction of the AAA from CTA images can be of clinical use to support decisions including rupture risk estimation based on the aneurysm diameter and volume [1], evaluation of endovascular repair, selection of stent type and size [1], and postoperative follow-up based AAA volume changes [2]. Although many segmentation methods for vascular structures have been developed (see [3] for a current survey), the segmentation of the AAA thrombus remains a challenging task due to the intensity values overlap of the aneurysm This research is supported in part by MAGNETON grant 38652 from the Israeli Ministry of Trade and Industry.
978-1-4244-4126-6/10/$25.00 ©2010 IEEE
672
thrombus and its surrounding tissue (Fig. 1a). Several AAA thrombus segmentation methods have been recently developed. They include: 1) interactive contour tracking method for axial slices [4]; 2) deformable model approach steered by a nonparametric statistical grey level appearance model of an prior lumen contour shape segmented interactively [5]; 3) level-set segmentation based on a parametric statistical model that combines both local and global features initialized with an approximate surface [6], and; 4) deformable B-spline parametric model based on a nonparametric intensity distribution model [7]. The main drawbacks of these methods are that they require significant user interaction to initialize the model and to fine-tune the model parameters that steer the model deformation process. Often times, the optimization process converges to a local minimum and thus the resulting segmentation is not optimal. The graph min-cut method [8] is a global optimization approach that has proven to be effective in a variety of segmentation tasks, including vessels lumen segmentation [9, 10]. It classifies the voxel nodes that separate the object of interest from the background based on both weighted voxel adjacencies and prior intensity models of the object and the background. The advantages of the graph min-cut segmentation are that it is generic, is nearly parameter-free, that it does not require initialization, and that it guarantees a globally optimal solution. However, since the graph min-cut method relies on an intensity model, it cannot always differentiate between the aortic thrombus and its surrounding tissue. The addition of geometric shape constraint can help in discriminating and in guiding the optimization towards a more accurate segmentation. However, incorporating global constraints such as connectivity [11] or geometric parametric shape constraint turns the graph min-cut problem into an NP-hard problem for which only approximate global solutions are feasible. In this paper, we present an iterative graph min-cut segmentation approach for the segmentation of the AAA thrombus that uses a hybrid model that combines intensity information with global geometric parametric model constraint. An iterative approach is used to estimate the latent model and
ISBI 2010
to perform the segmentation. This coupling iteratively constrains the final global shape of the segmented surface, and thus provide accurate segmentation of the AAA thrombus. Experimental results on 8 datasets show that our method can segment the AAA thrombus accurately and that it is robust and applicable for routine clinical use.
Given a CTA volume I, we first compute a lumen segmentation and lumen centerline with the method described in [9]. Based on this segmentation, the goal is to separate the AAA thrombus (object) from the surrounding structures (background). The separation is defined by a labeling map M in which each voxel i is labeled as being either object or background. The standard graph min-cut approach [8] minimizes the energy function: E(M ) =
φ(Ii |mi ) +
i
X
E(M )
=
i
2 6
7 5
(a) original image
(b) initial min-cut
(c) model fitting
(d) final result
! ψ(mi , mj )
j
where φ(Ii |mi ) is the probability of voxel i to have the label mi based on a given prior Intensity Probability Distribution Function (IPDF) model, and ψ(mi , mj ) represents the probability that voxel i and its neighbor voxels j have different labels based on the intensity difference between them. The model defined by this function has several drawbacks: 1) the prior intensity model φ(Ii |mi ) does not include global shape information of the object; 2) its computation requires intensive user interaction; and 3) the estimated intensity model accuracy is limited. For the specific task of thrombus segmentation, a model that only relies on intensity distribution cannot properly separate between the thrombus and its surrounding tissue (Fig. 1). To overcome these drawbacks, we propose to use a hybrid model that consists of both intensity and global geometric shape constraint in a probabilistic framework that combines both model estimation and object segmentation. Our model is defined using the following energy function: X
3 4
2. METHOD
X
1
φ(Ii |mi ) + ψ(mi |Θ) + X
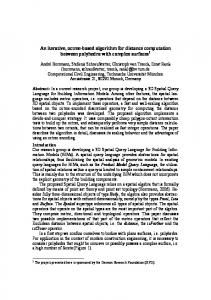
Fig. 1. Illustration of the segmentation process on a clinical axial CTA slice of an aortic thrombus: (a) original slice with the following anatomy: 1) aortic lumen, 2) aortic thrombus, 3) Inferior Vena Cava (IVC), 4) right psoas muscle, 5) left psoas muscle, 6) vertebrae, 7) the small bowel; (b) the initial mincut segmentation; (c) parametric model fitted to (b), and; (d) final result, after the iterative process, combined both lumen (red) and thrombus (green) segmentation results. Since Θ is unknown, this function cannot be directly minimized. Instead, we use a two-step iterative approach [12]: 1. Estimate the labeling map M assuming a fixed geometric parametric model Θ 2. Update the geometric parametric model Θ and the object intensity model φ(Ii |mi ) with labeling map M . The two steps are iterated until convergence, i.e., until M and Θ do not change any more. We describe the two steps in detail next.
φ(Ii |mi , mj ) + ψ(mi , mj |Θ)
j
where Θ is a geometric parametric model describes the global shape of the required object. The probability that voxel i has the label mi based on the intensity model φ(Ii |mi ) and on ψ(mi |Θ) which describes probability that the voxel have the label mi based on estimated geometric model, φ(Ii |mi , mj ) is the probability that two adjacent voxels have different labels based on their intensity difference, and ψ(mi , mj |Θ) describes the probability that voxels i and j have different labels, considering their spatial location with respect to the estimated geometric model Θ. the class mi can be the object class (mo ), or the background class (mb ) only.
673
2.1. Labeling map estimation The labeling map M is computed using the graph min-cut technique as follows. Let G = (V, E) be the image graph, where the graph nodes define as V = {v1 , . . . vn , vs , vt } such that node vi corresponds to voxel i and terminal nodes vs and vt correspond to the object and background classes. The graph edges E = {(vi , vs ), (vi , vt ), (vi , vj )} consist of three groups: 1) edges (vi , vs ) from voxels to the object terminal node; 2) edges (vi , vt ) from voxels to the background terminal node, and; 3) edges (vi , vy ) between adjacent voxels (6
or 26 neighbors for the 3D CTA images). The cost of a cut |C| that divides the graph into the object class (source vertex) and the background class (target vertex) is defined as the sum of the weights of the cut edges e ∈ C. The segmentation is the bipartite graph partition that minimizes the cost of the cut between the two parts. Edge weights are assigned as follows. Edge weights w(vi , vs ) represent the posterior probability that voxel vi is related to the thrombus (object) based on a hybrid intensity and geometric constraints model: (a) Axial view
w(vi , vs ) = φ(Ii |mo ) · ψ(mi = mo |Θ)
(b) Sagittal view
where φ(Ii |mo ) is the probability that the voxel i belongs to the object class mo based on the voxel intensity and object IPDF considered as a normal distribution. The term ψ(mi = mo |Θ) is the probability that voxel label mi is the object label mo given the estimated geometric model Θ. Edge weights w(vi , vt ) represent the probability of each voxel to belong to background class. Since we do not have a prior explicit model for the background, we define it as the complement of the object prior model: (c) Coronal view
w(vi , vt ) = 1 − w(vi , vs )
Edge weights w(vi , vj ) represent the probability of these edge to represent the surface that discriminates between the object and the background. It is based on a combination of the local gradient magnitude and the spatial location of the edge with respect to the estimated geometric model Θ: « „ (Ii − Ij )2 · ψ(mi , mj |Θ) w(vi , vj ) = exp − σ
where σ is a normalization constant, and ψ(mi , mj |Θ) represents the probability that the voxels i and j have different labels given the estimated geometric model. 2.2. Geometric parametric model fitting Given an initial segmentation, the next step is to fit the geometric parametric model Θ to it. Based on the observations in [4], the abdominal aortic thrombus can be modeled as a set of 2D axial ellipsoids. Thus, for each axial slice, we fit an ellipsoid using the Iterative Closest Point approach [13]. The fitting algorithm consists of three steps: 1. Collect a set of points P on the segmentation surface by computing the intersection between that surface and radial rays emanating from the ellipsoid center point from the previous slice . 2. Compute the distance from each point pi ∈ P to the estimated ellipsoid surface using Euclidean distance map representation of the surface [14]. 3. Fit a 2D parametric ellipsoid to the set of points P using Taubin’s least-squares method [15].
674
(d) 3D view
(e) 3D view
Fig. 2. AAA thrombus segmentation results. (a)-(c) 2D slices of different patients with and without stent placement. The resulted lumen and thrombus contour (red) with the manual segmentation contour (green) are overlaid on the original CTA slice. (d)-(e) 3D surface renderings show the lumen (red) and the thrombus (green) of the resulted segmentations. Steps 2 and 3 are applied iteratively, where on each iteration, only the n closest points to the computed ellipsoid remain in P and the other points are eliminated. This method provides robust and accurate fitting of a parametric model to the observed points set. Since the differences between nearby slices are relatively small, the estimated model for slice z is used to initialize the fitting algorithm for slice z + 1. The coupling of min-cut segmentation and global geometric model fitting yields a robust and accurate method that segment the thrombus successfully for different datasets with varying thrombus size and locations. 3. EXPERIMENTAL RESULTS We evaluated the performance of our method by automatically segmenting 8 clinical AAA CTA datasets. Patients were administered 100cc of non-iodinated contrast agent with a rapid injection aid at 3-4cc per sec. The CTAs consist of 512 × 512 × 500 voxels with physical voxel sizes in the 0.71.2mm range. The datasets included various sizes and locations of the thrombus. Some of them were acquired after stent placement, and thus include strong streaking artifacts. Ground-
truth segmentations of the thrombus for each dataset was obtained manually by a clinical radiologist. For each thrombus, the user provided two seeds for the lumen segmentation [9]. Then, our automatic thrombus segmentation algorithm was applied. Fig. 2 presents our method’s results on several representative cases. Note that our method successfully separates between the thrombus and the surrounding structures such as veins, muscles, and fat. Both volumetric (1-2), and surface (3) based measures were used to evaluate our method’s performance. The mean (std) values were: (1) absolute volume difference 8.0% (7.0%); (2) volumetric overlap error 12.9%(std=4.3%); (3) average symmetric surface distance 1.46mm (std=0.4mm). The mean running time for entire segmentation, including both lumen and thrombus segmentation was 120sec (std=43sec) on a standard PC (dual-core 2.0GHZ processor and 4GB of memory). These results are comparable with previously reported interobserver errors [4] with no user interaction as is required by other methods [4, 5, 7]. 4. CONCLUSIONS We have presented an automatic method for the accurate segmentation of AAA thrombus from an initial lumen segmentation. Our approach iteratively combines intensity based graph min-cut segmentation constrained by parametric model fitted to previous segmentation result. The fitted model constrains the graph min-cut segmentation from leaking to the thrombus nearby structures such as the veins and muscles. Our experimental results show that the tool is accurate, is easy to use, and is robust to varying thrombus locations and sizes for datasets with and without stents. 5. REFERENCES [1] S.C. Whitaker, “Imaging abdominal aortic aneurysm before and after endoluminal stent-graft repair,” Eur. J. Radiol., vol. 39, pp. 3–15, 2001. [2] B. Kritpracha, H. G. Beebe, and A. J. Comerota, “Aortic diameter is an insensitive measurement of early aneurysm expansion after endografting,” J. Endovasc. Ther., vol. 11, no. 2, pp. 184–190, 2004. [3] D. Lesage, E.D. Angelini, I. Bloch, and G. FunkaLea, “A Review of 3D Vessel Lumen Segmentation Techniques: Models, Features and Extraction Schemes,” Med. Image Anal., vol. 13, no. 6, pp. 819–845, 2009. [4] M. de Bruijne, B. van Ginneken, M.A. Viergever, and W.J. Niessen, “Interactive segmentation of abdominal aortic aneurysms in CTA images,” Med. image anal., vol. 8, no. 2, pp. 127–138, 2004.
675
[5] S.D. Olabarriaga and et al, “Segmentation of thrombus in abdominal aortic aneurysms from CTA with nonparametric statistical grey level appearance modeling,” IEEE Trans. Med. Imaging,, vol. 24, no. 4, pp. 477–485, 2005. [6] F. Zhuge, G.D. Rubin, S. Sun, and S Napel, “An abdominal aortic aneurysm segmentation method: Level set with region and statistical information,” Med. Phys., vol. 33, no. 5, pp. 1440–1453, 2006. [7] S. Demirci, G. Lejeune, and N. Navab, “Hybrid deformable model for aneurysm segmentation,” in IEEE Int. Symp. on Biomedical Imaging: From Nano to Macro, ISBI’2009, 2009. [8] Y. Boykov and G. Funka-Lea, “Graph Cuts and Efficient N-D Image Segmentation,” Int. J. of Comp. Vision, vol. 70, no. 2, pp. 109–131, 2006. [9] M. Freiman, N. Broide, M. Natanzon, L. Weizman, E. Nammer, O. Shilon, J. Frank, L. Joskowicz, and Sosna. J., “Vessels-Cut: a graph based approach to carotid arteries patient-specific modeling,” in 2nd workshop on: 3D Physiological Human 3DPH’2009, 2009, vol. 5903 of LNCS, pp. 1–12. [10] Gulsun M.A. and H. Tek, “Segmentation of Carotid Arteries By Graph-Cuts Using Centerline Models,” in 3D Segmentation in the Clinic: Carotid Lumen Segmentation and Stenosis Grading Challenge, R. Hameeteman, M. Zuluaga, L. Joskowicz, M. Freiman, and T. van Walsum, Eds., 2009, http://cls2009.bigr.nl. [11] S. Vicente, V. Kolmogorov, and C. Rother, “Graph cut based image segmentation with connectivity priors,” in IEEE Conf. Comp. Vis. and Patt. Rec. CVPR’2008, 2008. [12] M.P. Kumar, P.H.S. Torr, and A. Zisserman, “OBJ CUT,” in IEEE Conf. Comp. Vis. and Patt. Rec. CVPR’2005, 2005. [13] P.J. Besl and H.D. McKay, “A method for registration of 3-D shapes,” IEEE Trans. Patt. Anal. and Mach. Intell., vol. 14, no. 2, pp. 239–256, 1992. [14] C.R. Maurer, Q. Rensheng, and V. Raghavan, “A linear time algorithm for computing exact Euclidean distance transforms of binary images in arbitrary dimensions,” IEEE Trans. Patt. Anal. and Mach. Intell., vol. 25, no. 2, pp. 265–270, 2003. [15] G. Taubin, “Estimation Of Planar Curves, Surfaces And Nonplanar Space Curves Defined By Implicit Equations, With Applications To Edge And Range Image Segmentation,” IEEE Trans. Patt. Anal. and Mach. Intell., vol. 13, no. 11, pp. 1115–1138, 1991.