www.ccsenet.org/cis
Computer and Information Science
Vol. 5, No. 1; January 2012
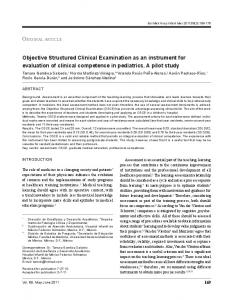
An Online Management Information System for Objective Structured Clinical Examinations Thomas JB Kropmans Medical Informatics & Medical Education Comerford Medical Education Centre Room 204 Clinical Science Institute College of Medicine, Nursing & Health Sciences Discipline of Medicine domain Medical Informatics & Medical Education National University of Ireland Galway, Ireland Tel: 353-91-495-478
E-mail:
[email protected] Barry GG O’Donovan
Discipline of General Practice National University of Ireland Galway (NUIG) University Hospital David Cunningham College of Medicine, Nursing & Health Sciences Discipline of Medicine domain Medical Informatics & Medical Education National University of Ireland Galway, Ireland Andrew W Murphy Discipline of General Practice National University of Ireland Galway (NUIG) University Hospital Gerard Flaherty College of Medicine, Nursing & Health Sciences National University of Ireland Galway, Ireland Debra Nestel Faculty of Medicine, Nursing and Health Sciences Gippsland Medical School MONASH University Fidelma P Dunne Head School of Medicine Received: September 27, 2011
Accepted: November 22, 2011
doi:10.5539/cis.v5n1p38
URL: http://dx.doi.org/10.5539/cis.v5n1p38
38
Published: January 1, 2012
ISSN 1913-8989
E-ISSN 1913-8997
www.ccsenet.org/cis
Computer and Information Science
Vol. 5, No. 1; January 2012
The project of developing an OSCE Management Information System project was kindly sponsored by a Millennium Grant and a grant from the School of Medicine Curriculum Innovation Fund. Abstract Objective Structured Clinical Examinations (OSCE) are adopted for high stakes assessment in medical education. Students pass through a series of timed stations demonstrating specific skills. Examiners observe and rate students using predetermined criteria. In most OSCEs low level technology is used to capture, analyse and produce results. We describe an OSCE Management Information System (OMIS) to streamline the OSCE process and improve quality assurance. OMIS captured OSCE data in real time using a Web 2.0 platform. We compared the traditional paper trail outcome with detailed real time analyses of separate stations. Using a paper trail version only one student failed the OSCE. However, OMIS identified nineteen possibly ‘incompetent’ students. Although there are limitations to the design of the study, the results are promising and likely to lead to defendable judgements on student performance. Keywords: Clinical skills, OSCE, Online assessment, Generalizability theory, G-study, D-study 1. Introduction For decades in undergraduate medical, dental and health science curricula, clinical competence has been assessed using Objective Structured Clinical Examinations (OSCEs) (Harden, 1988; Harden & Gleeson, 1979). Although OSCEs are known to be robust and useful assessments, the paper trail is laborious and expensive (Cusimano et al., 1994; Frye, Richards, Philp, & Philp, 1989). An OSCE contains various stations designed to assess students’ skills with judgements made by examiners and, sometimes simulated patients. Cost-effectiveness is an increasingly important consideration in medical education although rarely reported in the literature (Ratanawongsa et al., 2008; Walshe & Smith, 2006). Estimations of the development and administration of, a six-station OSCE report 327.5 hours of staff and faculty time for each rotation of students. That equates to 8.2 hours of staff involvement per student (Cusimano et al., 1994). The implementation required 110 hours of staff and faculty time (2.75 hours per student). According to Cussimano, direct expenses for the OSCE amounted to US$ 6.90, equivalent to €4.70 per student per station (Cusimano et al., 1994). Our medical school administers on average eleven, 7-12 station OSCEs for a cohort of 670 students, produces 9380 assessment forms over the curriculum. To produce final OSCE results, the administrative cost of this procedure is €29,500, which is €2.80 per paper form. Attempts have been made to streamline OSCE administrative processes. Although widely used to store and analyse OSCE data, Optical Mark Readers (OMR) have several problems (Lindemann, Rock, Locke, & Johnson, 1991). These are associated with inflexible assessment forms, error messages while scanning the forms, additional printing costs and limited descriptive statistics of the analysis. Adaptation of OMR software solutions to customise an institution wide variability of OSCE stations forms can be expensive. The advent of dynamic Web 2.0 technology is an exciting alternative to OMR. Quality control and validity evidence of OSCE results can be generated using the generalizability theory (Al-Naami, 2008; Iramaneerat, Yudkowsky, Myford, & Downing, 2008; Varkey, Natt, Lesnick, Downing, & Yudkowsky, 2008). Where various examiners assess clinical competencies in different stations using various forms, items and scoring methods, sources of variation will affect the ‘observed’ outcome of students (Iramaneerat et al., 2008; Kropmans & Cosic, 2004; Zijlstra-Shaw, Kropmans, & Tams, 2005). To make reliable decisions on student performance, account needs to be taken of examiners’ variation while monitoring students’ performance repeatedly in one (intra- and/or inter observer reliability) or in different stations (case-specificity) (Crossley, Humphris, & Jolly, 2002). Furthermore, the assessment items chosen by the developers will cause ‘error’ around the ‘observed score’ (Schoonheim-Klein et al., 2008). Considerable evidence proves OSCEs to be robust, useful and labour intensive (Berkenstadt, Ziv, Gafni, & Sidi, 2006; Lafave, Katz, & Butterwick, 2008; Raj, Badcock, Brown, Deighton, & O'Reilly, 2007). However, quality assurance analyses of routine OSCEs are rarely published (Peeraer et al., 2008). Inter-observer variation refers to the phenomenon of one observer always scoring higher than his/her colleague. Intra-observer variation is the variation within one observer – the ‘good/bad day’ phenomenon. Case specificity represents the variation within a candidate between various parts of the assessment (stations), even if these are intended to assess the same competence (Crossley, Humphris et al., 2002). Inter-examiner reliability is the likelihood of different examiners making the same judgement about an individual student. This judgement has been noted as a concern by many educators (Abe & Kawada, 2008). A computer model to assess inter-examiner Published by Canadian Center of Science and Education
39
www.ccsenet.org/cis
Computer and Information Science
Vol. 5, No. 1; January 2012
reliability using a re-examination system to analyse captured videos has been described (Abe & Kawada, 2008). An Excel spreadsheet was used to record real time data to re-assess doubtful clinical competencies. In cases of noted disagreement between examiners, results were re-played and re-assessed. We have not identified any reports of online web tools that capture and analyse real time data of OSCEs. An overall mean result of a student in an OSCE only reflects average information about how well the student performed over all of the stations. Observed overall outcome of an OSCE does not reflect individual performance in each station or per competency being assessed. Reliability and validity of the items scored in each station in general is not reflected in any institutional quality assurance of the assessment procedure. Neither are interaction effects between observers, students and stations reflected upon. A generalizability and decision study is the most appropriate way to analyse all interactions and error analyses around the ‘true’ score of the observation. The decision study provides quality analyses of the educational decision process (Auewarakul et al., 2005; Axelson & Kreiter, 2009; Bergus & Kreiter, 2007; Walters et al., 2005). We developed an online OSCE Management Information System (OMIS) capturing real time data. Assessment forms were to be created online, assessment data should be captured in real time and OSCE station results should be available instantly. Tablet PCs, laptops and desktop PCs have been used during the OSCE to capture the data using ‘old’ assessment forms in an online format. The purpose of this study was to test and analyse the automated ‘real time’ results achieved in various stations by various observers using OMIS. Results from individual stations and the overall performance of students were compared. Overall results using the paper trail were compared with this new type of online analyses. Further, access to quality assurance measures of the clinical skills assessment is provided, using classical psychometric analyses, G- and D-studies. 2. Methods 2.1 Setting The medical school of the National University of Ireland Galway is a small sized school within the College of Medicine, Nursing and Health Sciences. It is one of 6 medical schools in the Republic of Irelands. A 6 years undergraduate curriculum including a foundation year is transmitted to approximately 700 students. 2.2 Subjects Clinical competency was assessed in a cohort of fifty-three fourth year medical students – some are in their fifth year (having done foundation year). Students were scheduled to complete their OSCE in three cycles of thirteen students and one cycle of fourteen students. 2.3 The OSCE The GP skills assessment consisted of eleven stations. Stations assessed competence in performing diverse tasks such as measuring blood pressure, managing elevated blood pressure, performing venepuncture facilitating behavioural change, assessing a patient who is ’tired at all times’ and performing a rectal examination using a simulator, and analysing a urine sample. Each OSCE station was of five minutes duration with two rest stations. The first cycle started at 0900h and the last cycle finished at 1525h. 2.3.1 Assessment forms The criteria-based assessment forms ranged from 5 to 15 criteria. Each criterion was assessed using a 2- to 4item Likert scale. The Likert scale in this system can be graphically represented by a Visual Analogue Scale which was preferred by the OSCE developers. No prior information regarding reliability and validity of the assessment forms is available. Each station had separate examiners (GPs) for morning and afternoon cycles completing the electronic assessment forms. The rectal station had three examiners. No prior information regarding intra- or inter-examiners reliability of this OSCE is available. 2.3.2 OMIS Software OMIS was developed within our School of Medicine (Division of Medical Informatics and Medical Education). It comprises of a Web 2.0 platform created in PHP/MySQL including Motools, AJAX and XML was used to make the software highly dynamic and interactive. The interface is wireless and data transfer protocols are encrypted and password protected. OMIS consists of a form creation tool, an assessment tool and a data analysis tool. Data were exported to Excel for further analyses in SPSS and GENOVA (GENeralized analyses Of Variance; Generalizability Theory John Brennan c.s; National Board of Medical Examiners http://www.nbme.org). Items from previously developed paper forms were copied into the form creation tool. The system enables the addition of written feedback (script recognition on tablet PC) to the electronic form. The 40
ISSN 1913-8989
E-ISSN 1913-8997
www.ccsenet.org/cis
Computer and Information Science
Vol. 5, No. 1; January 2012
form creation tool, the assessment tool and the analysis tool run on all regular browsers like IE7.0+ and Firefox. The software is commercially available through Qpercom Ltd http://www.qpercom.com 2.3.3 OMIS Hardware OMIS runs on an Apache Server and interfaces with computer desktops, laptops and tablets (iPad). 2.3.4 Training The observers were quickly and easily trained in advance on how to use the software. The training consisted of logging into the system with account details and password. Examiners opened the dedicated assessment forms of their station(s) from the central virtual server (database). The software is user-friendly with training lasting up to ten minutes varying from observer and amount of stations being used. Marking criteria and discriminators become visible while hovering over the markers with mouse or fingertip. 2.3.5 Pass mark The overall pass mark in assessment in undergraduate medical education in Ireland is 50% out of 100%. Students pass if they have 50% or more of the pass criteria (marks) of all stations. A pass or failure rate per stations was not considered in this OSCE. We do not use standard setting and we do not adjust the standard to accommodate the 50% rule. An overall mark up to 49 is considered as a failure level, 50 – 59 is a pass level. From 60 - 69 is a second class honour and 70 and above is a first class honour level. 2.3.6 Analyses Performances of students and examiners on stations were analysed using Anova procedures of SPSS 15 (Statistical Package for Social Sciences). For each station mean, standard deviation, minimum and maximum scores for students and examiners are presented. Percentage of failures, passes, second and first class honours on each station and the overall score are reported. To assess differences between levels of assessment per stations, analyses of variances (Anova; SPSS) for each outcome level was carried out. A p-value lower than 0.05 was considered to represent a statistically significant difference. To assess sources of variation in the assessment procedure a generalizability study and decision studies were carried out using GENOVA (John Brennan c.s National Board of Medical Examiners; Philadelphia). Sources of variation are the students (O), stations (S) and items (I) and all interactions. Stations and items are ‘fixed factors’ in the G-study. Stations and items were ‘nested’ (S:I). Due to the asymmetric design of this OSCE only 4 stations out of 9 with 10-items each were included in the G- and D-study. Observers were not distributed symmetrically amongst stations and could therefore not be analysed as a separate source of variation. The Standard Error of the Measurement procedure (SEMp) is calculated as the square root of the absolute error variance of the measurement procedure (Cronbach, Gleser, Nanda, & Rajaratman, 1972). The width of the corresponding 95% confidence limits in between the observed value is expected is 1.96 x the SEMp. To decide whether a student improved over a certain period of time the Smallest Detectable Difference might be calculated. This is the amount of change that should be measured to be statistically significant improvement in the individual student is 1.96 x √2 x SEMp. The more reliable the measurement procedure is the better it might detect change over time. The SEMp; 95% CI and SDD are expressed in the unit of measurement. These exams are marked in percentages (0-100%). 3. Results Using the paper trail method, the overall results revealed that one student failed (2%) while the remaining 52 students (98%) passed. Twenty-one (40%) achieved a pass level, twenty-seven (52%) got second-class honours, and first-class honours was achieved by four students (8%). All stations except the rectal station (P> 0.05) differentiated between the various levels of competence of students (P< 0.05). The failing student failed in 7 out of 10 stations. The minimum marks (in bold) of the other 9 stations are ‘unreliable’ or ‘not defendable’ because students with pass and a second class honours apparently fail in 3 to 4 out of 10 stations. The maximum marks in the rectal station vary from 69 to 96 which are considered as first class honours. Apart from the rectal station, the examiners’ marks did not differ statistically significantly from each other. Three examiners (no. 9, 10 and 13) marked the rectal station. Although all students passed that station, examiners did not agree on marks (Figure 1, circle). Therefore the rectal station was not discriminating between various levels of competences and examiners disagreed on the marks given. It was decided to remove the rectal
Published by Canadian Center of Science and Education
41
www.ccsenet.org/cis
Computer and Information Science
Vol. 5, No. 1; January 2012
station from the analysis. Removing the rectal station, it appeared that on instant quality assurance nineteen students of 53 (35%) failed. Analysing the paper trail only would not have achieved this type of information so quickly. The decision of taking out the rectal station was made within an hour of the OSCE finishing. Detailed results per station and per level are shown in Table 1. Figure 1: The authors considered that the mean (SD) results of the rectal station 80 (SD=10) compensated marks of at least two other stations. The means of the ‘listening’ and at the ‘tired all the time’ stations were 45 (SD=12) and 48 (SD=6) marks respectively. These two stations are considered to be ‘fail’ stations with an overall fail mark. According to Table 1, 27 students achieved an overall second class honours whereby in the ‘listening station’ with a mean (SD) station outcome of 49 (SD=12), the minimum was 14 and maximum 64. The same pattern was observed for the ‘tired all the time’ interviewing station with a mean of 50 (SD=6) and 27 second class honours with a minimum mark of 40 and a maximum of 63.Therefore, students with overall second class honours failed in either of these two stations. Variation between stations and items was analysed in the Generalizability study (G-study). Of all variation 98% was caused by Objects/students (5%), Stations (31%) and Items (62%). Interaction effects of stations and Objects accounted for 1 % and Objects/Items and Stations for 1% (in total 2%) (Table 2). From the decision study with 4 stations we know that in case these 4 stations assess only 4 items the Standard Error of the Measurement procedure (SEMp) is 12% with a 95% Confidence Interval (CI) of 23%. The Smallest Detectable Difference in case of repeated assessment is 46%. Increasing the amount of items (10) would lead to a smaller SEMp 5% with a 95% CI of 10% and a SDD of 20% (Table 3). In Table 3b the hypothetical results are presented in case we had up to 10 stations using the same variance components being analysed in this study. Increasing the amount of stations and items would result in a reduction of the SEMp from 12% up to 3%. Whereas the Smallest Detectable Difference reduced from 46% to 13% (Table 3b) in case of 4 stations with 10 items each. The results were released within a day finishing the OSCE whereby the paper trail results could only be released after 6 working days. Preparing OMIS for this OSCE, including transforming paper forms into digital format took half of a working day. 4. Discussion Quality assurance analyses were instantly available using OMIS. Nineteen students would have failed the exam using the new system compared to a system using the ‘traditional’ paper method. OMIS decreased administrative workload and cost by more than 70 percent. Final results were instantly available where usually students had to wait two weeks before final results could be released. The authors compared the overall marks of students with and without the results achieved in the rectal station (Figure 2). The ANOVA exposed the rectal station as not being discriminative. A systematic error of on average of 10 marks was added on to the results achieved in other stations. Students who failed in 3 or 4 out of 10 stations achieved an overall pass mark or even second or first class honours because of their results in the rectal station. Figure 2: This preliminary study was based on 53 students only. Due to the instant availability of real time results OMIS will be implemented for all OSCEs at our medical school in 2010/11. We expect to gain insight in the quality assurance of our OSCEs on an ongoing basis. Students will be able to view results and written feedback shortly after being assessed (Figure 3). Figure 3: Using OMIS quality is assurance and data are ‘instantly’ available. Taking real time data into account nineteen students failed the exam whereas with the paper trail method only one student failed. Prior to using OMIS we had no insight in these detailed results due to time and budget constraints. This may have serious implication for patient and clinician safety. OMIS is a highly dynamic software tool allowing its users to design many kinds of assessment forms with Likert, numeric or visual analogue scales (sliders). Items to assess knowledge, skills and attitudes can be separated in different competency fields. Detailed insight is generated automatically for stations, items and examiners (per station and per item). The system can be used for both formative and summative assessments. Written feedback
42
ISSN 1913-8989
E-ISSN 1913-8997
www.ccsenet.org/cis
Computer and Information Science
Vol. 5, No. 1; January 2012
added to the assessment forms is stored in the central database of the system. We are currently developing an email feature whereby PDF printouts of the forms can be emailed to students for feedback purposes. The error variance in the main facet of the G-study is only 5% whereas the major contribution to overall variance is due to stations and items. The system allows some classical psychometric analyses of data. For detailed and customised analyses the data need to be exported into MS Excel for further analyses in SPSS or GENOVA. 4.1 Conclusion We could only include 4 out of 9 stations in piloting the G- and D-study because these stations were set up in a symmetric design. The symmetric design included 4 stations holding 10 assessment criteria each. We could not control for examiners because they were exchanged over time depending on their own schedules. So inter-observer variability is included in the I:S facet. Moreover the marking range in items varied from 3 up to 10 marks per item. Interaction effects of students (O) and Stations (S) and items (I) is very low compared to the Stations and Items facet. The large amount of I:S effect must be explained by the fact that examiners, their interpretation of items and stations were all included in the I:S design. Due to this incomplete design we could not discriminate between various facets like examiners and stations. To provide full access to quality assurance, OSCE designs need to be symmetric regarding number of stations, items, marking criteria and examiners. An overall pass mark of 50% means OSCE developers consider students to be competent having only 50% of the required overall mark in skills, knowledge and attitudes. All students (apart from one) passed according to this traditional standard. We found 19 (36%) students with borderline pass marks (ranging from 50 – 58) failing in 3 or 4 stations which should be considered as incompetent at the time. We strongly recommend reconsidering the 50% rule. A maximum amount of stations that might be ‘missed’ should be included in the pass/failure rule. The latter should depend on the amount of stations included in an OSCE and based on prior quality analyses of the OSCE. GENOVA is a MS DOS programme and is not very user friendly. Analyses of variance components like students, stations, items and examiners need to be incorporated into the OMIS system analyses. Detailed analyses depends on individual research questions of the OSCE team involved and need to be excluded from system based analyses. Acknowledgements Benjamin Kanagaratnam was instrumental in developing the OSCE Management Information System within the discipline of Medicine domain of Medical Informatics & Medical Education of the College of Medicine, Nursing & Health Sciences of the National University of Ireland Galway (NUIG). We are grateful for the work done by our Dutch intern students Jan Paul Eikelenboom and Kevin JJ Hoogervorst of the School of Information Technology; Hanze University of Applied Sciences Groningen (the Netherlands). The support generated by Dean Professor Gerard Loftus of the College was crucial for the development of the prototype and final result of this project. The Technology Transfer Office (NUIG) with Fiona Neary, Clodagh Barry and Pat Kelly was very helpful in commercialising the technology. We are grateful for the commercial support and feedback from Bart Kelderman and Radmer de Jong; In Tense Safety Training & Assessment Zwolle (the Netherlands); Dr. Ada van der Velde; Desiderius School of Medicine Erasmus University of Rotterdam (the Netherlands) and the NUIG School of Nursing who all contributed to the validation process of OMIS. References Abe, S., & Kawada, E. (2008). Development of computer-based OSCE re-examination system for minimizing inter-examiner discrepancy. Bull Tokyo Dent Coll, 49(1), 1-6. http://dx.doi.org/10.2209/tdcpublication.49.1 Al-Naami, M. Y. (2008). Reliability, validity, and feasibility of the Objective Structured Clinical Examination in assessing clinical skills of final year surgical clerkship. Saudi Med J, 29(12), 1802-1807. Auewarakul, C., Downing, S. M., Jaturatamrong, U., & Praditsuwan, R. (2005). Sources of validity evidence for an internal medicine student evaluation system: An evaluative study of assessment methods. Medical Education, 39(3), 276-283. http://dx.doi.org/10.1111/j.1365-2929.2005.02090.x Axelson, R. D., & Kreiter, C. D. (2009). Rater and occasion impacts on the reliability of pre-admission assessments. Medical Education, 43(12), 1198-1202. http://dx.doi.org/10.1111/j.1365-2923.2009.03537.x Bergus, G. R., & Kreiter, C. D. (2007). The reliability of summative judgements based on objective structured clinical examination cases distributed across the clinical year. Medical Education, 41(7), 661-666. http://dx.doi.org/10.1111/j.1365-2923.2007.02786.x
Published by Canadian Center of Science and Education
43
www.ccsenet.org/cis
Computer and Information Science
Vol. 5, No. 1; January 2012
Berkenstadt, H., Ziv, A., Gafni, N., & Sidi, A. (2006). The validation process of incorporating simulation-based accreditation into the anesthesiology Israeli national board exams. Isr Med Assoc J, 8(10), 728-733. Cronbach, J., Gleser, G., Nanda, H., & Rajaratman, N. (1972). The dependability of behavioral measurements: Theory of generalizability for scores and profiles. New York: John Wiley and Sons. Crossley, J., Davies, H., Humphris, G., & Jolly, B. (2002). Generalisability: a key to unlock professional assessment. Med Educ, 36(10), 972-978. http://dx.doi.org/10.1046/j.1365-2923.2002.01320.x Crossley, J., Humphris, G., & Jolly, B. (2002). Assessing health professionals. Med Educ, 36(9), 800-804. http://dx.doi.org/10.1046/j.1365-2923.2002.01294.x Cusimano, M. D., Cohen, R., Tucker, W., Murnaghan, J., Kodama, R., & Reznick, R. (1994). A comparative analysis of the costs of administration of an OSCE (objective structured clinical examination). Acad Med, 69(7), 571-576. http://dx.doi.org/10.1097/00001888-199407000-00014 Frye, A. W., Richards, B. F., Philp, E. B., & Philp, J. R. (1989). Is it worth it? A look at the costs and benefits of an OSCE for second-year medical students. Med Teach, 11(3-4), 291-293. http://dx.doi.org/10.3109/01421598909146415 Harden, R. M. (1988). What http://dx.doi.org/10.3109/01421598809019321
is
an
OSCE?
Med
Teach,
10(1),
19-22.
Harden, R. M., & Gleeson, F. A. (1979). Assessment of clinical competence using an objective structured clinical examination (OSCE). Med Educ, 13(1), 41-54. http://dx.doi.org/10.1111/j.1365-2923.1979.tb00918.x Iramaneerat, C., Yudkowsky, R., Myford, C. M., & Downing, S. M. (2008). Quality control of an OSCE using generalizability theory and many-faceted Rasch measurement. Adv Health Sci Educ Theory Pract, 13(4), 479-493. http://dx.doi.org/10.1007/s10459-007-9060-8 Kropmans, T. J., & Cosic, K. (2004). Assessment of 'borderline' clinical competence using generalisability and decision studies in dental skills training. Eur J Dent Educ, 8(3), 127-132. http://dx.doi.org/10.1111/j.1600-0579.2004.00342.x Kropmans, T. J., Dijkstra, P. U., Stegenga, B., Stewart, R., & de Bont, L. G. (1999). Smallest detectable difference in outcome variables related to painful restriction of the temporomandibular joint. J Dent Res, 78(3), 784-789. http://dx.doi.org/10.1177/00220345990780031101 Lafave, M., Katz, L., & Butterwick, D. (2008). Development of a content-valid standardized orthopedic assessment tool (SOAT). Adv Health Sci Educ Theory Pract, 13(4), 397-406. http://dx.doi.org/10.1007/s10459-006-9050-2 Lindemann, M., Rock, P., Locke, J. A., & Johnson, R. (1991). Optical mark reader technology and data base development in anesthesiology and critical care medicine at the Johns Hopkins Medical Institutions. Proc Annu Symp Comput Appl Med Care, 798-802. Peeraer, G., Muijtjens, A. M., De Winter, B. Y., Remmen, R., Hendrickx, K., Bossaert, L., et al. (2008). Unintentional failure to assess for experience in senior undergraduate OSCE scoring. Med Educ, 42(7), 669-675. http://dx.doi.org/10.1111/j.1365-2923.2008.03043.x Raj, N., Badcock, L. J., Brown, G. A., Deighton, C. M., & O'Reilly, S. C. (2007). Design and validation of 2 objective structured clinical examination stations to assess core undergraduate examination skills of the hand and knee. J Rheumatol, 34(2), 421-424. Ratanawongsa, N., Thomas, P. A., Marinopoulos, S. S., Dorman, T., Wilson, L. M., Ashar, B. H., et al. (Writer). (2008). The reported validity and reliability of methods for evaluating continuing medical education: A systematic review, Academic Medicine. http://dx.doi.org/10.1097/ACM.0b013e3181637925 Schoonheim-Klein, M., Muijtjens, A., Habets, L., Manogue, M., Van der Vleuten, C., Hoogstraten, J., et al. (2008). On the reliability of a dental OSCE, using SEM: effect of different days. Eur J Dent Educ, 12(3), 131-137. http://dx.doi.org/10.1111/j.1600-0579.2008.00507.x Varkey, P., Natt, N., Lesnick, T., Downing, S., & Yudkowsky, R. (2008). Validity evidence for an OSCE to assess competency in systems-based practice and practice-based learning and improvement: a preliminary investigation. Acad Med, 83(8), 775-780. http://dx.doi.org/10.1097/ACM.0b013e31817ec873 Walshe, K., & Smith, J. (2006). Healthcare Management. Oxford University Press.
44
ISSN 1913-8989
E-ISSN 1913-8997
www.ccsenet.org/cis
Computer and Information Science
Vol. 5, No. 1; January 2012
Walters, K., Osborn, D., & Raven, P. (2005). The development, validity and reliability of a multimodality objective structured clinical examination in psychiatry. Medical Education, 39(3), 292-298. http://dx.doi.org/10.1111/j.1365-2929.2005.02091.x Zijlstra-Shaw, S., Kropmans, T. J., & Tams, J. (2005). Assessment of professional behaviour--a comparison of self-assessment by first year dental students and assessment by staff. Br Dent J, 198(3), 165-171. http://dx.doi.org/10.1038/sj.bdj.4812047
Table 1. Results per station, numbers in bold represent failing students in stations although their level of performance is Pass or above Station name Measuring blood pressure (Station 1)
Managing blood pressure (2)
Urinalysis (3)
Venepuncture (4)
Rectal examination (5)
Behavioural change (6)
Explaining (7)
Listening (8)
Attitudes (9)
Interviewing station ‘Tired all the time’ (10)
Levels of Competence Fail Pass 2nd class 1st class Overall Fail Pass 2nd class 1st class Overall Fail Pass 2nd class 1st class Overall Fail Pass 2nd class 1st class Overall Fail Pass 2nd class 1st class Overall Fail Pass 2nd class 1st class Overall Fail Pass 2nd class 1st class Overall Fail Pass 2nd class 1st class Overall Fail Pass 2nd class 1st class Overall Fail Pass 2nd class 1st class Overall
N 1 21 27 4 1 21 27 4 1 21 27 4 1 21 27 4 1 21 27 4 1 21 27 4 1 21 27 4 1 21 27 4 1 21 27 4 1 21 27 4
Mean Station (%) 45 63 80 91 73 51 62 70 83 67 47 58 68 77 64 54 63 73 84 70 69 78 81 83 80 43 49 58 61 54 49 52 61 69 58 26 39 49 63 45* 47 50 56 66 54 45 44 50 54 48*
Published by Canadian Center of Science and Education
SD 11 10 4 14 10 9 5 11 7 8 5 10 10 9 5 11 9 10 10 10 8 8 3 9 6 7 5 9 8 12 9 12 8 7 11 9 4 6 6 6
Minimum
Maximum
45 47 59 86 45 51 40 59 77 40 47 43 54 74 43 54 42 52 77 42 69 55 56 72 55 43 36 43 58 36 49 37 48 65 37 26 25 14 53 14 47 36 42 59 36 45 34 40 49 34
45 78 98 94 98 51 81 84 85 85 47 74 86 84 86 54 80 84 88 88 69 89 93 96 96 43 60 72 63 72 49 61 76 74 76 26 54 65 72 72 47 66 67 82 82 45 51 63 63 63
P value
< 0.000
< 0.000
< 0.000
< 0.000
0.444
< 0.000
< 0.000
< 0.000
< 0.002
< 0.000
45
www.ccsenet.org/cis
Computer and Information Science
Vol. 5, No. 1; January 2012
Table 2. Generalizability study of students (O), station (S) and items (I) and all interactions. Df=degrees of freedom; SS=sum of squares; MS=mean squares; VC=Variance Components; %EV=percentage of error variance and %TV=percentage of total variance
Table 3. Two different types of D-studies with 4 up to 10 stations. The first model is based on the ‘true estimated scores’ and the second model is based on the hypothetical scores (G-coefficient and Phi calculated). SEMp is the Standard Error of the Measurement procedure with 95% Confidence Interval (95% CI) and Smallest Detectable Difference (SDD). SEMp; 95% CI and SDD are expressed in the unit of measurement (marks in percentage)
46
ISSN 1913-8989
E-ISSN 1913-8997
www.ccsenet.org/cis
Computer and Information Science
Vol. 5, No. 1; January 2012
Marks given by each Examiner per station 90
80
70
60
50 100
40 90
80
marks
30
70
20 60
10
50 9
10
13
gp
0 s15/1/2
S16/2/3
S17/2/4
S19/5/6
St20/7/8
St21/9/10/13
S23/10/11
S24/12/13
S25/14/15
S27/12/16
Figure 1. Marks given per station and examiners. Marks differ between examiners 9, 10 and 13 statistically significant (P < 0.05) for the rectal station (inlay)
Exclusion of non-predicting station (19) 800
700
600
Final mark
500
With Rectal
400
Without Rectal
300
200
100
0 1
3
5
7
9
11
13
15
17
19
21
2
25
27
2
31
3
35
37
3
41
4
45
47
4
51
53
St ud ent s
Figure 2. Marks given with and without the rectal station a systematic error caused by the rectal station compensated 19 students overall fail mark (< 500 marks)
Published by Canadian Center of Science and Education
47
www.ccsenet.orrg/cis
Com mputer and Infoormation Sciencee
Vol. 5, No. 1; January 20112
Figure 3.. An example oof an online station form
48
ISS SSN 1913-8989
E-ISSN 1913-89997