as soon as a system requires being mobile and autonomous those extreme values make a ... The main advantage of Java language is to allow application development with an abstraction of the target platform, mak-. Start JVM. Initialization of.
An Opcode Level Energy Consumption Model for a Java Virtual Machine Sébastien Lafond and Johan Lilius Turku Centre for Computer Science FIN-20520 Turku, Finland {slafond; jolilius}@abo.fi - http://www.tucs.fi
Abstract In this paper we establish a general framework for estimating the energy consumption of an embedded Java virtual machine (JVM). We have designed a number of experiments to find the constant overhead of the Virtual Machine and establish an energy consumption cost for individual Java Opcodes. The results show that there is a basic constant overhead for every Java program, and that a subset of Java opcodes have an almost constant energy cost. We also show that memory access is a crucial energy consumption component.
Start JVM
Initialization of the VM
Load the class containing the main method
Interpreter loop
Exit
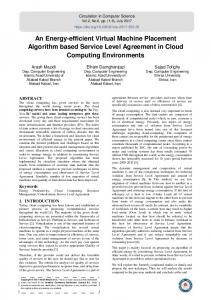
Figure 1: Simple view of the JVM life cycle Java Class generator
Java Application (source code)
Java Virtual Machine (Source code)
Java Code Compact (JCC)
Compiler & Linker
Energy consumption per instruction
Executable (Application + VM)
Processor Emulator (ARM7TDMI)
Platform data (memory mapping)
Energy profiler
Processor trace file : Memory - Instruction Event - Register - Bus
1 Introduction Battery specification
We mostly know problems related to power dissipation from the noisy fans and the more and more sophisticated cooling systems that need to be installed on modern PC processors. As the number of transistors integrated on one chip increases, the power dissipation follows the same trend. For an Intel Pentium IV manufactured in 90 m process technology the power dissipation can reach 115 Watts and drain up to 91 Amperes through its 86 supply voltage pins. Nevertheless, as soon as a system requires being mobile and autonomous those extreme values make a Pentium IV unusable over standard battery characteristics. In order to extend the battery life of a handheld device two solutions can be applied: increase the amount of energy embedded in the device, or decrease its energy consumption. Much effort has been put into increasing the battery capacity, but solutions are costly in terms of price, volume and weight. Therefore, the attention has been turned to develop so called Low Power Systems. In this paper we will focus on energy consumption of embedded Java applications and characterize the JVM’s energy consumption.
2 An energy model of Java applications The main advantage of Java language is to allow application development with an abstraction of the target platform, mak-
Energy
Max. running time of the application
Figure 2: General measurements methodology scheme ing the concept "write once, run it anywhere" possible. Figure 1 shows a simple view of the JVM life cycle. An efficient energy model should characterize each stage of the life cycle model, and thus show in which stage(s) efforts need to be concentrated to achieve energy optimization. It seems obvious that such model needs to consider the system’s hardware and software configurations and therefore is not directly portable. However, the methodology used to build it can easily be applied on different configurations.
2.1 Measurements methodology We chose to use the Sun Microsystems K Virtual Machine (KVM), CLDC v1.0.3, as it has been developed for a resource-constrained platform and has its source code freely available. KVM is a small virtual machine containing about 50-80 Kb of object code in its standard configuration and has a total memory footprint in the range of 128-256 Kb.
Energy Distribution 8.12%
Memory/Instructions Distribution
3.71%
29.93%
Instructions
StartJVM Inst
25.73%
StartJVM Inst.
StartJVM Mem.
KVMStart Inst.
KVMStart Mem
89,2
210,94
748,81
1639,18
StartJVM Mem
Memory
KVM Start Inst KVM Start Mem Interpret Inst Interpret Mem
KVM Clean Inst.
KVMClean Mem
Interpreter Inst.
Interpreter Mem.
144,92
326,38
3552
8273
KVM Clean Instr KVM Clean Mem Garbage Inst Garbage Mem
70.07% 60.94%
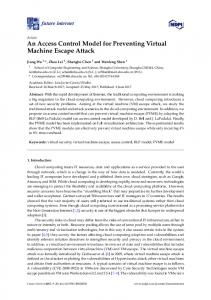
Figure 3: Typical energy distribution Figure 2 shows the measurements methodology scheme used to characterize each stage of the KVM life cycle. The Java class generator generates, from template classes, Java applications with the possibility to modify parameters inside the class source code. With the Java to C translator JCC we compile and link together the JVM source code and the generated Java application. The executable code is run on the ARM7TDMI emulator ARMulator [1], which traces instructions, memory accesses and events that occur during the application execution. From this trace, we extract all information concerning the memory access addresses, size and type (read, write, sequential, non-sequential), the instructions addresses and their corresponding processor opcodes. The energy profiler reads the emulator trace and access databases providing processor instruction costs and the cost of a memory access depending of its address, size and type. The energy profiler estimates the energy consumed by the application and provides information on how the energy is distributed between the processor and memories for each KVM stage.
Table 1: KVM Energy Consumption Overhead in ��� by memory accesses and 30% by processor instruction execution. Our experiments also showed that even for applications with numerous ’already dead’ object instantiations in the heap constrained environment the garbage collection energy consumption will still remain under 15% of the total JVM’s energy consumption. From all experiments done it is clear that the interpreter stage is far ahead the main source of energy consumption and a better comprehension of it is needed if someone wants to achieve energy optimization of the KVM. As the interpreter reads and executes the Java bytecode into machine instructions, having a closer view on the interpreter implies increasing the granularity of its energy consumption model by looking at the cost of each interpreted Java opcode. In [2] we present a list of Java opcodes and their energy consumption values and show that the KVM interpreter mechanism overhead represents at least 63% of the energy consumption for each opcode. In addition, we show that for a subset of opcodes the standard deviation is about 10% of the subset average energy consumption.
4 Conclusion and future work 3 Experiments and results We have run the measurement process over a test bench of small and basic applications to characterize each stage of the KVM life cycle and see if some stages are dominant. All results presented in this paper have been obtained for the hardware configuration of the Atmel AT91EB01 evaluation board that implements an ARM7TDMI processor core with 512K bytes SRAM and 128K bytes flash memories. All observations on the results indicate that some KVM stages consume a constant amount of energy independently of the Java application running on it. Table 1 shows the three constant stages and their energy consumptions as well as the interpreter overhead energy cost due to respectively processor instructions execution and memory accesses. StartJVM represents the StartJVM(argc, argv) function which only checks if the user gave a class name as argument. KVM_Start represents the KVM_Start() function which initializes the VM, and KVM_Cleanup represents the KVM_Cleanup() function that runs several finalize functions when the VM is shut down. Figure 3 shows a typical energy distribution for an embedded Java application with 70% of the energy consumed
As the Java virtual machine interpreter is by far the main source of energy consumption and the interpreter mechanism overhead is the predominant factor in opcode execution cost, it will be interesting to look at the differences of energy consumption between the two possible Java execution modes: interpreted or just in time (JIT) compilation. JIT compilation increases significantly the execution speed, but at the same time increases memory footprint. A trade-off between execution time and memory footprint size will certainly have to be found to reach the optimum optimization point for energy consumption.
References [1] ARMulator. http://www.arm.com. [2] S. Lafond and J. Lilius. An energy consumption model for java vitual machine. Technical Report 597, Turku Centre for Computer Science, Mars 2004.