integration of sustainability into urban wasteland regeneration projects cannot be ... the development of an operational indicator system for the integration of ...
An Operational Indicator System for the Integration of Sustainability into the Design Process of Urban Wasteland Regeneration Projects Martine Laprise, MArch
Sophie Lufkin, PhD
Emmanuel Rey, Prof. PhD
Laboratory of Architecture and Sustainable Technologies (LAST), Ecole Polytechnique Fédérale de Lausanne (EPFL), Switzerland.
Laboratory of Architecture and Sustainable Technologies (LAST), Ecole Polytechnique Fédérale de Lausanne (EPFL), Switzerland.
Laboratory of Architecture and Sustainable Technologies (LAST), Ecole Polytechnique Fédérale de Lausanne (EPFL), Switzerland.
ABSTRACT
In the context of sustainable development of European post-industrial cities, urban wastelands offer an important potential of surfaces to recapture. The regeneration of these sites is indeed an opportunity to simultaneously create density within the existing built fabric and revitalize some portions of cities and metropolitan areas. Although the launching of several initiatives of this type can be observed, their implication toward sustainable development is in most cases implicit and superficial. In point of fact, integration of sustainability into urban wasteland regeneration projects cannot be summarized by a mere density issue. It requires a proactive search for global quality, implemented in a participative way into the project dynamics, and a continuous monitoring of environmental, social and economic dimensions adapted to such projects. Specifically addressing these considerations, this paper introduces the development of an operational indicator system for the integration of sustainability into the design process of urban wasteland regeneration projects. It aims to provide a tool for structured and continuous evaluation, hinged on their specific characteristics, and to give useful basis to stakeholders involved in their management. Subsequently, the paper presents a first test application performed on a project underway in Switzerland, which validates its usability. Further work suggests the integration of the system into a digital monitoring tool in order to make it applicable to a variety of projects of this type. INTRODUCTION
Although Urban Wasteland Regeneration Projects (UWRP) embody a strategic potential to revitalize and densify existing urban fabrics, they are often not as sustainable as they may seem (Rey, 2007). Indeed, this strategy - as part of the compact and polycentric city model (Jenks, 1998; Rogers & Gumuchdjian, 1998) - is no guaranty of inclusion of the three pillars of sustainability: the economic, the ecological and the sociocultural (Andres & Bochet, 2010). Integration of sustainability into UWRP goes through the pursuit of a global quality and a constant follow-up of environmental, sociocultural and economic dimensions adapted to projects on those sites (Rey, 2012). In this sense, existing evaluation Emmanuel REY is professor at the Ecole Polytechnique Fédérale de Lausanne (EPFL) and head of the Laboratory of architecture and sustainable technologies (LAST), Switzerland. Dr. Sophie Lufkin is a scientist and Martine Laprise is a doctoral assistant at the same laboratory.
systems for large scale developments (LEED ND, BREEAM communities, HQE aménagement, DGNB New urban districts, etc.) do not address the specificities of UWRP. Therefore, few studies have developed methodologies for sustainability assessment adapted to the characteristics of the projects located on these sites. However, our analysis reveals that they are dissociated from the design process and do not totally address the specificities of UWRP. As a result, none of them are currently operational. Hence, the purpose of this paper is to introduce SIPRIUS (Rey, 2012), an operational indicator system for the integration of specific sustainability issues into the design process of such projects, as well as the methodology that precedes its development. Afterwards, a test application on a case study in Neuchâtel (Switzerland) demonstrates the relevance and applicability of the indicator system to UWRP. SPECIFICITIES OF UWRP
Wastelands have a unique identity, whether positive or negative (cultural symbol, economic and social stigma, sense of insecurity, risk of contamination, etc.). Projects on these sites are not limited to a single building. Quite the contrary, their scale ranges from urban planning to architectural design. Hence, neighborhood scale seems the most appropriate to encompass the full implications of these projects (CABERNET, 2006). But unlike new neighborhood developments, urban wastelands are already transformed and yet abandoned. Economic and ecological potential of existing buildings – and consequently architectural heritage – implies making decisions on the level of conservation (OFEN, 2013). Moreover, because they are disconnected from their urban context and emptied from permanent population, projects on wastelands neither can be considered as neighborhood renewals. Urban wastelands are not irreversible but their regeneration is highly complex. This is due in part to the long duration of the regeneration process, which involves a variation of several elements (conditions, needs, modification of general terms, changes in project leaders and actors, etc.). Moreover, the implication of a multitude of stakeholders with varying degrees of influence and interest tends to complicate the process (Doak & Karadimitriou, 2007). REQUIREMENTS FOR THE OPERATIONAL INDICATOR SYSTEM
Given their specificities, having a clear idea of where UWRP are heading in terms of sustainability is crucial to build a solid foundation for their future (Hollander, Kirkwood, & Gold, 2010); particularly since most UWRP refer partially to sustainable development, generally in favor of environmental aspects (Franz, Pahlen, Nathanail, Okuniek, & Koj, 2006). These considerations call for the development of an operational indicator system tailored to the needs of UWRP in order to integrate sustainability into their design process. This objective is reflected in the following specifications: 1. Search for a global quality: The indicator system covers a relatively wide range of parameters to address the environmental, social and economic sustainability, equally and concurrently; 2. Appropriateness to UWRP: The indicator system meets the specificity inherent to UWRP. In particular, adaptation to the scale and complexity of the project and consideration of an already built-up site; 3. Inclusion of the principles of monitoring: The indicator system ensures an operational assessment, i.e. visualization of the various phases of the project and establishment of reference values in order to follow and act on performance trends. METHODOLOGY
The methodology used to establish the indicator system is based on three main steps, namely the determination of criteria, indicators and then reference values for each indicator. It is worth nothing that a test application was done in parallel with the construction of the indicator system, which helped to perform various practical settings and iterative improvements.
Identification of criteria
The first step is to determine a list of criteria that portrays the multidimensional aspects of UWRP in the context of sustainable development. In this sense, the list of criteria endeavors to give an equivalent importance to the three pillars of sustainability. It is based on the definition of fundamental objectives of sustainability and on operational considerations coming from practical experience of the test application. Given the requirements related to the project’s scale, the identification of criteria seeks to distinguish those that refer to the context of those that refer to the project. 1. Context criteria: concern aspects which are clearly beyond the physical boundaries of the site. Either the project has an impact in a wider sphere than that defined by the wasteland or external factors interact with the project; 2. Project criteria: involve aspects whose issues are within the boundaries of the site. These criteria relate to built-up and unbuilt areas. Identification of indicators
To assess the selected criteria, it is necessary to determine one (or more) indicator(s) that is a “value” that can be “measured” to indicate the degree of satisfaction with each criterion. It is essential to note that the notion of value is to be understood in its broadest sense: it can be both qualitative and quantitative, provided that it gives an explicit indication on the project. To ensure the legitimacy of the system, the selection of indicators is subject to a number of methodological rules and fundamental principles (Bossel, 1999). They stress that the indicator should be: 1. Exhaustive: together, represent proportionally and holistically the three dimensions inherent to the concept of sustainable development; 2. Relevant: synthetically reflect the performance of the project in relation to a given criterion; 3. Sensitive: respond significantly to variations of the parameter that is evaluated for both quantitative and qualitative indicators; 4. Objective: eliminate ambiguity. Requires a precise definition of the indicator and its evaluation method; 5. Accessible: depend on known values or known quantities and reflects the reality of the usual practice. Quantitative indicators must be easily calculated, qualitative indicators depend on a clear description; 6. Readable: ensure simplicity of interpretation, as it is intended to contribute to decision-making and to communication of the results to multidisciplinary stakeholders. Identification of reference values
Finally, reference values are defined for each indicator. These values may correspond to quantitative data, from overall performance encountered in professional practice, or qualitative characteristics, defined by a description of specific issues or concrete elements that are related. Aiming to include monitoring principles, a set of determined values is used for the measurement and follow-up on project performance. 1. 2. 3. 4.
Limit Value (VL): Minimum value required for any project (or veto value); Average Value (VA): Value corresponding to the usual practice, no particular performance; Target Value (VT): Value to target in order to achieve a greater performance; Best Practice Value (VB): Value corresponding to a particularly high performance.
RESULTS Operational indicator system - SIPRIUS
The selection and identification of criteria and indicators, followed by the definition of reference values, led to the creation of an operational indicator system. Entitled SIPRIUS, it is a catalog from which planners can choose indicators considered as significant for the monitoring of their UWRP. Depending on the specific characteristics of some projects, it is possible to add indicators to those already provided. SIPRIUS is composed of 9 criteria and 21 indicators relating to the context presented in Table 1 as well as 12 criteria and 21 indicators relating to the project presented in Table 2. Table 1. Summary List of Criteria and Indicators Related to Context Sustainability Criterion Criterion Indicator Indicator Pillar Code Title Code Title Mobility Environment C1 C1a Quality of service in public transport C1b Number of parking spaces C1c Tying status with soft mobility networks C2 Pollution C2a Average annual emission of NO2 C2b Acidification Potential (AP) C2c Global Warming Potential (GWP) Noise C3 C3a Average emission of noise - day C3b Average emission of noise - night Proximity of school Sociocultural C4 C4a Average distance to a nursery facilities C4b Average distance to kindergarten C4c Average distance to an elementary school C4d Average distance to a junior school C4e Average distance to a high school C5 Proximity of C5a Average distance to a commercial zone commercial facilities Proximity of C6 C6a Average distance to a public park recreational facilities C6b Average distance to a recreational greenspace/natural area C6c Average distance to a cultural center C6d Average distance to a sport center Population Economy C7 C7a Net population density Job C8 C8a Net employment density C9 Local Economy C9a Proportion of work by local companies
Table 2. Summary List of Criteria and Indicators Related to Project Sustainability Criterion Criterion Indicator Indicator Pillar Code Title Code Title Land P1a Land use coefficient Environment P1 P2 Energy P2a Non-renewable primary energy for construction, renovation and demolition of buildings P2b Non-renewable energy for buildings in operations P3 Water P3a Infiltration surfaces and stormwater management Biodiversity P4a Green surfaces P4 Well-being P5a Annual hours of overheating Sociocultural P5 P5b Interior noise level P5c Average daylight factor P5d Degree of electrosmog P5e Degree of individualization of housing
Economy
P6
Security
P7 P8
Heritage Diversity
P9
Direct costs
P10 P11 P12
Indirect costs External costs Flexibility
P5f P6a
Quality of outdoor spaces Degree of security
P7a P8a P8b P8c P9a P9b P10a P11a P12a
Degree of enhancement of heritage Degree of functional mix Potential of social diversity Degree of universal access Investment costs Gross rental yield Annual operating costs External costs Degree of flexibility of buildings
Each indicator is developed in a synthetic datasheet that includes all necessary informations to perform an assessment. As examples, the datasheet of two indicators assessing the environmental dimension of UWRP are illustrated in Table 3 and Table 4, respectively C1c - "Tying status with soft mobility network" and P1a - "Land use coefficient". In an attempt to be representative of the variety of assessment methods, one addresses the context and uses qualitative values while the second refers to the project with quantitative measurements. The reference values are assigned in this case relatively to the Swiss context since the test application was carried out on an ongoing project in this country.
Data source
Table 3. Datasheet of the indicator C1c C1c Tying status with soft mobility networks Intensity of connection to different networks for pedestrians and bicycles Analysis of the number and quality of the various links Qualitative scale (from 0 to 5) Level 2 (in 5) The project is characterized by a relatively weak consideration of soft mobility and has connections only in two distinct directions Level 3 (in 5) The project is characterized by a moderate consideration of soft mobility and has connections in three distinct directions Level 4 (in 5) The project provides an important consideration of soft mobility and has connections in three distinct directions Level 5 (in 5) The project includes a systematic consideration of soft mobility (many specific devices) and has connections in four distinct directions Plan and project guidelines
Indicator Definition Evaluation mode Measurement unit VL (Limit Value) VA (Average Value) VT (Target Value) VB (Best Practice Value) Data source
Table 4. Datasheet of the indicator P1a P1a Land use coefficient Ratio of gross floor area and the area of land Measurement of surfaces considered from the project plans. Quantitative scale 0.5 (Limit to ensure public transport offer) 1.0 1.5 2.0 (Density of central areas – Switzerland) Project plan and cadastral data of the land
Indicator Definition Evaluation mode Measurement unit VL (Limit Value)
VA (Average Value) VT (Target Value) VB (Best Practice Value)
Test application
The Ecoparc neighborhood consists in the regeneration of an urban wasteland of about 4 hectares located in Neuchâtel, Switzerland. The triggering of the regeneration process dates back to 1989; since then, Bauart Architects and Planners Ltd is in charge of developing the project. The latter involves the
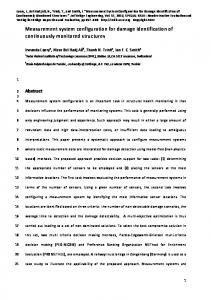
creation of a new dense urban center based on a mix of functions (housing, offices and educational buildings), combining new constructions with transformation of old industrial buildings. Ecoparc is committed to a sustainable development approach. The project represents the inherent complexity of this type of operation (multiple stages of development, many actors involved, etc.) (Rey, 2002). The status of Ecoparc at the time of the assessment is an intermediate stage typical of UWRP (Figure 1).
Figure 1. Site plan of Ecoparc at assessment. In black, buildings in operation. In yellow, buildings in execution phase. In orange, buildings in design phase. (Bauart document, 2005)
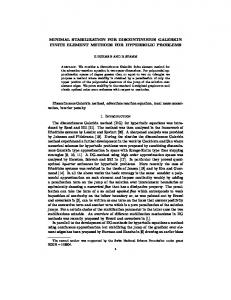
For the sake of complete verification, all indicators with available reference values were evaluated during the test application, including those that were not subject to particular attention. To integrate the results in the project dynamics - in accordance with the principles of monitoring - a bar chart histogram that follows the entire design process is used for each type of criteria. This paper exposes in Figure 2 and Figure 3 the results of the two indicators presented in Table 3 and 4. The project of Ecoparc includes a connection to pedestrian/bicycle networks in the four cardinal directions. In this sense, it tends to tie links that did not previously exist and increases the space reserved for pedestrian / bicycle along the main street. Expected final value corresponds to the target value VT.
Figure 2. Test-application: evaluation of indicator C1c (Tying status with soft mobility network).
Ecoparc is characterized by an “optimal density” that simultaneously combines a quantitative contribution to urban regeneration and creates a neighborhood that takes into account the qualitative characteristics of the site. The expected final situation is 2.11 slightly above the Best Practice value VB.
Figure 3. Test-application: evaluation of indicator P1a (Degree of flexibility of buildings).
VALIDATION OF THE INDICATOR SYSTEM
The test application has resulted in a real and iterative verification of the practical relevance of the methodology developed by SIPRIUS. It has proven that the indicator system is operational and can be used to assess both types of indicators. Table 5 shows the results for the expected final situation of Ecoparc. In general, the evaluation has confirmed that Ecoparc falls significantly in a sustainable development approach. Indeed, the vast majority of indicators provides an expected final situation that meets the objectives as shown in Table 5. In that sense, the indicator system has contributed to raise awareness about various aspects of sustainability within the project. Table 5. Test application: distributions of indicators based on the values obtained for the expected final situation in respect of the initial situation and the reference values. Status Context Project 19 19 Number of indicators evaluated Expected final situation greater than or equal to the 16 (84%) 19 (100%) objectives Expected final situation greater than or equal to VL 19 (100%) 19 (100%) Expected final situation greater than or equal to VA 17 (89%) 18 (95%) 13 (69%) 14 (74%) Expected final situation greater than or equal to VT 8 (42%) 2 (11%) Expected final situation greater than or equal to VB
In addition, the test application showed that SIPRIUS takes into account the requirements for a holistic evaluation of UWRP: it includes global quality and is adapted to the specificities of urban wastelands. Moreover, the graphical representation of the results helps to visualize the multiple phases of the project and the determination of reference values as “level of performance”. In this sense, it sets basis to project monitoring by aiming at a greater sustainability. These complementary aspects validate that a relevant operational indicator system can be developed to suit the needs of UWRP for an integration of sustainability issues in the design process. Toward an operational monitoring tool
To concretize sustainability targets, their integration into the project dynamics of urban wasteland regeneration and their continuous follow-up is an essential condition. The indicator system SIPRIUS contributes to this objective. It highlights the strengths and weaknesses of the project and feeds interactions amongst planners and decision makers. It also contributes to the transmission of results to audiences from various perspectives.
Nevertheless, its use depends primarily on the involvement and motivation of the stakeholders. Thus, the adaptation and transposition into a digital device in order to make a fully operational monitoring tool applicable to a multitude of regeneration projects would concretely facilitate the integration of sustainability in UWRP. Further work will be carried out in order to reach this objective, and will be the subject of future publications. CONCLUSION
Three successive stages - identification of criteria, indicators and reference values - led to the creation of the operational indicator system SIPRIUS. The creation of the indicator system was done in parallel to the completion of a comprehensive test application. SIPRIUS meets the requirements of a search of global quality, is adapted to the specificities of UWRP and includes monitoring principles. The test application demonstrates that the indicator system is operational and contributes to integrate sustainability into the design process of the project. A transposition toward a digital monitoring tool in order to facilitate evaluation of diverse UWRP is suggested. Research is moving in this direction. ACKNOWLEDGMENTS
We would like to acknowledge financial support from Swiss National Science Foundation within the framework of Project No 100013_143376. REFERENCES
Andres, L., and Bochet, B. 2010. Regenerating brownfields and promoting sustainable development in France and in Switzerland: what convergences? Revue d’Economie Régionale & Urbaine, (4): 729– 746. Bossel, H. 1999. Indicators for Sustainable Development: Theory, Method, Applications (A report to the Balaton Group). Winnipeg, Canada: IISD International Institute for Sustainable Development. Retrieved from http://www.ulb.ac.be/ceese/STAFF/Tom/bossel.pdf CABERNET. 2006. Sustainable Brownfield Regeneration: CABERNET Network Report. University of Nottingham. Doak, J., and Karadimitriou, N. 2007. Actor Networks: The Brownfield Merry-Go-Round. In T. Dixon, M. Raco, P. Catney, & D. N. Lerner (Eds.), Sustainable brownfield regeneration : liveable places from problem spaces. Oxford: Blackwell: pp. 67–88 Franz, M., Pahlen, G., Nathanail, P., Okuniek, N., and Koj, A. 2006. Sustainable development and brownfield regeneration. What defines the quality of derelict land recycling? Environmental Sciences, 3(2): 135–151. Hollander, J. B., Kirkwood, N., and Gold, J. L. 2010. Principles of brownfield regeneration : cleanup, design, and reuse of derelict land. Washington: Island Press. Jenks, M. 1998. The compact city: a sustainable urban form? [Reprinted]. London etc: Spon. OFEN, O. fédéral de l’énergie. 2013. Réhabiliter des friches industrielles pour réaliser la société à 2000 Watts. Pediaditi, K. E., Wehrmeyer, W., and Chenoweth, J. 2005. Monitoring the Sustainability of Brownfield Redevelopment Projects The Redevelopment Assessment Framework (RAF). Contaminated Land & Reclamation, 13(2): 173–183. Rey, E. 2002. The Ecoparc project in Neuchâtel : sustainable regeneration of an urban wasteland (pp. 963–966). Presented at the Proceedings of PLEA 2002, Toulouse: PLEA - Passive and Low Energy Architecture. Rey, E. 2007. Des friches urbaines aux quartiers durables. Tracés, (12): 13–15. Rey, E. 2012. Régénération des friches urbaines et développement durable : vers une évaluation intégrée à la dynamique du projet. Louvain-La-Neuve: Presses Universitaires de Louvain. Rogers, R. G., and Gumuchdjian, P. 1998. Cities for a small planet (Icon Editions.). Boulder, Colo.: Westview. Wedding, G. C., and Crawford-Brown, D. 2007. Measuring site-level success in brownfield redevelopments: A focus on sustainability and green building. Journal of Environmental Management, 85(2): 483–495. Williams, K., and Dair, C. 2007. A framework for assessing the sustainability of brownfield developments. Journal of Environmental Planning and Management, 50(1): 23–40.