Open Journal of Applied Sciences, 2013, 3, 56-61 doi:10.4236/ojapps.2013.31009 Published Online March 2013 (http://www.scirp.org/journal/ojapps)
An Optimal Control Problem for Hypoxemic Hypoxia Tissue-Blood Carbon Dioxide Exchange during Physical Activity Jean Marie Ntaganda1*, Benjamin Mampassi2
1 National University of Rwanda, Butare, Rwanda Department of Mathematics and Computer Science, Dakar University, Dakar, Senegal Email: *
[email protected],
2
Received November 2, 2012; revised December 3, 2012; accepted December 10, 2012
ABSTRACT This paper aims at solving an optimal control problem for determining the response of hypoxia to heart rate and alveolar ventilation that are cardiovascular and respiratory control respectively during a physical activity. A two nonlinear coupled ordinary differential equations is presented. The cost function of optimal control problem is discretized using the linear B-splines functions defined on a regular grid. The results show the determinant parameters stabilized at normal value. Keywords: Arterial Oxygen Pressure; Arterial Dioxide Pressure; Cardiovascular/Respiratory System; Optimal Control Problem; Numerical Simulation
1. Introduction Hypoxia, or hypoxiation, is defined as a pathological condition related to adequate oxygen supply in human body. It is in two main types: the generalized hypoxia that is characterized by the deprived adequate oxygen supply in whole body and tissue hypoxia which happens in its region. It differs from hypoxemia called also hypoxaemia in that within the arterial blood the oxygen concentration is abnormally low. Hypoxemia was originally defined as a deficiency of oxygen in arterial blood but standard manuals take this to mean an abnormally low partial pressure of oxygen, content of oxygen or percent saturation of hemoglobin with oxygen, either found singly or in combination. The serious cases of the hypoxemia happen when the decreased partial pressure of oxygen in blood is less than 60 mmHg. In addition, the generalized hypoxia occurs in healthy people when they ascend to high altitude, where it causes altitude sickness leading to point constitutes the beginning of the steep portion of the hemoglobin dissociation curve, where a small decrease in the partial pressure of oxygen results in a large decrease in the oxygen content of the blood or when hemoglobin oxygen saturation is less than 90%. The reason of this is this potentially fatal complications including high altitude pulmonary edema (HAPE) and high altitude cerebral edema (HACE) [1]. It also occurs in healthy individuals when breathing mixtures of *
Corresponding author.
Copyright © 2013 SciRes.
gases with low oxygen content. Hypoxic hypoxia is a result of insufficient oxygen available to the lungs. The examples of how lungs can be deprived of oxygen are a blocked airway, a drowning or a reduction in partial pressure (high altitude above 10,000 feet). Hypoxia is also a serious consequence of pre-term birth in the neonate. The main cause for this is that the lungs of the human fetus are among the last organs to develop during pregnancy. To assist the lungs to distribute oxygenated blood throughout the body, infants at risk of hypoxia are often placed inside an incubator capable of providing continuous positive airway pressure (also known as a humidicrib). The insufficient delivery of oxygen (low PaO2 ) or inability to utilize oxygen (normal PaO2 ) causes also the hypoxia where we assist to oxygen deficiency at the mitochondrial sites. This phenomeno accurs when PaO2 less than 7.3 kPa (55 mmHg). Below this threshold the ventilation starts to stimulate carotid body activity. The hyperventilation reduces PaCO2 and H , which limits the initial rise in ventilation, because it decreases the carotid body and central chemoreceptor stimuli. In fact, in humans, hypoxia is detected by chemoreceptors in the carotid body. This response does not control ventilation rate at normal PaCO2 , but below normal the activity of neurons innervating these receptors increases dramatically, so much so to override the signals from central chemoreceptors in the hypothalamus, increasing PaO2 despite a OJAppS
J. M. NTAGANDA, B. MAMPASSI
falling PaCO2 . Any physical activity obviously causes the body to demand more oxygen for normal functioning. The muscles rob the brain of the marginal amounts of oxygen available in the blood and the time of onset of hypoxic symptoms is shortened. However, the improvement of performance of athlete in high altitude results in a mild and non-damaging intermittent hypoxia used intentionally during training to develop an athletic performance adaptation at both the systemic and cellular level. Mathematical models quantifying hypoxic hypoxia have been proposed [2-4]. The optimal control problem based on the responses of cardiovascular respiratory system parameters to its controls, heart rate and alveolar ventilation, during physical activity has not been considered in the situation of hypoxic hypoxia. This work focuses on this issue where the mathematical model is modified to include the controls of cardiovascular respiratory system. The remainder of this paper is structured as follows. In Section 2, we present a mathematical model, an optimal control problem and its descretization. The results of numerical simulation are discussed in Section 3. In Section 4 deals with concluding remarks.
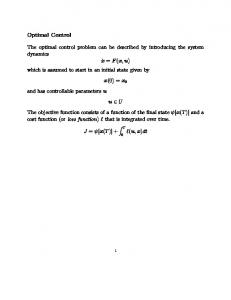
2. Setting of an Optimal Control Problem The model we present in this paper involves modifying of model equations as developed by Guillermo Gutierrez [2] in order to include the role of physical activity. The diagram for a two compartmental model is illustrated in the Figure 1 where mass transport model of tissue CO2 exchange is developed to examine the relative contributions of blood flow and cellular hypoxia (dysoxia) to increases in tissue and venous blood CO2 concentration.
57
From this compartmental diagram the model equations are as follows. d CO 2 t dt d CO 2 v dt
VCO 2 Kv CO 2 t CO 2 v
(1)
Q CO 2 a CO2 v Kv CO 2 t
(2)
The integral role of physical activity results in the influence of the demand of the tissues for oxygen during hypoxia in altitude. Just as resting ventilation increases dramatically at high altitude, so does ventilation during physical activity. In fact, at moderate levels of physical activity, there is little or no change in arterial PaCO2 between rest and exercise. Since carbon dioxide production for a given work level is essentially independent of altitude, this means that measured ventilation is independent of altitude at a given work level. At work levels approaching maximal values at any altitude, alveolar and arterial PaCO2 fall compared with the resting level and physical activity ventilation measured at correspondingly rises. Furthermore, during exercise, increases in alveolar ventilation must parallel the increased tissue oxygen consumption and carbon dioxide production by the exercising muscles, both of which rise in direct proportion to the increase in power output. These relationships are governed by the following equation
PaCO2
VCO 2 K V A
where VA is alveolar ventilation and K denotes a constant [5], so that we have
CO2 a KCO 2 PaCO2 kCO 2
VCO 2
KCO 2 PaCO2 kCO 2 TISSUE COMPARTMENT [CO2]t Kv Q
[CO2]a
VASCULAR COMPARTMENT [CO2]v
Q
2
[CO2]v
Figure 1. Diagram for the tissue carbon dioxide (CO2) exchange model where [CO2] represents the total CO2 concentration (dissolved and bound) and the subscripts t and v denote the tissue and vascular compartments respectively. Kv is the mass transfer coefficient for CO2. For the vascular compartment, the rate of change of [CO2] v depends on blood flow per unit volume of tissue Q VCO 2 denotes car-
bon dioxide production. Copyright © 2013 SciRes.
where K CO2 the slope of the physiological CO 2 dissociation curve and K CO2 constant for the physiological CO 2 dissociation curve [6]. Taking RQ as respiratory exchange ration and VO2 as consummation rate of O2, the relationship between VO2 and VCO 2 satisfies the following relation [2]. VCO RQ VO . (3) 2
Using Fick’s principle [2] applied to the relation (3) allows to get
VCO 2 RQ H SV O 2 a O 2 v ,
where O2 a (resp. O2 a ) is arterial (venous) concentration of O2 , H denotes heart rate and Sv represents stroke volume. In addition, it is known that the human respiratory OJAppS
J. M. NTAGANDA, B. MAMPASSI
58
control system varies the ventilation rate VA in response to the levels of CO 2 and O2 in the body and the control mechanisms of cardiovascular system influences global control in the blood vessels as well as well as heart rate H for impacting blood flow Q [7]. Generally, during physical activity in altitude and particular in the hypoxia case, the control mechanism of these two systems plays a crucial role. Finally, we are interested in the following model equations d CO 2 t dt
RQ H SV O 2 a O 2 v Kv CO 2 t
(4)
d CO 2 v dt VCO Q K CO2 2 K kCO2 VA
Kv CO 2 t CO 2 v
CO 2 v
(5)
B
where two last ordinary differential equations describe the control of cardiovascular and respiratory system is described respectively with u t and v t the functions to be determined by an optimality criterion. The alveolar gas equation allows the calculation of the alveolar partial pressure of oxygen as follows [8]
PaCO2 1 FIO2 1 RQ
RQ
where PAO2 is the alveolar partial pressure of oxygen, PATM denotes the prevailing atmospheric pressure, PHO2 represents the saturated vapor pressure of water at body temperature and the prevailing atmospheric pressure and FIO2 is the fraction of inspired gas that is oxygen (expressed as a decimal). In addition, the relation between alveolar partial and arterial pressure of oxygen is given by
J u, v
qH H t qV
P A a O 2 10 mmHg.
Similarly, blood PaCO2 is calculated on the basis of the Henderson-Hasselbach equation [9] as follows. Copyright © 2013 SciRes.
2
qO2 PaO2 P f aO2
AVA t
2
(8)
2
subject to the systems (4 )-(7). In the relation (8), the positive scalar coefficients qCO2 , qO2 , qu and qv determine how much weight is attached to each cost component term in the integrand while Ts denotes the maximum time that the physical activity can take. Let us consider E N the vector space that is span of
B N Nj , j 1, , N
(9)
a base of linear B-splines functions on a regular grid kT N tk s , k 0, , N N
(10)
The functions Nj , j 1, , N verify the following relation Nj tk ik where denotes Kronecker symbol. The descretization of the optimal problem (8) is done by setting the state vector
x PaCO2 , PaO2
T
,
and the desired final vector
PaO2 PAO2 10
because the PAO2 to PaO2 gradient is normally close to and is written as follows:
It results that the alveolar carbon dioxide pressure of oxygen PACO2 is equivalent to PaCO2 (there is no gradient). Furthermore, it appears that a main goal of respiratory control is to keep CO 2 venous partial pressure as close as possible to an equilibrium value denoted by P f aCO 2 and, to a lesser extent, control P f vO2 to the equilibrium such that the cost functional can be formulated in the following way. Find H t and VA t solution of
2
(7)
,
CO2 v 2.244 0.422 SaO2 8.74 . 2.244 0.422 SaO2 8.74 pH
0
dVA v t , dt
0.06868 10
1.04214pH 6.41036
where B is CO 2 content of plasma defined by Douglas [10] as
T2
(6)
B
qCO2 PaCO2 P f aCO2
dH u t dt
PAO2 FIO2 PATM PHO2
PaCO2
x f P f aCO2 , P f aO2
T
such that it can be written as follows. min min J N Q Q
T2 2 ki xiN t xif 0 i 1
2
q t 2
j 1
j
j
2
dt ,
(11)
OJAppS
J. M. NTAGANDA, B. MAMPASSI
where
Table 1. Values of parameters used in numerical simulation.
H , VA , T
k qCO2 , qO2
T
and q qH , qVA
T
with xi , xi , i , ki and qi respectively the i component of the vectors x, x f , , k and q . We are looking for M 1M , 2M Q M a approxif
th
mated solution of (11) in the set Q M E M
M j
M
2
such that
k t , j 1, 2. k 0
(12)
M j ,k
Therefore the cost function (11) becomes J
N
M
2 ki xiN tk xie k 1 i 1 2 2 q j jM, k t , j 1
M
2
(13)
Ts and finally the discrete formulation of N optimal problem (8) subject to (4)-(7) is written as follows min
t Y T RY M
T
JN M
B M ,
(14)
where M is a matrix M M 1 2 such that the components jM, k are components of the function jN in th the set B N and Y represents the matrix with i, k component is
xiN tk xif
T
where x N x1N , x2N denotes the solution of the systems (4)-(5) associated to N , R and B are matrix defined by k 0 q1 R 1 , B 0 k 2 0
0 q2
(15)
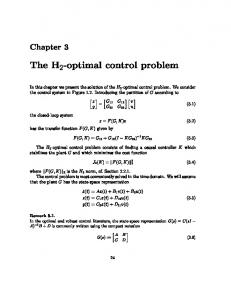
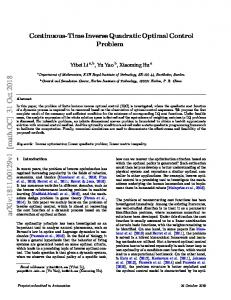
3. Test Results For solving the optimal control problem (13) subject to the constraints (4)-(7) we consider the parameters presented in the Table 1. We take P f aCO2 and P f aO2 as normal value for a healthy individual that P f aCO2 40 mmHg and P f aO2 = 95 mmHg. The variation curve of carbon dioxide in the tissues and carbon dioxide in vascular is illustrated in the Figure 2. The control of cardiovascular and respiratory systems, H and VA against the time are given in the Figure 3 whereas the Figure 4 shows the responses of these controls. Copyright © 2013 SciRes.
Value
Parameter
Value
Q
6
PHO
47
Kv
0.05
RQ
0.8
PH
7.35
SV
0.7
SaO 2
0.98
K
863
VCO 2
0.21
K CO
PATM
760
kCO
FIO
2
0.21
2
10
O O
15
qv
qO
with Δt
M M 1 M 1 M M 1 M 1
Parameter
qCO
min
59
2
qu
2
2
0.0065
2
0.244
2 a
0.197
2 v
0.147 100
100
The Figure 2 shows a decrease of arterial and venous dioxide carbon concentration against the time. They are maintained at a level where the variation is small. This is due to the effect of ventilation during physical activity. In fact, ventilation increases abruptly in the initial stages of exercise and is then followed by a more gradual increase. This mechanism of increase results of to motor centre activity and afferent impulses from proprioceptors of the limbs, joints and muscles. Since peripheral chemoreceptors are responsible for increasing ventilation, Central chemoreceptors may be readjusted to increase ventilation to maintain carbon dioxide concentrations. At the onset of physical activity, the heart rate and alveolar ventilation increase. Generally, heart rate increases to about 90% of its maximum values during strenuous physical activity. Furthermore, the ventilation increases with increases in work rate at submaximal physical activity intensities. These physiological effects of physical activity on cardiovascular-respiratory system are justified by the variation of its controls in the Figure 3 where they reach a value and they are stabilized with small oscillations. The Figure 4 shows the arterial carbon dioxide (resp. oxygen) decreases (increases) at the onset of physical activity to be stabilized at normal value. The changes which occur in PaO2 and PaCO2 values during exercise are usually small. But since hypoxia is characterized by the adequate oxygen supply deprived in whole (generalized hypoxia) or a region of the body (tissue hypoxia) the ventilation process during physical activity plays an integral role. During physical activity, when sufficient oxygen for flux through the is not available, the increased reliance on glycolysis results in increased accumulation of lactic acid, which initially leads to an increase in PaCO2 . However, this is counteracted by the stimulation of ventilation and as a result PaCO2 is decreased. In addition, in OJAppS
J. M. NTAGANDA, B. MAMPASSI
60
(a)
(b)
Figure 2. Variation of arterial (a) and (b) carbon dioxide.
(a)
(b)
Figure 3. Variation of heart rate (a) and alveolar ventilation (b).
(a)
(b)
Figure 4. Variation of optimal parameters: Arterial carbon dioxide pressure (a) and arterial oxygen pressure (b). Copyright © 2013 SciRes.
OJAppS
J. M. NTAGANDA, B. MAMPASSI
humans, hypoxia is detected by chemoreceptor in the carotid body. This response does not control ventilation rate at normal PaO2 , but below normal the activity of neurons innervating these receptors increases dramatically, so much so to override the signals from central chemoreceptors in the hypothalamus, increasing PaO2 despite a falling PaCO2 .
4. Conclusion In this work we have investigated a role of controls of cardiovascular-respiratory system during physical activity to hypoxia. The heart rate and both minute ventilation and alveolar ventilation increase; in this way the lungs transfer more oxygen and carbon dioxide and keep pace with metabolic demands. In this increase of the controls result the increase of arterial and vascular carbon dioxide. In addition, the partial arterial pressure of carbon dioxide and oxygen are maintained at normal value.
REFERENCES [1]
[2]
[3]
A. Cymerman and P. B. Rock, “Medical Problems in High Mountain Environments,” A Handbook for Medical Officers, USARIEM-TN94-2, US Army Research Institute of Environmental Medicine Thermal and Mountain Medicine Division Technical Report, 2009. G. Gutierrez, “A Mathematical Model of Tissue-Blood Carbon Dioxide Exchange during Hypoxia,” American Journal of Respiratory Critical Care Medecine, Vol. 169. No. 4, 2004, pp. 525-533. doi:10.1164/rccm.200305-702OC
61
Cell-Cycle: Molecular Antagonism, Hysteresis, and Irreversible Transitions,” Journal of Theoretical Biology, Vol. 210, No. 2, 2001, pp. 249-263. doi:10.1006/jtbi.2001.2293 [4]
D. Gammack, H. M. Byrne and C. E. Lewis, “Estimating the Selective Advantage of Mutant p53 Tumour Cells to Repeated Rounds of Hypoxia,” Bulletin of Mathematical Biology, Vol. 63, No. 1, 2001, pp. 135-166. doi:10.1006/bulm.2000.0210
[5]
J. A. Dempsey, H. V. Forster and D. M. Ainsworth, “Regulation of Hyperpnea, Hyperventilation, and Respiratory Muscle Recruitment during Exercise,” In: J. A. Dempsey and A. I. Pack, Eds., Regulation of Breathing, Marcel Dekker, New York, 1995, pp. 1065-1133.
[6]
S. Timischl, “A Global Model for the Cardiovascular and Respiratory System,” PhD Thesis, Karl Franzens Universit of Graz, 1998.
[7]
S. Timischl, J. J. Batzel and F. Kappel, “Modeling the Human Cardiovascular Respiratory Control System: An Optimal Control Application to the Transition to NonREM Sleep,” Spezialforschungsbereich F-003 Technical Report 190, Karl Franzens Universitat, 2000.
[8]
D. Curran-Everett, “A Classic Learning Opportunity from Fenn, Rahn, and Otis (1946): The Alveolar Gas Equation,” Advances in Physiology Education, Vol. 30, No. 2, 2006, pp. 58-62. doi:10.1152/advan.00076.2005
[9]
I. Giovannini, C. Chiarla, G. Boldrini and M. Castagneto, “Calculation of Venoarterial CO2 Concentration Difference,” Journal of Applied Physiology, Vol. 74, No. 2, 1993, pp. 959-964.
[10] A. R. Douglas, N. L Jones and J. W. Reed, “Calculation of Whole Blood CO2 Content,” Journal of Applied Physiology, Vol. 65, No. 1, 1988, pp. 473-477.
J. J. Tyson and B. Novak, “Regulation of the Eukariotic
Copyright © 2013 SciRes.
OJAppS