AN OPTIMIZED BATTERY CHARGING SYSTEM BASED ON A MODIFIED MPPT STRATEGY FOR ISOLATED PV ENERGY GENERATION João Victor M. Caracas1, Guilherme de C. Farias2, José G. de Matos2, Luiz Antonio de S. Ribeiro2 1
Enova Energia, São Luis – MA, Brazil Instituto de Energia Elétrica/Universidade Federal do Maranhão, São Luis – MA, Brazil e-mail:
[email protected],
[email protected],
[email protected],
[email protected] 2
Abstract – This paper describes the development of a high power battery charging system optimized for photovoltaic (PV) isolated microgrids. The charger implements a modified Maximum Power Point Tracking (MPPT) strategy that is suitable for isolated photovoltaic applications with battery storage systems (BSS). The proposed strategy is able to extract maximum power when possible and controls the power delivered to the BSS in order to supply the maximum possible energy without overcharging the batteries, enabling the operation with other current sources battery chargers. The proposed system is first simulated in the MATLAB/Simulink environment and then implemented in a 35kW charge controller, based on ten paralleled buck converters, connected to a 120V 600Ah OPZv BSS. The system hardware is designed to be very reliable and to be operated at extreme ambient conditions. Keywords – Battery charging, Photovoltaic, MPPT, Hill-climbing, Isolated microgrids. NOMENCLATURE VPV IPV PPV VBAT IBAT PBAT VPV* ΔVPV ΔPPV δ+ δδ+HVR δ- HVR δ+ NVR δ- NVR δ+ LVR δ- LVR δPL
PV string voltage. PV string current. PV string instantaneous power. Battery storage system voltage. Battery storage system current. Battery storage system instantaneous power. PV string voltage MPPT reference. PV string voltage variation. PV string instantaneous power variation. MPPT strategy positive step. MPPT strategy negative step. MPPT strategy High Voltage Region positive step. MPPT strategy High Voltage Region negative step. MPPT strategy Normal Voltage Region positive step. MPPT strategy Normal Voltage Region negative step. MPPT strategy Low Voltage Region positive step. MPPT strategy Low Voltage Region negative step. MPPT strategy Power Limitation step.
978-1-4799-8779-5/15/$31.00 ©2015 IEEE
I. INTRODUCTION As the use of fossil fuels becomes more costly with time and the environmental agenda grows strong, allied to the incoming paradigm shift of high losses centralized power generation to efficient distributed generation and smart grid control [1], isolated renewable power generating systems importance increases and it is becoming more viable with time. Added to that, the ever-increasing need for electricity is spreading beyond the capabilities of the conventional grid. This is the case of small remote communities located far from the electrical grid. Renewable isolated generation systems are also presented as a cost effective solution for these cases [2]. For isolated systems to work in a stable manner, it is necessary a reliable and dispatchable form of power source – as small-scale renewable generation is intermittent [3]. Normally, battery storage systems are used as this power source. However, batteries are complex electrochemical systems and are electrically fragile when it comes to over and under voltage operation, as well as over current operation, especially when they are charged with a variable power source, like solar panels [4]. It is common the use of charge controllers to maintain the voltage and current levels of the batteries in acceptable values [5]. Hence, these are key components in isolated systems. This paper presents a modified MPPT strategy that enables the extraction of maximum power from the PV source, while the voltage or current of the BSS is under defined thresholds, and controls the power produced by the PV panels when voltage or current limitation is necessary. The objective of this strategy is to seamlessly transit between MPPT operation and voltage or current regulation, taking into account the possible existence of other sources of any kind feeding current into the BSS, without affecting the stable operation of the system. The paper is organized as follows: section II presents the modified MPPT strategy; section III describes the hardware used to implement the modified MPPT strategy; section IV shows the results obtained through simulations and the experimental prototype; and section V presents the conclusions of this research and development work. II. MODIFIED MPPT STRATEGY
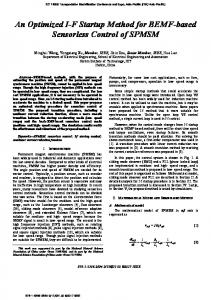
The modified MPPT strategy is based on a Hill-Climbing algorithm, as presented in [6]. This strategy was chosen as a base to the proposed strategy due to the simplicity of implementation, driving the converter duty cycle directly from the PV voltage reference instead of tightly controlling the PV voltage. Since the dynamics of the BSS are slow, it is possible to achieve stable operation in this manner. This strategy also minimizes the use of feedback sensors, as the current state of the converter is not controlled, simplifying the system and reducing its costs. Two modifications were introduced to the classic strategy. Firstly, the range of operation is divided in three distinct regions to increase the tracking speed and avoid stray behavior of the algorithm; secondly, two modes of operation are implemented: one executing the Hill-Climbing algorithm and another executing the power limiting subroutine based on the BSS voltage and current information. A. Regions of Operation The three regions of operation are defined as Low Voltage Region (LVR), Normal Voltage Region (NVR) and High Voltage Region (HVR). The PV string MPP rated voltage and its variation, considering the temperature effect, defines the boundaries between the regions of operation. Their objective is to enforce the MPPT operation in the central region, as shown in Fig. 1. The Hill-Climbing algorithm is based on a voltage step used to disturb the PV string operating point by altering the converter duty cycle and, based on the power variation, the direction of the next step is changed or not [6].
Current (A)
VLOW
VHIGH
Low Voltage Region
Normal Voltage Region
High Voltage Region
δ+ > δ-
δ+ = δ-
δ+ < δ-
Voltage (V) Fig. 1. MPPT strategy regions of operation based on a PV module IxV curve.
In the region located at the lowest voltage levels, the step in the direction of increasing voltage is bigger than in the other direction, which inserts a tendency of increasing the voltage of the PV string. On the other hand, in the region located at the highest voltage levels, the step in the direction of decreasing voltage is bigger, inserting a tendency of decreasing the PV string voltage. In the central voltage region, the steps in both directions are equal, allowing the Hill-Climbing algorithm to operate normally on the region where the maximum power point is located. Fig. 2 details the flowchart of the decision process for the step sizes.
Begin Calculate δ+ and δ-
VPV > VHIGH?
NO
YES
YES
VPV < VLOW?
NO δ+ = δ+LVR δ- = δ-LVR
δ+ = δ+NVR δ- = δ-NVR
δ+ = δ+HVR δ- = δ-HVR
End Calculate δ+ and δFig. 2. Flowchart for the step size decision process.
B. Modes of Operation The first mode of operation functions as described in the previous subsection, extracting the maximum power available to charge the BSS. When the voltage or current value reaches the predefined limit – fluctuation setpoint or over current setpoint – the MPPT strategy enters the powerlimiting mode. It is important to mention that the current feedback used to regulate the current limit is the current flowing into the battery. This allows the system to account for loads connected to the system, which subtracts from the current delivered, and other sources feeding the battery, which adds current injected into the battery. The power limiting mode increases the reference voltage of the PV string in a stepped manner, as the MPPT, to reduce the power extracted from the PV source and control the output levels of the charge controller in the setpoints mentioned. As the battery storage systems dynamics are very slow, compared to that of the PV string, the power limiting subroutine voltage step is smaller compared to the MPPT one. Fig. 3 depicts the complete flowchart of the modified MPPT strategy. The flowchart is executed as follows: the measurements of the voltages and currents of the PV string and the BSS are made; then, the BSS voltage and current are assessed to verify the operating condition. If any of the two values is bigger than the reference, the system enters power limiting mode increasing the reference PV voltage (YES path); if they are smaller than the reference values (NO path), the system operates in MPPT, calculating the steps as described in Fig. 2, and following the same flow as the HillClimbing algorithm after that.
Begin MPPT
Read VPV, IPV, VBAT and IBAT
VBAT > VBAT*? or IBAT > IBAT*?
YES
NO Calculate δ+ and δ-
PPV(k) = VPV(k)*IPV(k)
ΔPPV = PPV(k) - PPV(k – 1) ΔVPV = VPV(k) - VPV(k – 1)
NO NO
ΔVPV > 0?
VPV*(k) = VPV*(k - 1) + δ+
ΔPPV > 0?
VPV*(k) = VPV*(k - 1) + δPL
YES ΔVPV > 0?
YES
NO
VPV*(k) = VPV*(k - 1) - δ-
VPV*(k) = VPV*(k - 1) - δ-
YES
VPV*(k) = VPV*(k - 1) + δ+
End MPPT
Fig. 3. Flowchart of the modified MPPT strategy. BUCK 1
III. SYSTEM DESIGN AND IMPLEMENTATION The strategy presented in this paper is implemented in a 35kW charge controller designed with ten independent buck converters working in parallel to increase global generation by augmenting the number of individual MPPT controllers and individually optimizing up to 10 different panel strings. Fig. 4 depicts the topology configuration. Since isolated systems are often operated in remote regions without easy access and presence of specialized labor, increased reliability and autonomous operation are of great importance. The charge controller hardware was designed to withstand operation in hard conditions, like coastal areas with high salinity. Therefore, the charge controller hardware was designed with a closed case without forced cooling system.
978-1-4799-8779-5/15/$31.00 ©2015 IEEE
PV1 BUCK 2 PV2
BSS . . .
PV10 BUCK 10
Fig. 4. Charge controller topology.
L O A D
power. The value obtained is well within the security constraints for the battery voltage. 136
V BAT (V)
The use of independent converters in parallel was also implemented to increase the reliability, as a fail in one converter does not affect the operation of the system as a whole. Furthermore, all the Printed Circuit Boards (PCBs) received a special treatment against severe corrosion. The control of the converters, system level control, battery monitoring and supervisory system is executed in a central Digital Signal Processor (DSP). Fig. 5 presents the assembled prototype.
134 132 130
0
5
10
15
20
25
30
0
5
10
15
20
25
30
0
5
10
15
20
25
30
IBAT (A)
260 240 220 200 180
P BAT (kW)
40
20
0
Time (s)
Fig. 6. Simulation results. In the first graphic, the dotted line represents the battery voltage setpoint.
Fig. 5. Assembled prototype.
IV. SIMULATION AND EXPERIMENTAL RESULTS The modified MPPT method was simulated using the MATLAB/Simulink environment. The simulation was based on the ten parallel buck converters operating with a string of fourteen 250W solar panels each. The total input peak rated power is 35kW. The temperature of the panels was set to 25ºC and the irradiation level to 1kW/m² for the entire simulation. The buck converters were simulated using their linear model. The battery model was based on a 120V/2400Ah Lead-Acid BSS, since this is the size of the BSS of the final application. Fig. 6 presents the results of the simulation. From the beginning of the simulation until 18s, the modified MPPT algorithm was operating at the maximum power point. After the 18s mark, the battery voltage reached the configured fluctuation voltage, and the algorithm entered the power-limiting mode, effectively maintaining the battery voltage at 134V. Note that the battery current is slightly decreasing while its voltage is increasing, maintaining the power supplied constant at the maximum possible extracted from the panels. Fig. 7 details the period right after the voltage surpasses the fluctuation voltage setpoint. The battery voltage peaks at 134.03V, which represent an overshoot of slightly over 0.02%. This overshoot occurs due to the incremental nature of the power limiting strategy. The worst-case scenario is when reducing from rated output power to almost zero output
Fig. 7. Closer look on the battery voltage overshoot.
Along with the functionality simulation, a comparison with the classic Hill-Climbing method [6] was performed via simulation. The insolation pattern used is presented in Fig. 8. The pattern is comprised by a descending ramp from 1s to 5s, followed by an ascending ramp from 5s to 7.5s, a large negative step at 10s and a series of positive steps happening each 5s.
Fig. 8. Insolation pattern used in the MPPT strategy comparison.
The instantaneous power obtained through the simulation was integrated to obtain the total energy supplied to the
battery. The results of the comparison are described in Table I. TABLE I Comparison Between the Proposed MPPT Strategy and the Classic P&O MPPT Strategy Classic Hill-Climbing Proposed Method
MPPT Method
194.0685
Extracted Energy (kWh)
195.0685
From the results obtained, the proposed strategy extracted 0.5753% more energy for this simulation scenario. This happens because of the startup of the system. When the system is operating on the far right of the curve presented in Fig. 1, the proposed strategy approaches the MPP voltage faster, thus extracting more energy in the same period. The experimental testbench was assembled using six strings of seven 250W panels, a total input rated peak power of 10.5kW, and a 120V/600Ah OPZv BSS, since those were the materials available in the laboratory testbench. A 4kW resistive load was connected in parallel with the BSS to emulate the load on the real system. Fig. 9 depicts the results obtained with the assembled prototype. The dotted lines represent the voltages measured, while the solid lines represent the currents. 20
10 100
V BAT (V)
0
5
0
5
10
15
20
25
30
35
40
45
0
135
40
130
20
125
IPV (A)
15
200
0
5
10
15
20
25
30
35
40
45
IBAT (A)
VPV (V)
300
0
Time (s)
Fig. 9. Curves obtained from the experimental setup. Dotted lines are voltages, while solid lines are currents.
The experimental results present a similar behavior as the one obtained via simulation, in Fig. 5. Initially the system is extracting the maximum power possible. This can be affirmed through the almost constant PV voltage and varying PV current with the insolation. When the battery voltage reaches the setpoint, around 18s, the extracted power is decreased to regulate the battery voltage. Up until around 26s, the varying insolation forces the system to transit between MPPT and power limiting mode. After 26s, the insolation is sufficient for the system to be maintained in power limiting operation. Thus, the correct execution of the designed functionalities is obtained, validating the strategy.
Fig. 10. Equipment applied to the Lençóis Island isolated system described in [2].
Once finished, the equipment was applied to substitute the previous charge controller on the Lençóis Island isolated system described in [2], as shown in Fig. 10. It is now operating with 21kW rated PV input power charging a 240V/1200Ah BSS along with three 7.5kW wind turbines. IV. CONCLUSIONS The modified MPPT strategy presented in this paper is able to safely maintain the operational levels on the BSS, controlling the fluctuation voltage and limiting the current flowing to it. Although the proposed strategy is able to extract more energy compared to the classic Hill-Climbing approach, the main contribution is the ability of seamlessly change the mode of operation from MPPT to power limiting using a simple approach and without affecting the stability of the system. The experimental setup enforces that the system operates in a stable manner and the functionality obtained via simulation is confirmed in practice. After the development, the equipment was applied to the Lençóis Island isolated system, where it is currently operating. This system is used to supply energy to over 100 families. ACKNOLEDGEMENTS The authors would like to thanks the motivation and financial support provided by CNPq/Brazil and CEMAR. REFERENCES [1] Puttgen, Hans B.; MacGregor, P.R.; Lambert, F.C., "Distributed generation: Semantic hype or the dawn of a new era?," Power and Energy Magazine, IEEE , vol.1, no.1, pp.22,29, Jan-Feb 2003.
[2] de Souza Ribeiro, L.A.; Saavedra, O.R.; de Lima, S.L.; Gomes de Matos, J., "Isolated Micro-Grids With Renewable Hybrid Generation: The Case of Lençóis Island," in Sustainable Energy, IEEE Transactions on , vol.2, no.1, pp.1-11, Jan. 2011. [3] Billinton, R.; Karki, R., "Maintaining supply reliability of small isolated power systems using renewable energy," Generation, Transmission and Distribution, IEE Proceedings- , vol.148, no.6, pp.530,534, Nov 2001. [4] Goto, Y.; Suzuki, T.; Shimoo, T.; Hayashi, T.; Wakao, S., "Operation design of PV system with storage battery by using next-day residential load forecast,"
Photovoltaic Specialists Conference (PVSC), 2011 37th IEEE , vol., no., pp.002369,002374, 19-24 June 2011. [5] Gomes de Matos, J.; De Souza Ribeiro, L.A.; de Carvalho Gomes, E., "Power control in AC autonomous and isolated microgrids with renewable energy sources and energy storage systems,"Industrial Electronics Society, IECON 2013 - 39th Annual Conference of the IEEE , vol., no., pp.1827,1832, 10-13 Nov. 2013. [6] Fangrui Liu; Yong Kang; Yu Zhang; Shanxu Duan, "Comparison of P&O and hill climbing MPPT methods for grid-connected PV converter," Industrial Electronics and Applications, 2008. ICIEA 2008. 3rd IEEE Conference on , vol., no., pp.804,807, 3-5 June 2008.