individuals organize corporate documents into their own hierarchies. This view .... consist of millions of Web pagesâ5.5 millions for the IBM intranetâemployees.
Cabanac, G., Chevalier, M., Chrisment, C. et Julien, C. (2007). An Original Usage-based Metrics for Building a Unified View of Corporate Documents. In Wagner, R., Revell, N. and Pernul, G., editors : DEXA'07: Proceedings of the 18th International Conference on Database and Expert Systems Applications, volume 4653 of LNCS, pages 202 -212. Springer. Published paper: http://dx.doi.org/10.1007/978-3-540-74469-6_21
An Original Usage-based Metrics for Building a Unified View of Corporate Documents Guillaume Cabanac1 , Max Chevalier1,2 , Claude Chrisment1 , and Christine Julien1 1
IRIT-SIG, UMR 5505, Toulouse 3 University, France 2 ´ 2043, Toulouse 3 University, France LGC, EA {cabanac, chevalier, chrisment, julien}@irit.fr
Abstract. Nowadays, organizational members manage the huge amount of digital documents that they exploit at work. To do that, they organize documents into individual hierarchies. Actually, these documents are really parts of a company’s capital as they reflect past experiences, present competences and impending expertise. Unfortunately, even if corporate documents represent high value-added material, they still mostly remain unknown from the organization as a whole. That is the reason why this paper proposes to build a unified view of corporate documents. Our approach is complementary to current content-based ones because it relies on an original metrics related to documents usage within an organization.
1
Introduction
In modern organizations such as companies, institutions, R&D laboratories, etc. people constantly need to search for documents in order to accomplish their tasks. This individual activity generates amounts of documents that may interest many other members that have similar needs. However, these nuggets of information are too often unknown to others because they mostly remain into each worker’s personal document space. Nevertheless it would be worth gathering and exposing documents in a collective way in order to support communities of practice that tend to improve members’ efficiency. To do that, research works have proposed to visualize organization-wide documents by measuring inter-document similarity. These approaches commonly use lexical or even semantic metrics that only consider document contents. In fact, this really neglects how people use and organize documents. However, we think that we can benefit from it: observing how people use and classify documents may provide us with a clue to how much they are related regarding people’s practices. Therefore, the proposed unified view is based on the way individuals organize corporate documents into their own hierarchies. This view relies on a usage-based similarity computed through a unique data structure called multitree. The aforementioned hierarchies consist of people’s bookmarks, file systems, etc. The unified view enables people to discover new relations between documents that would have been undiscovered with approaches only based on document contents. Lastly it provides query and navigation features that enable users to find interesting corporate documents that may be of interest for their tasks.
This paper is organized as follows: section 2 describes our research context, that is building a unified document view from individually organized ones. With respect to this context, we also describe and point weaknesses of lexical and semantic metrics that are commonly used for computing inter-document similarity. Section 3 formally describes the usage-based inter-document metrics employed for building the unified view. Lastly, we discuss strengths and weaknesses of our approach before giving some insights into future research works in section 4.
2
Context & Motivations
This section introduces our research context: organizational work mediated by digital documents. We focus on how they are retrieved, organized into hierarchies and actually poorly shared. Therefore, we describe ways for building a unified document view by extracting documents from every organizational members’ Personal Information Spaces (PIS) [1]. A such unified representation would enable each member to view and access related documents existing within the organization. However, we underline strong weaknesses of current approaches that only consider document contents. We argue that they do not capitalize enough on individual efforts: document organization resulting from their use in daily people’s tasks. This motivates our outlined approach: exploiting a usage-based rather than content-based metrics to build the unified view. 2.1
Organizational Context
At work, people make extensive use of information sources—including the Web— from which they retrieve documents that are relevant to accomplish their tasks. Indeed, information along with these documents is a raw material for modern organizations that earn money by analyzing, combining, enriching, etc. information and its digital media—documents—for making a profit. Following this exploitation of documents, people need to structure their PIS into individual document hierarchies [1] for various purposes. In fact, this is mostly done for finding documents later, for building a legacy and for sharing them [2]. Despite these expected objectives, we underline in the following section that documents are not fully exploited at the corporate level as a whole. That is the reason why we consider them as a quiescent capital. 2.2
Corporate Documents: a Quiescent Capital
People’s individual activities generate amounts of documents that may be of great interest to other organizational members. However, such documents are very often kept in personal information spaces without really being shared. One argument from social psychology may be that information is perceived as power, so sharing documents would imply loosing power. People can also hesitate to share because they do not know if they will get something interesting in return. These arguments are difficult to take into account so we rather explore other trails. Other arguments explaining why information is not very shared have been pointed out by a recent field study of organizational work mediated by digital documents [3]. First, information is scattered in multiple locations all over most organizations. In fact, available information is unknown from people because
there is no single access point to it. Second, organizational members are not professional searchers. They often have learned to search for information on-thejob, by themselves. Thus, without an adapted training, most people do not know where to look, how to search efficiently, etc. Third, people are inundated with too much information, mostly coming from email messages. They spend a lot of time extracting interesting information from huge amounts of noisy documents. In our opinion, a predominant reason is that sharing takes time and implies a significant cognitive overload. We investigate this latter argument, considering three main ways that workers use to manually spread documents. i ) By emailing colleagues, which implies thinking about which contacts may benefit from the aforementioned documents. Choosing recipients is an highly cognitive task whereas it does not allow to spread documents outside one’s circle of contacts. This approach is merely chosen for small group collaboration [4]. ii ) By sending documents to a mailing list, whose members have subscribed for. They are often topic specific, concerning some profession for example [5]. As regards the sender, evaluating documents relevancy with respect to a mailing list can be tricky as he does not know every of its members’ needs. Therefore, some people may selfcensor whereas others may send unrelated material, overwhelming subscribers’ mailboxes. iii ) By publishing documents on organizational intranets. For this approach, the effort is transposed from the sender to each organizational member who has to actively search for these documents. As modern intranets can consist of millions of Web pages—5.5 millions for the IBM intranet—employees spend a large percentage of their time searching for information [6]. Automatic document delivery via recommender systems [7] can also be cited along with its drawbacks. Such systems exploit users’ profiles and combine demographic, cognitive, collaborative, etc. strategies to diffuse documents. Their drawbacks mainly concern profile updating latency (when a user’s interests evolve). Moreover, the way documents are organized regarding workers’ tasks is not exploited. Manual as well as automatic document sharing strategies are both expensive in time and cognitive load. That is why more human-centered strategies have been proposed in the Knowledge Management field, e.g. communities of practice aim to connect people so that they can share nuggets of information, exchange experience and solve problems in their area of experience [5]. All things considered, efficiently giving access to relevant documents is a difficult task to achieve, either manually or automatically. Indeed, people often loose precious time searching for or recreating already organization-wide scale encountered information [3]. As a solution we propose to gather documents in a unified view based on an original input: the way workers use documents. The interest of such a view is twofold: it improves organizational documents access through a user-friendly interaction meanwhile it presents a global vision of them. This view reflects the way documents are related to activities rather than to their contents. 2.3
How to Unify Corporate Documents?
Previous sections suggest that modern organizations can benefit from a unified view of corporate documents. We can at least explore two directions. i ) Provid-
ing a shared space where people collaboratively manage a unique hierarchy of documents. ii ) Exploiting people’s individual hierarchies in order to automatically gather them in a unified view. We do not support the first alternative because [8] has noticed that people want to keep individual documents under control. Moreover, they prefer to organize hierarchically rather than to rely on a system that would not provide a global view of documents, e.g. a search engine. In addition, when sharing a common hierarchy nobody is free to organize documents the way he wants. This forces people to adhere to a “single thought.” Lastly, each member would have to keep documents that he is not interested in. On the contrary, the second alternative enables people to only keep documents they really are interested in. Moreover, they can organize them the way they feel it the more efficient. That is why we discuss how to unify multiple individual document hierarchies into a unified view. In addition, visualizing corporate documents can be achieved following two ways. On the one hand, we consider Hierarchical Agglomerative Clustering (HAC) and Self-Organizing Maps (SOM) Data Mining approaches, which are content-based. On the other hand, we mention the social tagging visualization called “tag cloud,” which can be considered as an early attempt to build a usage-based unified view. Data Mining Approaches. In order to build a unified document view, one must be able to evaluate how documents are related to each other, i.e. how much they are similar. This can be achieved by a traditional Information Retrieval process [9] via the cosine measure associated with the Vector Space Model, for instance. Many Data Mining algorithms exploit such techniques to provide visual representations of a set of documents. For example, [10] describe algorithms for automatically organizing documents per contents based on the HAC algorithm. Another example may be the SOM algorithm [11]. Social Tagging Approach. A current trend called social bookmarking consists in sharing document pointers associated with user-contributed tags [12]. In order to obtain a unified view of documents thanks to these tags, a specific visualization called a tag cloud [13] has been proposed. Weaknesses of Current Approaches. Content-based comparison of documents suffers many weaknesses that are related to synonymy, homonymy, stylistic devices such as metaphors . . . This is a reason why advanced approaches such as the Latent Semantic Indexing algorithm [14] have been used. Even if partially solving lexical metrics weaknesses, such approaches cannot identify documents that are often used together, according to a specific activity. The tag cloud visualization also suffers from content-based issues as individuals can use different tags that actually represent a single concept. All things considered, current approaches never consider an actual human contribution resulting from a highly cognitive effort: documents organization. In order to take into account this aspect in a unified document view, we define in section 3 a specific inter-document usage-based metrics based on workers’ individual hierarchies.
3
An Original Usage-based Unified Document View
In this section, we describe an approach for building a usage-based unified view of corporate documents. We thus detail how to benefit from individuals’ cognitive
efforts reflected by their organized documents. Then, we formalize an interdocument usage-based metrics that is computed from individual hierarchies of documents. Lastly, we present how the unified view is implemented, along with concrete applications regarding information visualization and retrieval tasks. As people find and exploit interesting documents regarding their tasks, they store them for various purposes. To do that, their favorite organization is a folder hierarchy [1] because it really reflects how documents are related regarding people’s tasks. When inserting a document, the act of deciding which folder is best representative or even creating a new one from scratch is a highly cognitive task [15]. In spite of involved cognitive efforts, hierarchical organization is appreciated because it allows individuals not only to keep documents under control [8] but also to represent them as a whole. Moreover, when lexical-based metrics is static because based on contents only, usage-based metrics is dynamic as it relies on evolving hierarchies. To sum up, hierarchical document organization conveys a high value that is mostly unexploited by the current approaches presented above. That is why we describe in the following sections how to build a usage-based unified view of documents from multiple hierarchies. 3.1
Modeling Documents Usage: the Multitree Data Structure
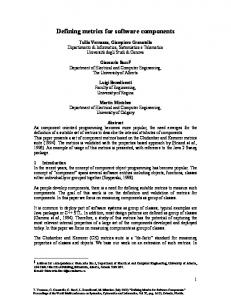
In order to identify patterns of document usage, we need to represent multiple users’ document hierarchies (excluding folders that users specify as “miscellaneous”) into a unique data structure. Following previous research works [16], we model these hierarchies using a multitree that groups together users’ documents along with their paths, see figure 1.
Fig. 1. A multitree consisting of two users’ hierarchies.
Definition 1. A multitree M= hD, F, U, RD , RF , RU i is a sextuplet where D = {d1 , . . . , dn } is a set of documents, F = {f1 , . . . , fm } is a set of folders and U = {u1 , . . . , ul } is a set of users. Moreover, we define the following relations: – RD is a binary relation on D × F that is called document membership. (di , fj ) ∈ RD means that the di document is a direct child of the fj folder. – RF is a binary relation defined on F × F that is called folder membership. (fi , fj ) ∈ RF means that the fi folder is a direct child of the fj folder.
– RU is a binary relation defined on U × F that is called root membership. (ui , fj ) ∈ RU means that the ui user owns the fj root of his hierarchy. Furthermore, we define RF+ : F → F as the function (1) that returns the p direct “parent” folder that contains a given f folder. If f is one of the roots of the multitree then RF+ (f ) = λ where λ figures the null value. RF+ (f ) = p | ∃(f, p) ∈ RF
(1)
Definition 2. Let G be the graph associated with the multitree M. A vertex of G is either a node (representing a folder) or a leaf (representing a document) while RD ∪ RF are edges of G. A path from a root r to d is a sequence denoted /r/f1 /f2 / . . . /fk /d such that f1 RF r, f2 RF f1 , . . . , dRD fk . The direct descendant folder f1 ∈ F of the r root is called a branch, it is formally defined by the b : F → F function (2). if RF+ (f ) = λ λ (2) b(f ) = f if b(RF+ (f )) = λ + b(RF (f )) else Thanks to the multitree data structure, we compute an inter-document usagebased similarity. We detail how this is achieved in the following section. 3.2
Computing an Inter-document Usage-based Similarity
In this section, we detail an inter-document usage-based similarity which considers users’ patterns of organization reflected by their document hierarchies (definition 4). This depends on inter-folder similarity (definition 3). Definition 3. Following research works on URL similarity [17], we provide the σF : F 3 → [0, 1] function (3) that evaluates the usage-based similarity of two folders. Concretely, the depth and number of common ancestors of two given folders are the two main criteria observed for evaluating their similarity. σF (b, f1 , f2 ) = 1 −
s(f1 , m(f1 , f2 )) + s(f2 , m(f1 , f2 )) s(f1 , b) + s(f2 , b) + 2
(3)
The s : F 2 → N+ function3 (4) returns the number of “steps,” i.e. edges in the path from f1 to f2 , that are assumed to be in the same b branch. To do that, we define the a : F → F function (5) that computes the set of ancestors of a given (included) f folder. Moreover, the m : F 2 → F function (6) returns the “least common ancestor” of two folders f1 and f2 , i.e. the folder that is an ancestor of both f1 and f2 and that has the greatest depth. This uses the d : F → N+ function that gives the depth of a folder. s(f1 , f2 ) = |a(f1 ) a(f2 )| 3
(4)
The operator is the symmetric set difference, corresponding to the exclusive OR (XOR) in Boolean logic: A B = (A ∪ B) \ (A ∩ B) = (A \ B) ∪ (B \ A).
( ∅ if f = λ a(f ) = + {f } ∪ a(RF (f )) else 2
m(f1 , f2 ) = f | ∀(f, f 0 ) ∈ (a(f1 ) ∩ a(f2 ))
(f 6= f 0 ) ∧ (d(f ) > d(f 0 ))
(5) (6)
Our final aim is to evaluate inter-document usage-based similarity. Remembering that documents of the multitree come from at least one user’s hierarchy, we identify common patterns in document organization. For example, if people always classify a group of documents in a same folder or in a similar way, this means that people find them similar, for any reason related to their usage [8]. Thus, we have to observe repeated patterns of document organization: the more people organize the same collection of documents in the same manner, the more these documents are considered as usage-based similar. Definition 4. The σD : D2 → [0, e] symmetric function (7) computes a usagebased similarity of two documents, provided that they are reachable from at least one branch in the multitree. Since their insertion in a same branch is the consequence of human cognitive effort, the system deduces that they have + something in common according to their owner’s need. In (7) the RD : D×F → F function (8) returns the f folder that contains a given d document, provided that f is in the b branch. u e |U | X + + σF (b, RD (d1 , b), RD (d2 , b)) (7) σD (d1 , d2 ) = |B| b∈B
+ RD (d, b)
= f | (∃(d, f ) ∈ RD ) ∧ (b ∈ a(f )) (8) Moreover, B = b(d1 ) ∩ b(d2 ) is a set of branches that both d1 and d2 have in common. Finally,uu is the number of users that have a branch both containing d1 and d2 . The e |U | expression models the fact that the more people classify two given documents in the same branch, the more these documents are usage-based similar. The second part of (7) takes into account the average distance of folders containing the two documents. 3.3
Applying the Usage-based Metrics: a Documents Unified View
As a first application we construct a unified view, i.e. a map of corporate documents thanks to the usage-based metrics proposed in the previous section. This is an original and complementary approach as opposed to classical content-based ones. The proposed unified view is a 2D similarity graph (figure 2 (a)) where vertices are documents that are interconnected by edges of variable length reflecting inter-document usage-based similarity (definition 4). To do that, we first compute a n × n document-document matrix whose values are similarities. Second, we fit the obtained matrix in a spring-embedder model [18] in order to position vertices with respect to the computed usage-based similarities. Figure 2 compares the graph obtained by a usage-based (a) vs a classical content-based (b) similarity. It represents the documents from the two hierarchies of figure 1. On the one hand, one may distinguish on the usage-based view two
(a)
(b)
Fig. 2. Usage-based (a) vs content-based (b) similarity graphs from documents represented in the figure 1.
separate document clusters, each one gathering usage-related documents. These clusters do not appear on the content-based unified view since those documents do not share any common term. This is likely to happen with large organizational documents. On the other hand, one may notice that the most usage-related documents d4 and d5 are not so close regarding content-based metrics. Moreover, d1 and d10 seem to be similar regarding their contents whereas they are not used in the same way: they belong to distinct clusters in the usage-based view. To sum up, the proposed usage-based unified view enables people to discover yet unidentified document relations, i.e. by using content-based metrics only. In order to help a user to understand why documents are usage-based similar in the unified view we label each vertex thanks to their most representative folder paths extracted from the branches of the multitree. Moreover, each edge connecting two given documents is labeled by common paths that are found in connected vertices. Associating this feature with manually adjustable zoom and clustering levels, one can dynamically drill-down the organizational documents unified view. Implementation. In order to experiment our approach, algorithms described by definitions 3 and 4 have been implemented in the Java language. As for computing the usage-based similarity graph from the aforementioned computed matrix, we used the Graphviz4 implementation. Concerning experimental data, we have gathered document hierarchies created by individuals through their common activities. In fact, we have asked 14 colleagues for their hierarchies of bookmarks. The corpus that we have constituted contains 4,079 documents (resp. 486 folders) with an average of 291 documents (resp. 34 folders) by user. A resulting graph can be seen on http://www.irit.fr/~Guillaume.Cabanac/UBgraph/. This process takes an average of 5 seconds, which makes it possible to provide users with up-to-date visualization. Discussion. Summing up works presented in this paper, usage-based metrics and its implementation have the following strengths. i ) They enable systems to compute inter-document similarity without having to be aware of their contents 4
Graphviz is an open source graph visualization software, cf. http://graphviz.org.
at all. This is a strong point since Web contents are very volatile: numerous bookmarks quickly become broken links as Web sites evolve. Moreover, usagebased similarities are more dynamic than content-based ones because they are computed thanks to evolving document hierarchies rather than fixed document contents. ii ) Usage-based metrics exploit document organization, resulting from human-contributed cognitive efforts. To our knowledge, metrics related to organization of documents have not been defined nor studied this way before. iii ) Usage-based metrics allow to represent documents on a cartography, i.e. a 2D map. Such a map can be used for both modalities of information retrieval: querying and navigating. iv ) It enables users to find multilingual documents. Indeed, if documents written in different languages are stored in a same hierarchy branch, usage-based metrics identify them as similar. So, users of the retrieval feature may benefit from multilingual results returned for a monolingual query. For example, a query in English may return English documents along with French ones if they are similar enough in the sense of definition 4.
4
Conclusion & Future Works
Modern technologies of the Information Society we live in make it possible to access increasingly growing amounts of digital documents. People are used to organize and to classify encountered interesting documents into personal information spaces according to their needs and daily tasks. In this paper, we argue that corporate organization-wide documents can be considered as a quiescent capital. Indeed, we show that people spend time and efforts searching for relevant information, that mostly remain unknown to other members with similar needs. Moreover, most information searched for is very often already present within the organization. That is why we propose to build a unified view in order to facilitate the access to corporate documents. This view may promote work-based communities, i.e. communities of practice that aim to increase organizational members’ efficiency. First, we underline that current approaches (content-based) are not sufficient enough for reflecting the real use of documents. Second, we introduce and formally describe an inter-document usage-based metrics which is used to build the unified view. Lastly, we discuss its implementation. In the proposed approach, representing a large amount of documents in a unified view would be impossible without clustering them first. As a perspective, we plan to explore alternative visual representations that would better handle large corpora. A second perspective aims to merge usage-based and content-based views. Indeed, we consider that coupling these two approaches may provide users with additional clues, helping them to understand the immaterial capital of their organization. Our current prototype not only provides a “proof of concept” but also an experimental framework. Thus, we plan to experiment and improve the proposed unified view along with the proposed usage-based metrics. A first step already involves the participation of corporate members of our laboratory. This will allow us to evaluate the acceptability of this unified view. Moreover, by the observation of knowledge workers’ daily tasks, we will be able to quantify productivity gains. Finally, we foresee that experience reports will help us to improve the accuracy of our approach as a whole.
References 1. Abrams, D., Baecker, R., Chignell, M.: Information Archiving with Bookmarks: Personal Web Space Construction and Organization. In: CHI ’98: Proceedings of the SIGCHI conference on Human factors in computing systems, New York, NY, USA, ACM Press/A-W Publishing Co. (1998) 41–48 2. Kaye, J.J., Vertesi, J., Avery, S., Dafoe, A., David, S., Onaga, L., Rosero, I., Pinch, T.: To Have and to Hold: Exploring the Personal Archive. In: CHI ’06: Proceedings of the SIGCHI conference on Human Factors in computing systems, New York, NY, USA, ACM Press (2006) 275–284 3. Feldman, S.: The high cost of not finding information. KM World magazine 13(3) (March 2004) 4. No¨el, S., Robert, J.M.: Empirical Study on Collaborative Writing: What Do Coauthors Do, Use, and Like? Comput. Supported Coop. Work 13(1) (2004) 63–89 5. Millen, D.R., Fontaine, M.A.: Improving Individual and Organizational Performance through Communities of Practice. In: GROUP ’03: Proceedings of the 2003 international ACM SIGGROUP conference on Supporting group work, New York, NY, USA, ACM Press (2003) 205–211 6. Dmitriev, P.A., Eiron, N., Fontoura, M., Shekita, E.: Using Annotations in Enterprise Search. In: WWW ’06: Proceedings of the 15th international conference on World Wide Web, New York, NY, USA, ACM Press (2006) 811–817 7. Montaner, M., L´ opez, B., de la Rosa, J.L.: A Taxonomy of Recommender Agents on the Internet. Artif. Intell. Rev. 19(4) (2003) 285–330 8. Jones, W., Phuwanartnurak, A.J., Gill, R., Bruce, H.: Don’t Take My Folders Away!: Organizing Personal Information to Get Things Done. In: CHI ’05: CHI ’05 extended abstracts on Human factors in computing systems, New York, NY, USA, ACM Press (2005) 1505–1508 9. Salton, G., Wong, A., Yang, C.S.: A Vector Space Model for Automatic Indexing. Commun. ACM 18(11) (November 1975) 613–620 10. Godoy, D., Amandi, A.: Modeling user interests by conceptual clustering. Inf. Syst. 31(4) (2006) 247–265 11. Kohonen, T.: Self-Organizing Maps. 3rd edn. Springer-Verlag, Secaucus, NJ, USA (2001) 12. Hammond, T., Hannay, T., Lund, B., Scott, J.: Social Bookmarking Tools (I): A General Review. D-Lib Magazine 11(4) (April 2005) 13. Marlow, C., Naaman, M., Boyd, D., Davis, M.: HT06, Tagging Paper, Taxonomy, Flickr, Academic Article, To Read. In: HYPERTEXT ’06: Proceedings of the 17th conference on Hypertext and hypermedia, New York, NY, USA, ACM Press (2006) 31–40 14. Deerwester, S.C., Dumais, S.T., Landauer, T.K., Furnas, G.W., Harshman, R.A.: Indexing by Latent Semantic Analysis. JASIS 41(6) (1990) 391–407 15. Rucker, J., Polanco, M.J.: Siteseer: personalized navigation for the web. Commun. ACM 40(3) (1997) 73–76 16. Chevalier, M., Chrisment, C., Julien, C.: Helping People Searching the Web: Towards an Adaptive and a Social System. In: ICWI 2004: Proceedings of the 3rd International Conference WWW/Internet, IADIS (2004) 405–412 17. Jaczynski, M., Trousse, B.: WWW Assisted Browsing by Reusing Past Navigations of a Group of Users. In Smyth, B., Cunningham, P., eds.: EWCBR. Volume 1488 of LNCS., Springer (1998) 160–171 18. Eades, P.: A Heuristic for Graph Drawing. Congressus Numerantium 42 (1984) 149–160