An overview of dielectric properties measuring techniques M.S. Venkatesh1* and G.S.V. Raghavan2 1
Department of Agricultural and Bioresource Engineering, University of Saskatchewan, Saskatoon, Saskatchewan S7N 5A9, Canada; and 2Department of Bioresource Engineering, Macdonald Campus of McGill University, Ste-Anne-de-Bellevue, Québec H9X 3V9, Canada. *Email:
[email protected]
Venkatesh, M.S. and Raghavan, G.S.V. 2005. An overview of dielectric properties measuring techniques. Canadian Biosystems Engineering/Le génie des biosystèmes au Canada 47: 7.15 - 7.30. With a need for the development of improved sensing devices for the control and automation of several agricultural, environmental, and food processes, there is an absolute need for better understanding of the dielectric properties of materials and techniques for measuring these properties. Microwave measurements and the dielectric properties of materials are finding increasing application as new electro-technology is adapted for use in the agriculture and food processing industries. The interest in dielectric properties of materials has historically been associated with the design of electrical equipment, where various dielectrics are used for insulating conductors and other components of electric equipment. Measurement of the bulk dielectric properties (dielectric constant, dielectric loss factor) is not an end unto itself. Rather, these properties are an intermediary vehicle for understanding, explaining, and empirically relating certain physico-chemical properties of the test material. Therefore, in this paper, an attempt is made to fully explore the existing knowledge of dielectric properties (complex permittivity), their role, and importance in the agri-food sector, and the concept of various measurement methodologies and their development. We have summarized the current status of research in this area with some notes on recent developments. An extensive review of the literature on measuring techniques and the comparison and potential application of dielectric properties is reported. Readers are advised to follow the appropriate literature cited for detailed and complete reference. Une meilleure connaissance des propriétés diélectriques des matériaux et des techniques de mesure de ces propriétés est de plus en plus nécessaire afin de permettre le développement d’outils de détection améliorés pour le contrôle et l’automatisation de plusieurs procédés agricoles, environnementaux et de transformation des aliments. Les techniques de mesure faisant appel aux micro-ondes et aux propriétés diélectriques des matériaux trouvent de plus en plus d’applications à mesure que de telles électro-technologies s’adaptent aux utilisations agricoles et alimentaires. L’intérêt pour les propriétés diélectriques a historiquement été associé au design d’équipement électrique où différents matériaux diélectriques sont utilisés pour isoler des conducteurs ou d’autres composantes électriques. La mesure de l’ensemble des propriétés diélectriques (constante diélectrique, facteur diélectrique de perte) n’est pas une fin en soi. Toutefois ces propriétés sont un outil intermédiaire pour comprendre, expliquer et relier de manière empirique certaines propriétés physico-chimiques d’un matériau donné. Cet article présente une revue aussi complète que possible des connaissances actuelles au niveau des propriétés diélectriques (permittivité complexe), de leur rôle et de leur importance dans le secteur agroalimentaire, de même que les méthodologies à mesures multiples et leur développement. Nous avons résumé les résultats de recherche à ce jour sur ce domaine et présenté Volume 47
2005
certains développements récents. Une revue complète de la littérature sur les techniques de mesure et des comparaisons et applications potentielles des propriétés diélectriques est présentée et il est conseillé aux lecteurs de se référer à la littérature d’origine citée pour obtenir les références détaillées et complètes.
INTRODUCTION Dielectric properties of various agri-foods and biological materials are finding increasing application, as fast and new technology is adapted for use in their respective industries and research laboratories. Earlier reports on polar dielectrics and modelling studies date back more than 70 years (Debye 1929). The earlier concept of permittivity measurements was based on dc electrical resistance to determine grain moisture content. A non-linear increase in resistance of the grain as temperature decreased gave useful observations (Nelson 1991). However, no quantitative data were reported (von Hippel 1954). Later on, ac measurements were commonly employed to measure the change in capacitance and suitable sample holding capacitors were developed (Nelson 1998). Grain moisture measurement based on dielectric properties data became the most prominent agricultural application. Newer instruments and their calibration led to the development of a standard-oven technique which further contributed to several applications of radio-frequency dielectric heating and supplemented the quest for more quantitative values. Knipper (1953) reported that the first moisture meter was designed and developed in the former U.S.S.R. for barley and wheat moisture measurement. In the last 10-15 years, the concept of permittivity measurement has been extended and applied to various agricultural, food, and bioresource problems. Research and development in this area need to be intensified. The main objective of this ‘overview’ paper is to discuss various methods of measurement (and principles) of dielectric properties and their applicability for agri-food and biological materials. BACKGROUND ON DIELECTRIC PROPERTIES MEASUREMENTS RELATED TO SELECTED AGRI-FOOD MATERIALS Interest in the dielectric properties of agricultural and food materials (and products) has been principally for predicting heating rates describing the behaviour of materials when subjected to high frequency or microwave electric fields in dielectric heating applications and as indicators in their use for rapid methods of moisture content determination in the
CANADIAN BIOSYSTEMS ENGINEERING
7.15
development of appropriate techniques for moisture determination (Nelson 1991). The influence of the dielectric properties measurement on the heating of agri-food materials by absorption of energy through radio-frequency dielectric heating, whether at high frequencies or the microwave range, has been well known for a long period of time. Several potential applications including interaction mechanisms for heating have been reported (Ryynanen 1995). Early measurements of food dielectric properties were published by Dunlap and Makower (1945) for carrots at frequencies in the range of 18 kHz to 5 MHz. The dielectric constant and conductivity were reported to depend largely on moisture content as influenced by frequency, temperature, density, and particle size. The main reason for their study was to investigate the behaviour of a high moisture commodity, such as carrots, over a frequency range (18 kHz – 5 MHz). The dielectric constant was essentially constant at moisture contents up to 6-8% and increased rapidly at higher moistures; similar behavior was seen for measured conductivities. Their results suggested that higher frequencies were most suitable for moisture determinations in food products. Dielectric properties of potato, carrot, apple, and peach tissue were measured by Shaw and Galvin (1949) at frequencies form 1 to 40 MHz. Their measurements showed a general region of dispersion between 100 kHz and 20 MHz and provided some useful data on the temperature dependence of conductivity in fruits and vegetables. Dielectric properties of raw potato at frequencies from 300 to 3000 MHz dropped appreciably with increasing frequency (Pace et al. 1968). The dielectric properties of apples (Thompson and Zachariah 1971) at frequencies of 300 to 900 MHz were found to vary with maturity, dropping appreciably in the process of aging. Tran et al. (1984) have tabulated the dielectric properties of selected vegetables and fruits at a frequency range 0.1 to 10 GHz. Mudgett (1995) reported the dielectric constant and loss of meats and vegetables at temperatures above and below the freezing point and found large differences in the properties of frozen and unfrozen samples. Thawed portions of processed samples also showed “runaway” heating effects, resulting from selective energy absorption by unfrozen fluids. Unevenness in thawing was also reported by Brown et al. (1947). Values obtained for peaches, pears, beef steak, and beef fat showed that loss factors decreased as frequency increased or as temperature decreased. Measurements of various meats and fish, including raw beef, pork, beef and pork fat, codfish, and herring, were made by Ohlsson et al. (1974) at radio frequencies from 10 to 100 MHz. They found large differences in the dielectric properties of frozen and unfrozen samples and significant differences between samples with fibers oriented perpendicular or parallel to the field, i.e., anisotropic behavior. The dielectric properties of raw potato, potato starch, and milk were measured by de Loor and Meijboom (1966) at microwave frequencies from 1.2 to 18 GHz. Zhao et al. (2000) used radio frequency (RF) heating to pasteurise surimi seafoods as well as alfalfa and radish seeds to investigate the effectiveness of capacitive (RF) dielectric heating. They reported that the packaged food depended on the material’s dielectric properties relationship with the frequency and temperature. The effect of moisture content on the dielectric properties of granular solids was reported at 9.4 GHz (Stuchly and Stuchly 1980) over a wide range of temperature and moisture contents. 7.16
Temperature dependence was not seen for dried solids but increased dramatically at higher moisture contents. Many other researchers have reported similar behaviour as a function of moisture. Kent et al. (1993) studied the effect of solid content variation during milk products processing using a newly developed on-line microwave based sensor. Pace et al. (1968) considered the potential for microwave finish drying of potato chips and found that energy absorption at 1.0 and 3.0 GHz increased at higher moisture contents and temperatures. In connection with this study, they conducted the dielectric properties measurement of 11 commercial fats and oils at frequencies from 0.3 to 3 GHz and at varying frying temperatures. Little variation in dielectric behavior was observed for these measurements. One of the oils was measured over an extended frequency range form 100 Hz to 80 GHz and was found to have a region of dispersion (rapid variation in dielectric behavior with frequency) from about 19 MHz to 1 GHz. The dielectric properties of reconstituted ground beef were measured at 0.915 GHz by van Dyke et al. (1969) to study the influence of moisture, ash, and fat contents. Moisture contents below 20% showed little variation in dielectric loss. Dielectric loss factor increased sharply with an increase in moisture from 20 to 45% and then more slowly at higher moisture. Dielectric loss factors were also found to increase with ash content and to decrease with fat content. In the study reported by Bengtsson and Risman (1971), they summarized the results of the measured dielectric properties for foods at 2.8 GHz and temperatures from -20 to 60°C. Foods included raw beef and pork, cooked beef and ham, fish, carrots, peas, mashed potatoes, gravy, and fats. Their results showed a wide variation in dielectric behavior due to differences in chemical composition, physical state, and temperature. It was not possible to estimate the effects of conductivity (dielectric properties such as dielectric constant, dielectric loss factor, loss tangent, penetration depth) in these measurements, because ash contents of the samples were not reported. The effects of dissolved salts on dielectric loss in milk were also investigated in chemical simulation studies, which showed that predictions of milk dielectric loss factor based on conductivities implied by ash contents needed to be corrected for binding and non-binding interactions of milk salts (Kudra et al. 1992). Abstracts on much of the work described above and on areas of related interest in microwave food processing are available in Mudgett et al. (1980) and Decareau (1985). During the years 1972-1990, permittivity measurement of various agri-foods was reported that provided a broad overview of dielectric behavior for liquid and semisolid products at frequencies and temperatures of interest in food processing. Examples included the research conducted at the Massachusetts Institute of Technology by Mudgett (1995), Mudgett et al. (1980), To et al. (1974), and Rzepecka et al. (1972); at the Swedish institute for Food Research by Ohlsson et al. (1974) and Ohlsson and Bengtsson (1975); Rzepecka and Pereira (1974); and at the U. S. Department of Agriculture by Nelson (1973), Nelson and You (1989) and Nelson and Kraszewski (1990a, 1990b). Although dielectric properties and their effects in food processing can now be predicted over a wide range of frequencies for many foods and processing conditions based on models, there still remain some interesting questions on the dielectric behavior of a number of polar and non-polar food constituents and their mechanisms of interaction with an
LE GÉNIE DES BIOSYSTÈMES AU CANADA
VENKATESH and RAGAVAN
electromagnetic field. A quantitative model for the coupling of electrical energy in foods by radiative transfer has not yet been found. The relationships between the dielectric properties of foods and the electrical characteristics of microwave applicator/generator with respect to mutual interactions between the loaded cavity and the generator during the course of dielectric heating or processing have not been widely used (Keam 1997, 1998). A variety of propagation models (both theoretical and numerical) has been considered, however these models have not been widely adapted. Methods of measuring the dielectric properties of granular and powdered or pulverized materials at microwave frequencies and the factors affecting the dielectric properties of materials, such as frequency, moisture content, temperature, and bulk density, were reviewed by Nelson (1994). The mechanisms of interaction between complex polysaccharide such as starch, pectin, and cellulose with water and their effects on dielectric behavior and organoleptic quality and the basis for energy coupling and attenuation by high molecular weigh lipids (fats or oils) and food solids (colloidal proteins) at both microwave and sub-microwave frequencies are of particular interest, mainly due to the reason that the interaction of constituents would explain the behaviour of a whole food matrix subjected to electro-magnetic fields. This study would be useful for designing and formulating functional foods (new product and process development). Dielectric measurements of foods at elevated temperatures and pressures would also be useful for developing predictive sterilization models, particularly for the design of high temperature short time (HTST) processes to optimize retention of nutrients. At microwave frequencies, dipole losses in high and intermediate moisture foods are dominant at low temperatures while ionic losses become increasingly dominant at higher temperatures, where penetration depths become increasingly shallow, or lower moisture, where penetration depths become increasingly large (Ryynanen 1995). While ionic losses and penetration depths are much greater at sub-microwave frequencies, dipole losses for high, intermediate, and low moisture foods are negligible at frequencies below 0.1 GHz. BASIC MICROWAVE-MATERIAL INTERACTION ASPECTS When microwaves are directed towards a material, part of the energy is reflected, part is transmitted through the surface, and of this latter quantity, part of it is absorbed. The proportions of energy, which fall into these three categories, have been defined in terms of the dielectric properties. The fundamental electrical property through which the interactions are described is the complex relative permittivity of the material, ε*. It is mathematically expressed as:
ε * = ε ' − jε "
(1)
where: ε' = dielectric constant, and ε" = dielectric loss factor. The absolute permittivity of a vacuum, εo, is determined by: Co µ o ε o = 1
where: Volume 47
2005
(2)
Co = speed of light, and µo = magnetic constant. The value for εo is 8.854 x 10⁻¹² F/m and for µo is 1.26 x 10⁻⁶ H/m. In other media (solid, liquid, and gaseous), the permittivity has higher values and is usually expressed relative to the value in vacuum (Nyfors and Vainikainen 1989). The relative permittivity of a material, εr, is equal to εabs/εo, where εabs, is the absolute permittivity of the material. Materials, which do not contain magnetic components, respond only to the electric field. The penetration depth, dp is usually defined as the depth into a sample where the microwave power has dropped to 1/e or 36.8% of its transmitted value. Sometimes, dp is defined as the distance at which the microwave power has been attenuated to 50% of transmitted power (Ptrans). The penetration depth is a function of ε' and ε": dp =
λo ε ' 2πε "
(3)
where: 8o = free space microwave wavelength (for 2450 MHz, 8o = 122 mm). The most common food products have ε" < 25, which implies a dp of 6 -10 mm. Although dielectric properties of some foods can be found in the literature, data are mostly limited to pure foods and food components. The dielectric properties of materials dictate, to a large extent, the behavior of the materials when subjected to radio-frequency (RF) or microwave fields for purposes of heating or drying (Venkatesh and Raghavan 2004). METHODS OF MEASUREMENT OF DIELECTRIC PROPERTIES The measurement of dielectric properties has gained importance because it can be used for non-destructive monitoring of specific properties of materials undergoing physical or chemical changes. There are several techniques to measure the dielectric properties of agri-food materials (Sucher and Fox 1963; de Loor and Meijboom 1966; Bengtsson and Risman 1971; Thompson and Zachariah 1971; Metaxas and Meredith 1983). The dielectric properties of food materials in the microwave region can be determined by several methods using different microwave measuring sensors (Kraszewski 1980, 1996). The particular method used depends on the frequency range of interest and the type of target material. The choices of measurement equipment and sample holder design depend upon the dielectric materials to be measured, the extent of the research, available equipment, and resources for the studies. A Vector Network Analyzer (VNA) is expensive but very versatile and useful if studies are extensive. Scalar network analyzers and impedance analyzers are relatively less expensive but still too expensive for many programs. For limited studies, more commonly available radio frequency (RF) and microwave (MW) laboratory measurement equipment can suffice if suitable sample holders are constructed. Nyfors and Vainikainen (1989) gave four groups of measurement methods, namely, lumped circuit, resonator, transmission line, and free-space methods. The lumped circuit techniques are no longer used to any great extent since they were only suitable for low frequencies and high loss materials. The latter three and the open-ended coaxial probe developed by Hewlett Packard (HP 1992) employ impedance, spectrum, or network analyzers. Current
CANADIAN BIOSYSTEMS ENGINEERING
7.17
developments are aimed at eliminating the need for these expensive yet versatile accessories (Nelson 1991). PERMITTIVITY MEASUREMENT PRINCIPLES and TECHNIQUES The measurement methods relevant for any desired application depend on the nature of the dielectric material to be measured, both physically and electrically, the frequency of interest, and the degree of accuracy required. Despite the fact that different kinds of instruments can be used, measuring instruments that provide reliable determinations of the required electrical properties involving the unknown material in the frequency range of interest can be considered (Nelson 1998). The challenge in making accurate permittivity or dielectric property measurements is in designing of the material sample holder for those measurements (RF and MW frequency ranges) and adequately modeling the circuit for reliable calculation of the permittivity from the electrical measurements. If one can estimate the RF circuit parameters appropriately, the impedance or admittance for example, the dielectric properties of that material at that particular frequency can be determined from equations that properly relate the way in which the permittivity of the material affects those circuit parameters. Field (1954) has reviewed the techniques for permittivity measurements in the low, medium, and high frequency ranges, including the use of several bridges and resonant circuits. Dielectric properties of grain samples were reported from measurements with a precision bridge for audio frequencies from 250 Hz to 20 kHz with sample holders confined in a coaxial sample holder (Corcoran et al. 1970). Attention must be paid to electrode polarization phenomena at low frequencies, which can invalidate measurement data. Nelson and Kraszewski (1990a) reported that the dielectric sample holder design for the particular materials of interest is an important aspect of the measurement technique. Results of grain and seed samples tested using a Q-meter based on resonant circuit have been documented in the 1 to 50 MHz range (Nelson 1991). Other techniques were designed and developed for higher frequency ranges with coaxial sample holders modeled as transmission-line sections with lumped parameters and measured with an RX- meter for the 50 to 250 MHz range (Jorgensen et al. 1970) and for the 200 to 500 MHz range, measured with an admittance meter (Stetson and Nelson 1970). Lawrence et al. (1998) have designed and modeled a coaxial sample holder to accommodate flowing grain and characterized by full two-port parameter measurements, with the use of several organic solvents such as alcohols of known permittivities, and signal flow analysis, to offer dielectric properties of grain over a range of 25 to 350 MHz. At MW frequencies, generally about 1 GHz and higher, transmission-line, resonant cavity, and free-space techniques have been commonly used. Principles and techniques of permittivity measurements have been illustrated in several reviews (Westphal 1954; Altschuler 1963; Bussey 1967). Dielectric property measurement techniques can be categorized as reflection or transmission types using resonant or nonresonant systems, with open or closed structures for sensing of the properties of material samples (Kraszewski 1980). Waveguide and coaxial line transmission measurements represent closed structures while the free-space transmission 7.18
measurements and open-ended coaxial-line systems represent open-structure techniques, respectively. Resonant structures can include either closed resonant cavities or open resonant structures operated as two-port devices for transmission measurements or as one-port devices for reflection measurements (Nelson 1998). In the earlier measurements by Roberts and von Hippel (1946), the standing wave ratios (SWR’s) were required to measure in line with and without the sample inserted. Based on the shift of the standing-wave node and changes in the widths of nodes, related to SWR’s, sample length, and waveguide dimensions, etc., ε' and ε" can be computed with suitable computer programs (Nelson et al. 1974). Similarly, the complex reflection coefficient of the empty and loaded sample holder can be measured using a network analyzer or other instrumentation, where similar determinations can be made as discussed above. Microwave dielectric properties of wheat and corn have been reported at several frequencies by free-space measurements with a vector network analyser. The dielectric sample holders with rectangular cross-sections were placed between the horn antennas and a similar radiating element (Trabelsi et al. 1997). The attenuation and phase shift are the two main components of the complex transmission coefficient, which permits the calculation of the dielectric constant (ε' ) and dielectric loss factor (ε") of the material under test. It is important that an attenuation of 10 dB through the sample layer be maintained to avoid disturbances resulting from multiple reflections between the sample and the antennas, and the sample size, laterally, must be sufficiently large to avoid problems caused by diffraction at the edges of the sample for free-space measurements (Trabelsi et al. 1998). For liquid and semi-solid materials, including biological and food materials, open-ended coaxial-line probes have been used for broadband permittivity measurements (Grant et al. 1989; Blackham and Pollard 1997). A similar technique is used for permittivity measurements on fresh fruits and vegetables (Ohlsson et al. 1974; Nelson et al. 1994). Due to density variations in material, such techniques are not free of errors. If there are air gaps or air bubbles between the end of the coaxial probe and the sample, the technique is not suitable for determining permittivities of granular and pulverized samples when bulk densities of such samples were established by auxiliary permittivity measurements. Perturbation technique The cavity perturbation technique is frequently used for measuring dielectric properties of homogeneous food materials because of its simplicity, easy data reduction, accuracy, and high temperature capability (Sucher and Fox 1963; de Loor and Meijboom 1966; Bengtsson and Risman 1971; Metaxas and Meredith 1983). The technique is also well suited to low dielectric loss materials (Kent and Kress-Rogers 1986; HP 1992). The resonant cavities are designed in the standard TM (transverse magnetic) or TE (transverse electric) mode of propagation of the electro-magnetic fields. It is based on the shift in resonant frequency and the change in absorption characteristics of a tuned resonant cavity, due to insertion of a sample of target material. The measurement is made by placing a sample completely through the center of a waveguide (rectangular or circular) that has been made into a cavity. Changes in the center frequency and width due to insertion of
LE GÉNIE DES BIOSYSTÈMES AU CANADA
VENKATESH and RAGAVAN
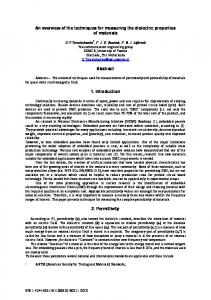
Fig. 1. Schematic of a resonant cavity method (R = reflected power, T = transmitted power). the sample provide information to calculate the dielectric constant. Changes in the Q-factor (ratio of energy stored to energy dissipated) are used to estimate the dielectric loss. Electro-magnetic (EM) field orientation for two standard cavity modes (TE and TM) is shown in Fig. 1. The size of the cavity must be designed for the frequency of interest, the relationship being inverse (higher frequency, smaller cavity). Each cavity needs calibration, but once the calibration curves have been obtained, calculations are rapid. Sample preparation is relatively easy, and the permittivities of a large number of samples can be determined in a short time. This method is also easily adaptable to high (up to +140°C) or low (-35°C) temperatures (Bengtsson and Risman 1971; Ohlsson and Bengtsson 1975; Venkatesh 1996), and has been used to determine the dielectric properties of many agri-food products over a wide range of frequencies, temperatures and compositions. For ease of measurement, the vector network analyser (VNA) can be used to automatically display changes in frequency and width (Engelder and Buffler 1991). A recommended waveguide cavity design with skeletal theory and design details is available as a standard procedure published by the American Society for Testing and Materials (ASTM 2001). The research reported by Venkatesh et al. (1998) has focused on the development of such a measuring system to operate at certain Industrial, Scientific, and Medical (ISM) approved frequencies (915 - 2450 MHz) and wide temperature ranges, etc., however the use of a very expensive vector network analyzer could be eliminated in the future. Figure 2 represents a typical cavity measurement system using a network analyzer. Solid sample preparation (Cavity Perturbation Method) For solid materials, samples in the form of rods can be formed, molded, or machined directly from their material into microwave transparent test tubes or tubing. While quartz is the best available material for this purpose, borosilicate glass is considered acceptable, but ordinary glass should not be used. Wall thickness should be as thin as possible while having the required mechanical rigidity. Paper or plastic straws may also be used if glass is not available. For a semi-solid material such as TyloseTM, the sample preparation is quite difficult; however a special micropipeting equipment for such gel-type materials has been successfully designed and built (Venkatesh 1996) . Volume 47
2005
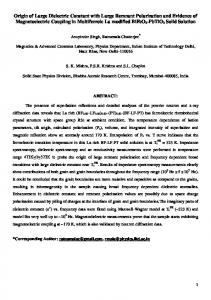
Fig. 2. Schematic of a circular perturbation cavity in simple (Transverse Electric: TE010 and Transverse Magnetic: TM010 modes) E = electric field, M = magnetic field. Liquid sample preparation (Cavity Perturbation Method) Liquids are filled into test-tube sample holders with a pipet. Small diameter pipettes themselves also make excellent sample holders. For low-loss dielectric materials, 200 :L pipettes are suitable and 10 :L pipettes for high-loss materials. Materials that can be melted can be poured into sample holders and allowed to solidify. This technique is appropriate if the material does not change its properties following melting and resolidification. The dielectric properties (both dielectric constant and dielectric loss factor) and penetration depth of supersaturated a-D-glucose aqueous solutions (45-56% w/w) at 2.45 GHz were investigated at temperatures ranging from 25 to 80°C, using the cavity perturbation method (Liao et al. 2001). The measurement details and the perturbation equations adapted for calculation of dielectric constant and loss factor along with accuracy information were reported by Liao et al. (2001) and Venkatesh (2002). Sharma and Prasad (2002) have used the cavity perturbation method (as described in ASTM D2520-90, 2001) to measure the dielectric properties of garlic at selected levels of moisture content and at 35 to 75°C. They measured the transmission characteristics by Hewlett-Packard 5410B Network Analyzer and S-parameter test set (HP 1992) combination. Semi-solid samples (Cavity Perturbation Method) Sample preparation involves either filling the sample in its molten state and then solidifying or applying a vacuum at one end while forcing the sample into a thin cylindrical shaped holder. Because temperature measurements may be difficult due to the nature of the materials such as cheese, butter, etc., it is important to develop suitable fixtures to contain samples at different threshold conditions (Horsfield et al. 1996). Due to difficulty in handling high-loss semisolid samples (tomato ketchup), some measurement methods are not suitable at all conditions (high temperatures). Waveguide and coaxial transmission line method Early efforts to characterize the dielectric properties of materials were made at the Massachusetts Institute of Technology (Roberts and von Hippel 1946; von Hippel 1954). The values of ε' and ε" were derived from transmission line theory, which
CANADIAN BIOSYSTEMS ENGINEERING
7.19
Fig. 3. Schematic of a reflected wave method (R = reflected power, T = transmitted power). indicated that these properties could be determined by measuring the phase and amplitude of a reflected microwave signal from a sample of material placed against the end of a short-circuited transmission line, such as a waveguide or a coaxial line. Figure 3 shows the schematic of a reflected wave method, often adopted by a coaxial line. For a waveguide structure, rectangular samples that fit into the dimensions of the waveguide at the frequency being measured are required. For coaxial lines, an annular sample needs to be fabricated. The thickness of the sample should be approximately one-quarter of the wavelength of the energy that has penetrated the sample. Since the shift in wavelength is related to the dielectric constant, a guess must first be made as to the magnitude of the constant. Typical thickness at 2450 MHz ranges from 5 mm for woods (Torgovikov 1993) to 19 mm for fats and oils. Dielectric sample
Fig. 4. Schematic of a coaxial transmission method (E = electric field, H = magnetic field, R = reflected power). Reflected wave method using S11 measurement of the material in an open and shorted transmission line.
7.20
Fig. 5. Schematic of a transmission line - waveguide method (R = reflected power, T = transmitted power). holder design for a particular material of interest is an important aspect of the measurement technique. Kim et al. (1998) have measured and predicted the dielectric properties of biscuit dough at 27 MHz and their results are found to be significantly useful for the baking industry operating at both radio frequency and microwave spectrums. Coaxial-line and rectangular wave-guide sample holders were used with various microwave measurement systems assembled for dielectric properties determination on grain, seed, and fruit and vegetable tissue samples at frequencies from 1 to 22 GHz (Nelson 1973, 1983, 1984, 1991). The same sample holders were also found to be useful for measurements on pulverized coal and mineral samples (Nelson 1983). The details of each of the above techniques are described in the next section. Figure 4 represents a coaxial measurement system. Transmission line technique This technique is cumbersome because the sample must be made into a slab or annular geometry. At 2450 MHz, the sample size is somewhat large, particularly for fats and oils. Commonly available waveguide test equipment for 2450 MHz is designated WR-284. For measurements at 915 MHz, only the coaxial line technique is practical due to the large size of the waveguide required. Liquids and viscous-fluid type foods can be measured with this method by using a sample holder at the end of a vertical transmission line. The dielectric properties can be easily and inexpensively obtained by the transmission line technique, particularly if one utilizes a slotted line and standing-wave indicator (Nelson et al. 1974). A more sophisticated implementation of the technique utilizes a swept-frequency network analyzer, where the impedance is measured automatically as a function of frequency. Figure 5 represents a typical transmission measuring system using a vector network analyzer. Resonators and transmission line A microwave resonator (as shown in Figure 6), partly or completely filled with a material can also be used to determine permittivity. The resonator (perturbation technique) is usually calibrated with materials whose dielectric properties are known,
LE GÉNIE DES BIOSYSTÈMES AU CANADA
VENKATESH and RAGAVAN
Fig. 6. Schematic of an open cavity (TE013) dielectric resonator (H = magnetic field, E = electric field). usually with organic solvents such as methanol, ethanol, etc. The measurement frequency range is from 50 MHz to more than 100 GHz. If the transmission line is enclosed (i.e., it is a waveguide), the permittivity of a material can also be measured without the resonator by putting it directly inside the waveguide. The method applies to all liquid and solid materials, but not to gases since their permittivities are too low. There are, however, problems with the sample preparation of solid materials. The accuracy is not as good as that of the transmission line with resonator. In transmission line methods, a sample of the substance is put inside an enclosed transmission line. Both reflection and transmission are measured. Although this method is more accurate and sensitive than the more recent coaxial probe method, it has a narrower range of frequencies. As the substance must fill the cross-section of the transmission line (coaxial or rectangular), sample preparation is also more difficult and time consuming (Engelder and Buffler 1991; HP 1992). When such methods are used to determine moisture content, the frequency used should be above 5 GHz to avoid the influence of ionic conductivity and bound water relaxation (Kraszewski 1996). For this reason, some studies on dielectric properties and density relationships have been concentrated at high frequencies. However, the size of microwave components is usually proportional to the wavelength and therefore inversely proportional to frequency. Open ended probe technique A method that circumvents many disadvantages of the transmission line measurement technique was pioneered by Stuchly and Stuchly (1980). The technique calculates the dielectric properties from the phase and amplitude of the reflected signal at the end of an open-ended coaxial line inserted into a sample to be measured. Care must be exercised with this technique because errors are introduced at very low frequencies and at very high frequencies, as well as for low values of dielectric constant and loss factor. This technique is valid for 915 and 2450 MHz, for materials with loss factors greater than 1 (Sheen and Woodhead 1999; HP 1992). Interpretation for lower-loss materials such as fats and oils must be treated with caution. Typical open-ended probes utilize 3.5 mm diameter coaxial line. For measurement of solid samples, probes with flat flanges may be utilized (HP 1992). The open-ended probe technique has been successfully commercialized and software Volume 47
2005
and hardware are available. Wang et al. (2003) indicated that it is highly desirable to measure dielectric properties of biomaterials over the temperature range commonly experienced in insect controls, as thermal treatments for controlling insects in fruits were 20 to 60°C. An open-ended coaxial probe technique was used to measure the dielectric properties of insects over a frequency range from 1 to 1800 MHz (Wang et al. 2003). The coaxial probe method is basically a modification of the transmission line method. It uses a coaxial line, which has a tip that senses the signal reflected from the material. The tip is brought into contact with the substance by touching the probe to a flat face of a solid or by immersing it in a liquid. While the method is quite easy to use and it is possible to measure the dielectric properties over a wide range of frequencies (500 MHz - 110 GHz), it is of limited accuracy particularly with materials with low values of ε' and ε" (Engelder and Buffler 1991; HP 1992). There has been a number of variations of the basic coaxial-line probe, for example, elliptical ended (Xu et al. 1992) and conical tipped (Keam and Holdem 1997a). Dielectric properties of six fruit commodities along with four associated insect pests have been measured between 1 and 1800 MHz using an open-ended coaxial probe technique and at temperatures between 20 and 60°C (Wang et al. 2003). TDR (reflectometry) method Time domain spectroscopy (or TDR, reflectometry) methods were developed in the 1980s and used for studies of the dielectric properties of food. Essentially, this method also utilizes the reflection characteristic of the material under test to compute the dielectric properties. The measurement is very rapid and accuracy is high, within a few percent error (Afsar et al. 1986). The sample size is very small and the substance measured must be homogeneous. Although these methods are expensive, they are excellent tools for advanced research on the interaction of the electromagnetic energy and materials over a wide frequency range (Mashimo et al. 1987; Ohlsson et al. 1974). The dielectric properties of honey-water mixture have been investigated and tabulated using the time domain reflectometry (TDR) technique in the frequency range of 10 MHz to 10 GHz at 25oC by Puranik et al. (1991). Free-space transmission techniques Of the measurement techniques available, free-space techniques are also grouped under non-destructive and contact-less measuring methods. They do not require special sample preparation. Therefore, they are particularly suitable for materials at high temperature and for inhomogeneous dielectrics. In addition, they may be easily implemented in industrial applications for continuous monitoring and control. e.g, moisture content determination and density measurement (Kraszewski 1980, 1996). In a free-space transmission technique, a sample is placed between a transmitting antenna and a receiving antenna, and the attenuation and phase shift of the signal are measured. The results of which can be used to translate the material dielectric properties. Accurate measurement of the permittivity over a wide range of frequencies can be achieved by free space techniques. In most systems, the accuracy of ε' and ε" determined depends mainly on the performance of the measuring system and the validity of the equations used for the
CANADIAN BIOSYSTEMS ENGINEERING
7.21
Fig. 7. Schematic of a free-space transmission technique for measuring reflection and transmission (Ports 1 and 2 are connected to the Vector Network Analyzer). calculation. The usual assumption made during this technique is that a uniform plane wave is normally incident on the flat surface of a homogenous material, and that the planar sample has infinite extent laterally, so that diffraction effects at the edges of the sample can be neglected. Figure 7 represents a freespace measuring technique with the transmitting and receiving antenna elements. Trabelsi et al. (1997) accounted for multiple reflections, mismatches, and diffraction effects at the edges of the sample as they are generally considered the main sources of errors. To enhance the measurement accuracy, special attention must be paid to the choice of the radiating elements, the design of the sample holder, and the sample geometry and location between the two radiating elements. Microstrip transmission line Microstrips have long been used as microwave components, and shows many properties which overcome some of the limitations, thus making it suitable for use in dielectric permittivity measurement. It is well known that the effective permittivity (a combination of the substrate permittivity and the permittivity of the material above the line) of a microstrip transmission line (at least for thin width to height ratios) is strongly dependent on the permittivity of the region above the line. This effect has been utilized in implementing microwave circuits and to a lesser extent investigation of dielectric permittivity. Furthermore the measurement of effective permittivity is relatively straightforward and well suited to implementation in industrial equipment. Such a system could be based on determining the effective permittivity of a microstrip line covered by an unknown dielectric substance (Keam and Holmes 1995). Use of printed circuit boards and adding substrate materials to characterize materials and measuring permittivity using algorithmic models, have been reported. However, its applicability to food and agricultural material processing would still be an anticipatory issue at this stage. Six-port reflectometer using an open-ended coaxial probe Ghannouchi and Bosisio (1989) worked on non-destructive broadband permittivity measurements using open-ended coaxial 7.22
lines as impedance sensors, which are of great interest in a wide variety of biomedical applications. An attempt was made to replace expensive automatic network analyzer (ANA) such as the HP8510B by combining the capabilities of personal computers with customized software to derive all the necessary information from less expensive components. The reported measuring system consists of a microwave junction designed to operate from 2 to 8 GHz and a number of standard microwave laboratory instruments (power meters, counters, sweepers, etc.) controlled by an IEEE 488 bus interface by a microcomputer (HP9816) to provide a precision low-cost automatic reflectometer suitable for permittivity measurements. The device under test is an open-ended coaxial test probe immersed in the test liquid kept at a constant temperature. Data acquisition and reduction are fully automatic. The complex reflection coefficient is calculated from the four power readings and the calibration parameters of the six-port reflectometer. It is concluded that the SPR (six-port reflectometer) can provide nondestructive broadband permittivity measurements with an accuracy comparable to commercial ANA accuracy but at a considerable reduction in equipment costs. This effective transmission line method, used to represent the fringing fields in the test medium, provided a good model to interpret microwave permittivity measurements in dielectric liquids. Using such a model, the precision on relatively high-loss dielectric liquid measurements is expected to be good. However this method involves a more complex mathematical procedure in order to translate the signal characteristics into useful permittivity data. Colloid dielectric probe: (Hewlett Packard - HP) Engineers at HP have developed what they say is the first radiofrequency dielectric probe for evaluating colloidal liquids such as milk, etc. The unit can quickly and accurately measure dielectric properties of these types of materials, offering the promise of improving a variety of food, chemical, pharmaceutical, and bio-chemical products. The HP E5050A Colloid Dielectric Probe is designed for permittivity evaluation of colloidal liquid materials in the food, chemical, pharmaceutical, and biochemical industries. It operates from 200 kHz - 20 MHz with the HP4285A precision LCR meter and HP vectra personal computer. The advanced sensing technique provides permittivity vs frequency characteristics. Its electromagnetic technique eliminates the electrode polarization effect, which causes measurement error when ionic materials are measured with metal electrodes. MATHEMATICAL EXPRESSIONS FOR CALCULATING THE DIELECTRIC PROPERTIES MEASURED USING SEVERAL TECHNIQUES This section includes the extracted information from a range of reported literatures, classical text (Metaxas and Meredith 1983), and ASTM (2001). It is suggested that readers refer to the above resources for complete theoretical derivations of the expressions for dielectric constant and dielectric loss factor. They are indirectly estimated based on measured parameters such as; reflection coefficient, phase and amplitude portion of the signal, change in resonant frequency and Q-factor, attenuation, etc. There is hardly any information that is available for general formula for all materials, particularly agri-food and biological materials. The authors have comprised this information based
LE GÉNIE DES BIOSYSTÈMES AU CANADA
VENKATESH and RAGAVAN
where:
(o = propagation coefficient of air-filled coaxial line, Y0 = characteristic admittance of air-filled coaxial line, Y,0 = characteristic admittance of test material-filled coaxial line YLS = admittance for load start, YLE = admittance for load end, y0 = propagation coefficient of air-filled coaxial line, y, = propagation coefficient of test material-filled coaxial line, lo = relative position at actual open circuit, ls = relative position at load start, r0 = inner radius of the outer conductor, ri = outer radius of the inner conductor, and T = operating angular frequency.
Fig. 8. Schematic of a slotted reflection system (Ym = measure admittance, YLS = load admittance at start, YLE = load admittance at end, Y0 = characteristic admittance, Im = measured length, IS = length position at start, I0 = length position at end, E = electric field strength). on the available information and personal research work in this domain over years. Slotted line reflection system A schematic diagram of the measured parameters for this type of measurement system is shown in Fig. 8. The overall permittivity (ε) of a test material is calculated by measuring the admittance at a convenient point along the length of a coaxial air-line with the test material filling some portion of the line between the line conductors, as shown in Fig. 8. The measured admittance, Ym is related to the load admittance, YLS, which is equivalent to the reflection coefficient measured at LS, and is used to calculate the overall permittivity (ε), as shown in Eq. 4.
ε=
1 YLS − γ o ( lo − l s ) γ o l s Yo
(4)
Guided or free space transmission system A transmission dielectric measurement system may take the form of a guided or a free space transmission system depending upon whether the applicator used is a coaxial line or a waveguide or a pair of horn antennas with test material in between. A network analyzer ratios the magnitudes (m) and the phases (p) of the transmitted (Tra) and the reference (Ref) signals to produce the transmission coefficient (T), which is used to calculate the permittivity (ε') of the test material as follows. The following procedure is for a guided transmission system. However the same procedure can beused for the free space transmission system substituting 1/8C0= 0 as the cut-off wavelength, 8C0, for the system becomes infinity. In general, these calculations are programmed in a digital computer to enhance the system speed. 2 2 λ0 2π 2 2 − α − β 2π λ c
λ0 2π
(11)
( 2αβ )
(12)
The unknowns " and $ are calculated using Eq. 13, which is a function of " and $ for T, a measured quantity, and other parameters are given by Eqs. 14 – 18. Equation 13, gives the transmission coefficient.
T=
ω
(5)
C0
( (
Y + Y tanh γ l ε0 ε s LE = Yε 0 Y + Y tanh γ l LE ε s ε0
[ (
YLE = Y0 tanh γ 0 l 0 − l s
γ ε = εγ 0 1 60 ln( r0 / ri )
Yε 0 = ε Y0 Volume 47
)
(1 − Γ ) exp( − γL) 2
γo = j
Y0 =
2
ε" =
in which:
YLS
(
ε' =
2005
)]
) )
(6)
1 − Γ 2 exp( − 2γL)
(13)
where: L = sample length, ( = propagation coefficient given by Eq. 14, and ' = reflection coefficient given by Eq. 15.
γ = α + jβ
(14)
Z − Z0 Z + Z0
(15)
(7) (8)
(9) (10)
Γ=
In Eq.14, " and $, respectively, represent the attenuation and the phase change coefficients of the applicator with test material, and Z and Zo in Eq. 15 are, respectively, the characteristic impedances of the applicator with and without the test material,
CANADIAN BIOSYSTEMS ENGINEERING
7.23
and are given by:
jϖµ 0
Z=
=
γ
Z0 =
jϖµ 0
γ0
β 1 + j
2πη0
=
α2 +β2
λ0 2πη0
(16)
(17)
λ0 β 0
2 2π λ 0 1 − β0 = λ0 λc
where: :o = 0o = (o = $o =
α β
1/ 2
(18)
Filled or partially filled cavity resonance systems When a rectangular waveguide or a cylindrical cavity filled or partially filled with a test material is used for an applicator, the resulting system is called the filled or partially filled (perturbation) cavity resonance system. In the filled cavity resonance system, the ε of the test material is calculated noting the change in the resonant frequency, and the quality factor of the cavity when the cavity is empty and filled with the test material. If fo and fs, and Qo and Qs are the resonant frequencies and the quality factors before and after the cavity is filled with the test material, then the overall permittivity (ε) can be calculated by Eqs. 19-22 for a filled cavity and Eqs. 21-24 for a partially filled cavity. (a) Filled 2
'
1 1 ε = − Qs Qo "
(19)
fo fs
fo 2 f s
(20)
in which:
Qo = Qs =
fo
(21)
f o ( 3dB ) fs
(22)
f s( 3dB )
(b) Partially filled
ε' =
V 1 fo − 1 c − 1 2 fs Vs
(23)
1 1 1 Vc − 4 Qs Qo V s
(23)
ε" =
where subscripts o and s indicate without sample and with sample, respectively, and: 7.24
= = = = =
quality factor, 3 dB frequency bandwidth for empty cavity, 3 dB frequency bandwidth for filled cavity, volume of test material, and volume of cavity.
Open-ended coaxial probe The expression for calculating YL (T, ε) is given by: YL (ϖ , ε ) = jϖCi + iϖCo ε + jAϖ 3 ε 2 + Bϖ 4 ε 2.5
YL (ϖ , ε ) = Yo
air permeability of air-filled applicator, air intrinsic impedance of air-filled applicator, propagation coefficient of air-filled applicator, and phase change coefficient of the air-filled applicator.
f ε = o fs
Q fo(3dB) fs(3dB) Vs Vc
1 − Γ (ω , ε ) 1 + Γ (ω , ε )
(25) (26)
where: Yo (=50 S) = characteristic admittance of probe, and '(T,ε) = reflection coefficient. The overall permittivity is denoted by ε. The load admittance YL(T,ε) is calculated using Eq. 26 from the measured reflection coefficient, '(T,ε). Along with the model parameters determined in the forward process, the overall permittivity of the test material can be calculated by a suitable iterative method using Eq. 25. INSTRUMENTATION ASPECTS OF PERMITTIVITY MEASUREMENTS Network analyzers This section is aimed at recognising the usefulness, development, and role of simplified instrumentation steps in a microwave (MW) measuring context. Network analysis is the process of creating a data model of the transfer and/or impedance characteristics of a linear network (active or passive). This is done through stimulus response testing over the frequency range of interest. Some analyzers do this with pointto-point frequency testing, while others do this by sweeping the frequency band at one time. Network analysis is generally limited to the definition of linear networks. Sine wave testing is an ideal method to characterize magnitude and phase response as a function of frequency. Network analyzers are instruments that can measure the transfer and/or impedance functions through sine wave testing. Since transfer and impedance function are ratios of various voltages and currents, a means of separating the appropriate signals from measurement ports of the device under test is required. The analyser must detect the separated signals form the desired signal ratios and display the results. At microwave frequencies, where standing waves might occur on the transmission line, the analyzer must be capable of separating the signal from the travelling waves. Automatic Vector Network Analyzers (AVNA) are commonplace for doing these precise forms of measurements. Scalar network analyzers (magnitude only) and vector network analyzers (both magnitude and phase) are available. Network analyzers usually employ two types of detection methods. Broadband detection accepts the full frequency spectrum of the input signal, while narrow band detection involves tuned receivers that convert continuous wave (CW) or swept RF signals to a constant intermediate frequency (IF) signal. Each detection scheme has its advantages.
LE GÉNIE DES BIOSYSTÈMES AU CANADA
VENKATESH and RAGAVAN
Scalar analyzers usually employ broadband detection techniques. Broadband detection reduces instrument cost by eliminating the IF section required by narrowband analyzers. This sacrifices noise and harmonic rejection. Broadband systems can make measurements when the input and output frequencies are not the same, as in measurements of the insertion loss of mixers and frequency doublers. Narrowband systems cannot make these measurements. Vector network analyzers normally employ narrowband detection techniques. This makes for a more sensitive low-noise detection of the constant IF. This also increases the accuracy and dynamic range for frequency selective measurements (as compared to broadband systems). There is a good range of adaptability and flexibility in analyzer systems. Impedances can be shown on a Smith-chart overlay for a polar display. An S-parameter (ratio of reflected and absorbed MW power) test set can be attached to perform Sparameter measurements. Computer controlled network analyzers can be programmed to set up and make many measurements automatically. The measurement process is further accelerated by the computer’s ability to store, transform, summarize, and output data in a variety of formats to a number of peripherals. Functions that are normally displayed in the frequency domain can be converted to the time domain for additional analysis. Microwave measurements with vector network analyzer When a network analyzer system is used for performing microwave measurements, there exist certain inherent measurement errors which can be separated into two categories: instrument errors and test set/connection errors. Instrument errors are measurement variations due to noise, imperfect conversions in such equipment as the frequency converter, cross talk, inaccurate logarithmic conversion, non-linearity in displays, and overall drift of the system. Test set or connection errors are due to the directional couplers in the reflectometer, imperfect cables, and the use of connectors and adapters. The instrument errors exhibited by modern network analyzers are very small. In a probe network analyzer measuring system, the primary source of measurement uncertainty is due to test set or connector errors at ultra high frequency and microwave frequencies. These uncertainties are quantified as directivity, source match, and frequency tracking errors. Hewlett Packard has developed a suitable analytical model to account for test set or connection errors for correcting reflectivity measurements on their semi-automatic network analyzer system. This model has been implemented for use with in-vivo measurement probe and equations, which correct for the open-circuit fringing capacitance of the probe, have been added to the algorithm (Burdette et al. 1982). Data for standard reference liquids such as water, methanol, and ethanol might be helpful for correcting errors (Buffler 1993). Since voltage and current values vary along the length of a transmission line, they are not suitable for accurate measurements at microwave frequencies; therefore, it is much more convenient to measure power. The measurement of microwave power requires that one should know how to operate power detectors and indicating instruments and how to apply techniques that minimize errors and increase the accuracy of the
Volume 47
2005
measurement. For power measurements (or any other parameter) to have any significance, the instruments used must be calibrated to specifications. A concept of uncertainty analysis is useful for accounting possible causes of error. Usually, there are three different power levels in a microwave measuring system: the power generated by the source, the amount on the transmission line, and that absorbed by the load. Evaluating these power differences involves a concept that is quite mathematical in nature. Noise It is helpful to divide noise into two types: internal noise, which originates within the microwave component or equipment, and external noise, which is a property of the channel. The channel is the link through which the signal travels. At any temperature above absolute zero (-273.15°C), electrons in any material are in constant random motion. Although this random motion does not produce a current flow in any direction, it does produce current pulses that are the source of noise. Most electronic systems are evaluated on the basis of a signal-to-noise ratio (SNR). It is not really the amount of noise that concerns, but rather the amount of noise compared to the level of the desired signal, that is the ratio of signal to noise power. This signal to noise ratio can be expressed in decibels. It is noted that the ratio is always given in power and not voltage. The formula for SNR in dB is given by (SNR(dB) = 10 log Ps/Pn), where Ps is the signal power and Pn is the noise power. The ratio is difficult to measure, since it is not possible to turn off the noise in order to measure the signal power alone. Frequency measurements Venkatesh (2002) reported that several microwave procedures require a measurement of frequency. There are basically two methods to measure microwave frequencies. The first approach, and the most accurate, is to measure the frequency directly with a frequency counter. Comparing an unknown signal to a reference frequency, the crystal oscillator, makes direct frequency measurements. The input signal is first conditioned into a series of pulses and then passed to the main gate. The frequency is measured by generating a gate time, consisting of a number of cycles of the reference clock, during which the input signal is counted. The frequency is calculated by dividing the number of cycles by the gate time. To make frequency measurements at microwave frequencies, various down-conversion techniques are used to convert the microwave input to an intermediate frequency signal (IF) so that the resultant signal can be directly counted. The three basic techniques for down-conversion are prescaling, transfer oscillator, and harmonic heterodyne. Prescaling Prescaling uses a divider circuit to reduce the frequency of the input signal to a lower frequency that can then be counted by the direct counter circuit. However, this technique has frequency limitations. If the microwave signal’s amplitude is sufficiently low, the output of the detector is proportional to the square of the microwave signal voltage and, therefore, proportional to the microwave signal power (since V2µP). When the voltage is low, the detector is said to be operating in its quadratic or square-law region. When the microwave signal power is greater than
CANADIAN BIOSYSTEMS ENGINEERING
7.25
Table 1. A general comparison of the microwave dielectric measurement systems. Slotted line reflection system
Guided wave transmission system
Free space transmission system
Filled cavity resonance system
Partially filled cavity resonance system
Probe reflection system
Frequency
broad band
banded
banded
single
single
broad band
Sample size
moderate
moderate
large
large
very small
small
Temperature monitoring/control
difficult
difficult
very easy
very easy
very easy
easy
Accuracy for: Low-loss material High-loss material
very low low
moderate moderate
moderate moderate
very high does not work
high low
low high
Sample preparation
easy
difficult
easy
very difficult
very difficult
easy
Most suitable test material
solids, semisolids
solids
large flat sheets
solids, semisolids, liquids
solids
solids, semisolids, liquids
Measured parameter (permittivity, ε and/or permeability, :)
permittivity
permittivity and permeability
permittivity and permeability
permittivity or permeability
permittivity or permeability
permittivity
To test material
destructive
destructive
non-destructive
destructive
destructive
non-destructive
Commercial vendors
no
yes
yes
no
no
yes
!15 dBm (standard unit for very low MW power, decibels), the voltage of the detector’s output signal tends to be directly proportional to the microwave signal voltage. The detector is said to be operating in its linear region; that is, it rectifies the applied signal (Venkatesh 2002). DEVELOPMENT ASPECTS and SUMMARY I S M and D (Industrial, Scientific, Medical, and Domestic) frequency based equipment Domestic microwave ovens operate at 2450 MHz. However, a large commercial oven might be destined to operate at any of the other approved ISM frequencies, which could give gains in cost efficiency, processing time, or product quality. A key factor in such a choice is the overall permittivity of the product being processed. Dielectric measurements and computer modeling can help to choose the optimum frequency. Researchers need to understand microwave performance and optimize product design instead of using expensive "trial and error" guesswork. Dielectric measurements also have uses in package design, process control, and physical/chemical analysis. Any measuring system needs improvement and accuracy considerations. The need, suitability ,and operating conditions all play a dominant role in evaluating the performance of such systems. Selection and design of sample holder, nature of material under test, experimental conditions, the degree of accuracy expected, instrumentation capabilities, and interpretation tools all govern the choice of the complete measurement system. Not all materials can be tested by one single method at all conditions since the intended application and usefulness of measured properties are important to be considered. Applications range from moisture sensing, 7.26
modelling dielectric properties with process variables (temperature, frequency, bulk density, composition, particle size and shape, etc.), design of microwave heating applicators, and so on. Since biological materials are transient in nature, it is difficult to standardize the tools for dielectric measurements; however, applying proper calibration and mathematical routines one can minimize errors and generate useful information on the material under test. The following section deals with some of the recent developments in the permittivity measurement domain. The details can be obtained by referring to cited literature. The authors of this paper have attempted to compare different measuring techniques based on selected criteria, since there is no literature reported on general and qualitative/quantitative aspects. Table 1 shows a general comparison of the microwave dielectric measurement systems based on collective information available in the literature and the authors’ own experiences in this field. OTHER USEFUL APPLICATIONS OF PERMITTIVITY MEASUREMENTS There are other uses for dielectric properties measurements (not related to microwave heating of food) that can be of interest to agri-food researchers. Some of them are (Nelson 1998): • An important use of the dielectric properties of grain and other agricultural products in their exploitation for rapid, nondestructive sensing of moisture in materials. • Moisture content is often the most important characteristic of agricultural products, because it determines their suitability for harvest and for subsequent storage or processing. It often determines the selling price of the products for intended purposes.
LE GÉNIE DES BIOSYSTÈMES AU CANADA
VENKATESH and RAGAVAN
•
Dielectric properties have been utilized with properly designed electronic sensors with reasonable accuracy. Such moisture testing instruments, operating in the 1-50 MHz range, have been developed and used for rapid determination of moisture in grains for many years. • More recently, techniques have been studied for sensing the moisture content of single grain kernels, seeds, nuts, and fruits so that instruments for measuring the moisture content of individual objects can be developed. In addition to moisture measurement, the dielectric properties measurements have been useful in several diagnostic tests as well as for the processing of materials (sectors such as: agri-foods, pharmaceuticals, biomedical, forestry, textile, metallurgy, etc.). The readers should consult the references cited in this publication for complete reading and links. There is a need for more precise on-line moisture monitoring equipment that can provide continuous records for commodities moving into and out of storage, or being processed or loaded for transport. New microwave sensor - On-line moisture, salt, and density measurement
King (1997) and Keam and Holdem (1997b) have reported new developments and applications for a continuous, on-line determination of moisture content, salt, and dry density of food products with microwave sensors. Two unique types of sensors and their ancillary electronics for process control and/or product quality measurement were introduced. For both, measurement principles are based on the interaction of electromagnetic fields with the dielectric and power dissipative properties of matter, particularly of water. These properties are diagnostics of the partial water and dry densities. The material being measured is interfaced through various ways with an open reflection type resonator, which is in contact with the material. Sensors of this type can be flat or curved for flush mounting in a shaker, hopper, chute, or conveyor pipe. The other sensor developed is a non-contacting type, wherein a microwave beam is transmitted through the test material. Signal attenuation (absorption) and phase delay measurements are measured and then related to the moisture and dry basis weights by suitable empirical algorithms. Either type of sensor indicated above can be used for continuous, on-line measurements or as stand-alone bench top instruments (King 1997). Both measurement types have some advantages as well as limitations with respect to flexibility, applicability to different forms of materials, resolution and accuracy, cost, speed of data acquisition, etc. However, the relative advantages and limitations are matters of degree, depending on the particular application. Dual frequency dielectric analyzer Venkatesh and Raghavan (1998) and Venkatesh (2002) have developed a dual frequency (915, 2450 MHz) permittivity analyser to measure the dielectric properties of agri-food materials using the cavity perturbation concept. Venkatesh (2002) reported the dielectric behavior of a range of agri-food materials measured by the above system that basically aimed at reduction in huge costs (in relation to VNA) and accessories. The functional aspects of the network analyzer were utilized in
Volume 47
2005
designing and building the basic system, which analyzed the transmission and reflection characteristics, resulting in dielectric measurements. This new dielectric properties measurement system is capable of both low and high temperature (-30 to 200°C) measurements. The measurement system basically tracks the peak resonant frequency and the shift (with sample) is correlated to the dielectric constant and the change in quality factor (Q-factor) usually describes the loss factor. The dielectric constant and dielectric loss factor values of glucose solution and combinations were reported by Liao et al. (2001), along with accuracy information. FUTURE DIRECTIONS Recent studies have shown that with proper measurements, such as simultaneous measurement of microwave signal attenuation and phase changes, reliable moisture measurements can be obtained independent of density fluctuations (while products are conveyed). An extensive literature review on the methodologies is conducted. Several methods for measurement of the dielectric constant and loss factor (permittivity) are discussed and applicability for agri-food materials is explored. Techniques for the measurement of dielectric properties of agri-food materials are many and varied. The choices of measurement equipment and sample holder design depend upon the dielectric materials to be measured. Dielectric sample holder design for the particular materials of interest is an important aspect for the measurement method. For liquid samples, cavity perturbation method has been extensively adapted for both high and low temperature measurements at limited frequency range while reflection based measurements have capabilities for broader frequency range, however both solid and liquid measurements can be accurately measured. The importance of understanding the interaction of material subjected to electro-magnetic fields is addressed. The rapid advancement in the instrumentation and electronic component selection have necessitated the development of a permittivity analyser that is independent of vector network analyser (Venkatesh 2002). This will be helpful for dielectric properties measurement and analyses on-line (e.g, moisture sensing in a conveying grain application) as they are portable and inexpensive. Continued research and development of such techniques are aimed at providing tools for better management of factors important in sensing, preserving, processing, and maintaining the quality of agricultural and food materials for ever growing consumer expectations. ACKNOWLEDGMENTS The authors thank the Natural Sciences and Engineering Research Council (NSERC) of Canada for its financial support. REFERENCES Afsar, M.N., J.R. Birch, R.N. Clarke and G.W. Chantry. 1986. The measurement of the properties of materials. IEEE Transactions of Instrumentation and Measurement 74(1):183-199. Altschuler, H.M. 1963. Dielectric constant. In Handbook of Microwave Measurements, eds. M. Sucher and J. Fox, 530536. New York, NY: Brooklyn Polytechnic Press.
CANADIAN BIOSYSTEMS ENGINEERING
7.27
ASTM. 2001. Standard test methods for complex permittivity (dielectric constant) of solid electrical insulating materials at microwave frequencies and temperatures to 1650°C. Method B (resonant cavities), Designation D, 2520-2601. West Conshohocken, PA: American Society for Testing and Materials. Bengtsson, N.E. and P.O. Risman.1971. Dielectric properties of food at 3 GHz as determined by a cavity perturbation technique. II. Measurements on food materials. Journal of Microwave Power 6(2):107-123. Blackham, D.V. and R.D. Pollard. 1997. An improved technique for permittivity measurements using a coaxial probe. IEEE Transactions of Instrumentation and Measurement 46(5):1093-1099. Brown, G.H., C.N. Hoyler and R.A. Bierworth. 1947. Theory and Applications of Radio Frequency Heating. New York, NY: Van Nostrand Company Inc. Buffler, C.R. 1993. Microwave Cooking and Processing. New York, NY: Van Nostrand Reinhold. Burdette, E.C., F.L. Cain and J. Seals. 1982. In-itu tissue permittivity at microwave frequencies: Perspective, techniques, results. Research publications. Atlanta, GA: Biomedical Research Branch, Electronics Technology Laboratory, Engineering Experiment Station, Georgia Institute of Technology. Bussey, H.E. 1967. Measurement of RF properties of materials A survey. Proceedings of IEEE Conference 55(6):10461053. Corcoran, P.T., S.O. Nelson, L.E. Stetson and C.W. Schlaphoff. 1970. Determining dielectric properties of grain and seed in the audio frequency range. Transactions of the ASAE 13(3): 348-351. Debye, P. 1929. Polar Molecules. New York, NY: The Chemical Catalog Company. Decareau, R.V. 1985. Microwaves in Food Processing Industry, Orlando, FL: Academic Press. de Loor, G.P. and F.W. Meijboom. 1966. The dielectric constant of foods and other materials with high water contents at microwave frequencies. Journal of Food Technology 1: 313-322. Dunlap, W.C., and B. Makower. 1945. Radio frequency dielectric properties of dehydrated carrots. Journal of Physical Chemistry 49: 601-622. Engelder, S.E. and C.R. Buffler. 1991. Measuring dielectric properties of food products at microwave frequencies. Microwave World 12(2): 6-15. Field, R.F. 1954. Lumped circuits and dielectric measuring techniques. In Dielectric Materials and Applications, ed. A. von Hippel, 12-22. New York, NY: John Wiley and Sons. Ghannouchi, F.M., and R.G. Bosisio. 1989. Measurement of microwave permittivity using a six-port reflectometer with an open-ended coaxial line. IEEE Transactions on Instrumentation and Measurement 38(2): 505-508. Grant, J.P., R.N. Clarke, G.T. Symm and N.M. Spyrou. 1989. A critical study of the open-ended coaxial line sensor technique for RF and microwave complex permittivity measurements. Journal of Physics: Electronics and Scientific Instrument 22:757-770. 7.28
Horsfield, B., J.A.R. Ball, J.R. Holdem, R.B. Keam, W.S. Holmes and A. Green. 1996. Cheese curd permittivity and moisture measurement using a microwave reflectometer. In Proceedings of IEEE Asia-Pacific Microwave Conference, 128-132.. HP. 1992. Dielectric probe kit 85070A. Palo Alto, CA: Research and Development Unit, Test and Measurements Laboratories, Hewlett Packard Corporation. Jorgensen, J.L., A.R. Edison, S.O. Nelson, and L.E. Stetson. 1970. A bridge method for dielectric measurements of grain and seed in the 50- to 250- MHz range. Transactions of ASAE 13(1):18-20, 24. Keam, R.B. 1997. Loadsnoop: A new tool for magnetron matching. Newsletter of Association for Microwave Power in Europe for Research and Education (AMPERE), Auckland, New Zealand: Keam Holdem Associates, AMPERE Europe Limited. Keam, R.B. 1998. Input admittance of a coaxial-line driven cylindrical cavity with a centre dielectric rod. IEEE Microwave and Guided Wave Letters 8(2): 49-51. Keam, R.B. and J.R. Holdem. 1997a. Permittivity measurement using a coaxial-line conical tip probe. IEEE Electronics Letter 33(5): 353-355. Keam, R.B. and J.R. Holdem. 1997b. On-line measurement of cheese properties using microwave sensing. Report on New Zealand Dairy Board Category II /MEC Funding with Kiwi Co-op Dairies Ltd. Auckland, New Zealand: Research and development branch, Keam Holdem, Industrial RF and MW Technology. Keam, R.B. and W.S. Holmes.1995. Uncertainty analysis of measurement of complex permittivity using microstrip transmission line. In Proceedings SBMO/IEEE MTT-S IMOC’95, 137-142. Piscataway, NJ: IEEE. Kent, M. and E. Kress-Rogers. 1986. Microwave moisture and density measurements in particulate solids. Transactions of the Institute of Measurement and Control (IMC) 8(3): 167168. Kent, M., W. Meyer, W. Schilz and R. Knochel. 1993. An online microwave instrument to monitor the solids content of milk products during processing. Journal of Society for Dairy Technology 46(3): 96-99. Kim, Y.R., M.T. Morgan, M.R. Okos and R.L. Stroshine. 1998. Measurement and prediction of dielectric properties of biscuit dough at 27 MHz. Journal of Microwave Power and Electromagnetic Energy 33(3): 184-194. King, R.J. 1997. On-line moisture and density measurement of foods with microwave sensors. Applied Engineering in Agriculture 13(3): 361-371. Knipper, N.V. 1953. Use of high frequency currents for grain drying. Journal of Agricultural Engineering Research 2: 185. Kraszewski, A.W. 1980. Microwave aquametry - A review. Journal of Microwave Power 15(4): 209-220. Kraszewski, A. 1996. Microwave Aquametry - Electromagnetic Interaction with Water Containing Materials. Piscataway, NJ: IEEE Press.
LE GÉNIE DES BIOSYSTÈMES AU CANADA
VENKATESH and RAGAVAN
Kudra, T., G.S.V. Raghavan, C.Akyel, R. Bosisio and F.R. van de Voort. 1992. Electromagnetic properties of milk and its constituents at 2.45 MHz. Journal of Microwave Power 27(4):199-204. Lawrence, K.C., S.O. Nelson and P.G. Bartley, Jr. 1998. Coaxial dielectric sensor for cereal grains. In Proceedings IEEE IMTC 1:541-546. Liao, X., G.S.V. Raghavan, V. Meda and V.A. Yaylayan. 2001. Dielectric properties of supersaturated a-D-glucose aqueous solutions at 2450 MHz. The Journal of Microwave Power and Electromagnetic Energy 36(3):131-138. Mashimo, S., S. Kuwabara, S.Yagihara and K. Higasi. 1987. Dielectric relaxation time and structure of bound water in biological materials. Journal of Physical Chemistry 91(25): 6337-6338. Metaxas, A.C. and R. Meredith. 1983. Industrial Microwave Heating (IEEE Power Engineering Series). Piscataway, NJ: Peter Peregrinus. Mudgett, R.E. 1995. Electrical properties of foods. In Engineering Properties of Foods, 2nd edition, eds. M.A. Rao and S.S.H. Rizvi, 389-455. New York: Marcel Dekker Inc. Mudgett, R.E., S.A. Goldblith, D.I.C. Wang and W.B. Westphal. 1980. Dielectric behavior of semi-solid food at low, intermediate and high moisture contents. Journal of Microwave Power 15(1): 27-36. Nelson, S.O. 1973. Electrical properties of agricultural products - A critical review. Transactions of the ASAE 16(2): 384400. Nelson, S.O. 1983. Density dependence of the dielectric properties of particulate materials pulverized coal, flour, wheat samples. Transactions of the ASAE 26(6): 1823-1825, 1829. Nelson, S.O. 1984. Moisture, frequency, and density dependence of the dielectric constant of shelled, yellow-dent field corn. Transactions of the ASAE 30(5): 1573-1578, 1585. Nelson, S.O. 1991. Dielectric properties of agricultural products - Measurements and applications. IEEE Transactions of Electrical Insulation 26(5): 845-869. Nelson, S.O. 1994. Measurement of microwave dielectric properties of particulate materials. Journal of Food Engineering 21(3): 365-384. Nelson, S.O. 1998. Dielectric properties measuring techniques and applications. ASAE Paper No. 983067. St. Joseph, MI: ASAE. Nelson, S.O. and A.W. Kraszewski. 1990a. Grain moisture content determination by microwave measurements. Transactions of ASAE 33(4): 1303-1307. Nelson, S.O. and A.W. Kraszewski. 1990b. Dielectric properties of materials and measurement techniques. Drying Technology 8(5): 1123-1142. Nelson, S.O. and T.S. You. 1989. Microwave dielectric properties of corn and wheat kernels and soybeans. Transactions of the ASAE 32(1): 242-249.
Volume 47
2005
Nelson, S.O., L.E. Stetson and C.W. Schlaphoff. 1974. A general computer program for precise calculation of dielectric properties from short-circuited wave-guide measurements. IEEE Transactions of Instrumentation and Measurement 23(4): 455-460. Nelson, S.O., W.R. Forbus, Jr. and K.C. Lawrence. 1994. Microwave permittivities of fresh fruits and vegetables from 0.2 to 20 GHz. Transactions of ASAE 37(1):183-189. Nyfors, E. and P. Vainikainen. 1989. Industrial Microwave Sensors, chapter 2. Boston, MA: Artech House, Norwood. Ohlsson, T. and N.E. Bengtsson. 1975. Dielectric food data for MW sterilization processing. Journal of Microwave Power 10(1): 93-108. Ohlsson, T., N.E. Bengtsson and P.O. Risman. 1974. The frequency and temperature dependence of dielectric food data as determined by a cavity perturbation technique. Journal of Microwave Power 9(2):129-145. Pace, W.E., W.B. Westphal and S.A. Goldblith. 1968. Dielectric properties of commercial cooking oils. Journal of Food Science 33: 30-36. Puranik, S., A. Kumbhakarne and S. Mehrotra. 1991. Dielectric properties of honey-water mixtures between 10 MHz and 10 GHz using time domain technique. Journal of Microwave Power and Electromagnetic Energy 26(4):196-201. Roberts, S. and A. von Hippel. 1946. A new method for measuring dielectric constant and loss in the range of centimetre waves. Journal of Applied Physics 17:610-616. Ryynanen, S. 1995. The electromagnetic properties of food materials: A review of basic principles. Journal of Food Engineering 27(4): 409-429. Rzepecka, M.A. and R.R. Pereira. 1974. Permittivity of some dairy products at 2450 MHz. Journal of Microwave Power 9(4): 277-288. Rzepecka, M.A., S.S. Stuchly and M.A.K. Hamid. 1972. Applications for microwave treatment of granular materials in agriculture. Report TR-72(1)-35. Blacksburg, VA: IMPI Publications. Sharma, G.P. and S. Prasad. 2002. Dielectric properties of garlic (Allium Sativum L.) at 2450 MHz as function of temperature and moisture content. Journal of Food Engineering 52(4): 343-348. Shaw, T.M. and J. A. Galvin. 1949. High frequency heating characteristics of vegetable tissues determining from electrical conductivity measurements. In Proceedings Institution of Radio Engineering, Institute of Radio Engineering and Electronics Publication 37:83-86. Chaberska, Prague: IREE. Sheen, N.I. and I.M. Woodhead. 1999. An open-ended coaxial probe for broad-band permittivity measurement of agricultural products. Journal of Agricultural Engineering Research 74:193-202. Stetson, L.E., and S.O. Nelson. 1970. A method for determining dielectric properties of grain and seed in the 200- to 500MHz range. Transactions of ASAE 13(4): 491-495. Stuchly, M.A. and S.S. Stuchly. 1980. Dielectric properties of biological substances - Tabulated. Journal of Microwave Power 15:19-26.
CANADIAN BIOSYSTEMS ENGINEERING
7.29
Sucher, M. and J. Fox. 1963. Handbook of Microwave Measurements. New York, NY: Polytechnic Press Institute. Thompson, D.R. and G.L. Zachariah. 1971. Dielectric theory and bioelectrical measurements [Part II. Experimental (Apples)]. Transactions of ASAE 14(2): 214-215. To, E.C., R.E. Mudgett, D.I.C. Wang, S.A. Goldblith and R.V. Decareau. 1974. Dielectric properties of food materials. Journal of Microwave Power 9(4): 303-315. Torgovikov, G.I. 1993. Dielectric Properties of Wood and Wood Based Materials. New York, NY: Springer-Verlag. Trabelsi, S., A.W. Kraszewski and S.O. Nelson. 1997. A new density-independent function for microwave moisture content determination in particulate materials. In Proceedings of IEEE Instrumentation and Measurement Technology Conference. Trabelsi, S., A.W. Kraszewski and S.O. Nelson. 1998. Nondestructive microwave characterization for bulk density and moisture content determination in shelled corn. Measurement Science and Technology 9: 570-578. Tran, V.N., S.S. Stuchly and A.W. Kraszewski. 1984. Dielectric properties of selected vegetables and fruits at 0.1 - 10 GHz. Journal of Microwave Power 19(4): 251-258. van Dyke, D., D.I.C. Wang and S.A. Goldblith. 1969. Dielectric loss factor of reconstituted ground beef: The effect of chemical composition. Journal of Food Technology 23: 784. Venkatesh, M.S. 1996. Cavity perturbation technique for measurement of dielectric properties of some agri-food materials. Unpublished M.Sc. thesis. Montreal, QC: Department of Agricultural Engineering, McGill University. Venkatesh, M.S. 2002. Development of integrated dual frequency permittivity analzer using cavity perturbation concept. Unpublsihed Ph.D. thesis. Montreal, QC: Department of Agricultural and Biosystems Engineering, McGill University.
7.30
Venkatesh, M.S. and G.S.V. Raghavan. 1998. Dielectric properties measuring techniques – An overview of the development. ASAE- NABEC Paper No. 9808. St. Joseph, MI: ASAE. Venkatesh, M.S. and G.S.V. Raghavan. 2004. An overview of microwave processing and dielectric properties of agri-food materials. Biosystems Engineering 88(1): 1-18. Venkatesh, M.S., G.S.V. Raghavan and S.A. Sotocinal. 1998. Development of a permittivity analyzer to operate at 915 and 2450 MHz using cavity perturbation technique. CSAE Paper No. 98-315. Winnipeg, MB: CSAE/SCGR. von Hippel, A. 1954. Dielectrics and Waves. New York, NY: John Wiley and Sons. Wang, S., J. Tang, J.A. Johnson, E. Mitcham, J.D. Hansen, G. Hallman, S.R. Drake and Y. Wang. 2003. Dielectric properties of fruits and insect pests as related to radio frequency and microwave treatments. Biosystems Engineering 85(2): 201-12. Westphal, W.B. 1954. Distributed circuits, permittivity and dielectric properties measuring techniques. In Dielectric Materials and Applications, ed. A. von Hippel, 22-35. New York, NY: John Wiley and Sons. Xu, Y., F.M. Ghannouchi and R.G. Bosisio. 1992. Theoretical and experimental study of measurement of microwave permittivity using open ended elliptical coaxial probes. IEEE Transactions on Microwave Theory and Techniques 40(1):143-150. Zhao, Y., B. Flugstad, E. Kolbe, J.A. Park and J.H. Wells. 2000. Using capacitive (RF) dielectric heating in food processing and preservation -- A review. Journal of Food Process Engineering 23(1): 25-55.
LE GÉNIE DES BIOSYSTÈMES AU CANADA
VENKATESH and RAGAVAN