Bioinformatics, 31(11), 2015, 1839–1841 doi: 10.1093/bioinformatics/btv020 Advance Access Publication Date: 20 January 2015 Applications Note
Gene expression
MethylMix: an R package for identifying DNA methylation-driven genes Olivier Gevaert Department of Medicine, Stanford Center for Biomedical Informatics, Stanford, CA 94305-5479, USA Associate Editor: Ziv Bar-Joseph Received on February 12, 2014; revised on December 5, 2014; accepted on January 11, 2015
Abstract Summary: DNA methylation is an important mechanism regulating gene transcription, and its role in carcinogenesis has been extensively studied. Hyper and hypomethylation of genes is an alternative mechanism to deregulate gene expression in a wide range of diseases. At the same time, high-throughput DNA methylation assays have been developed generating vast amounts of genome wide DNA methylation measurements. Yet, few tools exist that can formally identify hypo and hypermethylated genes that are predictive of transcription and thus functionally relevant for a particular disease. To accommodate this lack of tools, we developed MethylMix, an algorithm implemented in R to identify disease specific hyper and hypomethylated genes. MethylMix is based on a beta mixture model to identify methylation states and compares them with the normal DNA methylation state. MethylMix introduces a novel metric, the ‘Differential Methylation value’ or DM-value defined as the difference of a methylation state with the normal methylation state. Finally, matched gene expression data are used to identify, besides differential, transcriptionally predictive methylation states by focusing on methylation changes that effect gene expression. Availability and implementation: MethylMix was implemented as an R package and is available in bioconductor. Contact:
[email protected]
1 Introduction DNA methylation is one of the most studied epigenetic aberrations underlying oncogenesis. Besides genetic mutations, hyper and hypomethylation of genes is an alternative mechanism that is capable of altering the normal state and driving a wide range of diseases. Prior studies have identified hypo or hypermethylation based on heuristic measures for example in breast cancer (Hill et al., 2011). Additionally, computational methods have been developed to identify differentially methylated regions for specific DNA methylation platforms (Aryee et al., 2014; Wang et al., 2012; Warden et al., 2013). However, few methods formalize the identification of DNA methylation driven genes using a model-based approach. We identified three key criteria that should be addressed to derive key methylation-driven genes. First, the determination of the degree of methylation cannot hinge on arbitrary thresholds as is commonly done. Second, the assessment of a gene as hyper or hypomethylated must be made in comparison to normal tissue. Finally, the
C The Author 2015. Published by Oxford University Press. V
identification of genes that are hyper or hypomethylated should be transcriptionally predictive effect, thereby implying that their methylation is functionally relevant. We designed MethylMix to accommodate these three criteria to identify methylation driven genes in diseases.
2 Algorithm MethylMix integrates DNA methylation from normal and disease samples and matched disease gene expression data via a three-step algorithm: •
Step i: Genes are filtered by identifying transcriptionally predictive methylation. First, each CpG site is associated with its closest gene. Next, MethylMix requires that the DNA methylation of a CpG site has a significant effect on its corresponding gene expression in order for the gene to be considered a methylation-driven gene. We define such genes as transcriptionally predictive genes.
1839
This is an Open Access article distributed under the terms of the Creative Commons Attribution Non-Commercial License (http://creativecommons.org/licenses/by-nc/4.0/), which permits non-commercial re-use, distribution, and reproduction in any medium, provided the original work is properly cited. For commercial re-use, please contact
[email protected]
1840 •
•
Step ii: The methylation states of a gene are identified using univariate beta mixture modeling to identify subgroups of patients with similar DNA methylation level for a specific CpG site. We use the Bayesian Information Criterion (BIC) to select the number of methylation states by iteratively adding a new mixture component if the BIC score improves. Each beta mixture component is referred to as a methylation state and represented by its mean methylation level. Step iii: Hyper and hypomethylated genes are defined relative to normal by comparing the methylation levels of each methylation state to the mean of the DNA methylation levels of normal tissue samples using a Wilcoxon rank sum test. Based on this test, Differential Methylation values or DM-values are created defined as the difference of a methylation state with the normal methylation state. Genes with methylation states different from normal are called differential genes.
The final output of MethylMix is genes that are both transcriptionally predictive and differential together with the parameters of their methylation states. Additionally, a matrix of DM-values is part of the output and can be used in subsequent analysis, for example to define methylation driven subgroups using clustering algorithms.
3 Functions and examples MethylMix was implemented in the statistical language R and is provided as an R package in the supplementary data. MethylMix contains two key functionalities; the creation of MethylMix models for a set of genes of any size and the visualization of a MethylMix plot for each gene. MethylMix needs three datasets: normal DNA methylation data, disease DNA methylation data and matched disease gene expression data. The normal DNA methylation data should ideally be from the same tissue or cell type as the disease DNA methylation data. We provided example data for 14 genes from 251 glioblastoma patients from The Cancer Genome Atlas (TCGA) (McLendon et al., 2008) in the package. The 14 genes were selected based on their documented differential DNA methylation status in glioblastoma in the literature (Etcheverry et al., 2010; Hegi et al., 2004). First, a MethylMix model is created for all genes as follows: > library(MethylMix) > data(METcancer) > data(METnormal)
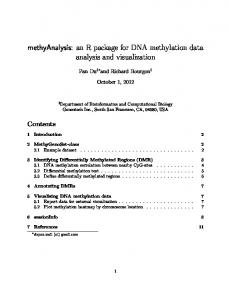
Fig. 1. MethylMix model for the MGMT gene based on 251 glioblastoma patients from TCGA
O.Gevaert > data(MAcancer) > MethylMixResults mal,MAcancer)
¼
MethylMix(METcancer,METnor
MethylMix will first investigate for each gene if it is transcriptionally predictive by building a linear regression model that estimates the association between DNA methylation and gene expression. MethylMix only selects genes with a significant inverse relationship (P value < 0.01) resulting in nine transcriptionally predictive genes in this example. Then a MethylMix model is created for these nine transcriptionally predictive genes and MethylMix reports how many methylation states each gene has. For large datasets with more genes, MethylMix can be run in parallel mode and take advantage of multiple cores. Next, a MethylMix model plot can be created for each gene visualizing the beta mixture model and the methylation states that were identified for a particular gene. Additional parameters can be passed to the plot function by adding the normal methylation data and the matched gene expression data. These additional parameters will visualize the 95% confidence interval of the normal DNA methylation data and the relationship with matched gene expression data. > MethylMix_PlotModel(’MGMT’,METcancer, MethylMix Results,MAcancer,METnormal) For example, Figure 1 displays the MethylMix model for MGMT showing two methylation states, whereby the low methylation state matches the normal methylation and the high methylation state corresponds to hypermethylation of MGMT, a well-known case of hypermethylation influencing treatment of glioblastoma patients (Hegi et al., 2004). Next, Figure 2 shows the inverse correlation between DNA methylation and matched gene expression of MGMT.
4 Conclusion MethylMix is an R package that identifies hyper and hypomethylated genes using a beta mixture modeling approach. MethylMix also quantifies the effect DNA methylation has on gene expression, thereby identifying transcriptionally predictive DNA methylation events. MethylMix can be used both to study single genes as in the example above or in parallel mode to build MethylMix models genome wide. MethylMix requires a large
Fig. 2. Inverse correlation of DNA methylation and gene expression for MGMT in 251 glioblastoma patients from TCGA
MethylMix cohort to identify methylation states and capture DNA methylation heterogeneity present in a particular disease. We used MethylMix and their associated DM-values to identify driver genes (Gevaert and Plevritis, 2013; Gevaert et al., 2013, 2014), on dataset sizes of 100 samples ore more, and on more than 4000 TCGA cases across 12 tissues to identify methylation driven subgroups (Gevaert et al., 2015). In summary, MethylMix offers a new tool to identify methylation-driven genes providing a complimentary source of information to copy number and mutation spectra to identify disease driver genes.
Funding This work was partially supported by NIH/NCI R01 CA160251 and NIH/NCI U01 CA176299. Conflict of Interest: none declared.
References Aryee,M.J. et al. (2014) Minfi: a flexible and comprehensive bioconductor package for the analysis of infinium DNA methylation microarrays. Bioinformatics, 30, 1363–1369. Etcheverry,A. et al. (2010) DNA methylation in glioblastoma: impact on gene expression and clinical outcome. BMC Genomics, 11, 701.
1841 Gevaert,O. and Plevritis,S. (2013) Identifying master regulators of cancer and their downstream targets by integrating genomic and epigenomic features. In: Pacific Symposium on Biocomputing, Big Island of Hawaii. World Scientific, Singapore, pp. 123–134. Gevaert,O. et al. (2013) Identification of ovarian cancer driver genes by using module network integration of multi-omics data. Interface Focus, 3, 20130013. Gevaert,O. et al. (2014) Glioblastoma multiforme: exploratory radiogenomic analysis by using quantitative image features. Radiology, 273, 168–74. Gevaert,O., et al. (2015) Pancancer analysis of DNA methylation-driven genes using MethylMix. Genome Biol., 16, 17. Hegi,M.E. et al. (2004) Clinical trial substantiates the predictive value of o-6-methylguanine-DNA methyltransferase promoter methylation in glioblastoma patients treated with temozolomide. Clin. Cancer Res., 10, 1871–1874. Hill,V.K. et al. (2011) Genome-wide DNA methylation profiling of cpg islands in breast cancer identifies novel genes associated with tumorigenicity. Cancer Res., 71, 2988–2999. McLendon,R. et al. (2008) Comprehensive genomic characterization defines human glioblastoma genes and core pathways. Nature, 455, 1061–1068. Wang,D. et al. (2012) IMA: an R package for high-throughput analysis of illumina’s 450k infinium methylation data. Bioinformatics, 28, 729–730. Warden,C.D. et al. (2013) Cohcap: an integrative genomic pipeline for single-nucleotide resolution DNA methylation analysis. Nucleic Acids Res., 41, e117.